FUZZY CONTROL CHART ANALYSIS OF MEAN WAITING TIME IN M / M / S QUEUING MODEL
*,1
Poongodi
1
Faculty of Engineering, Avinashilingam Institute for Home Science and Higher
Education for Women Coimbatore, India
2
Faculty of Science, Avinashilingam Institute for Home Science and Higher
Education for Women Coimbatore, India
ARTICLE INFO ABSTRACT
Queuing problems are most common features not only in our daily
counters, post offices, ticket booking centers, public transportation systems, but also in more technical environments such as in manufacturing, computer networki
observable performance characteristics
chart is a graphical technique used to monitor changes in process over time and signifies to evolve methods to control.
more realistic than that of assumed classical crisp parameters.
model control limits are established for the mean waiting time of customer
system under fuzzy environment. Numerical illustrations are given to highlight its applications.
Copyright © 2015 Poongodi and Muthulakshmi.This
unrestricted use, distribution, and reproduction in any medium, provided the original work is properly cited.
INTRODUCTION
In general, queues form when the demand for
its supply. Waiting time in the facility depends on the number of customers in the queue, the number of servers and the length of service time. Providing system with too much of service capacity involves loss to service providers whereas n providing system with enough service capacity results in excessive waiting time involving loss of customers. This warrants the optimal system to accommodate reduction in waiting time along with staffing and service facilities. Queueing model with multiple servers has been discussed by Gross and Harris (1998) and several other authors. Shewhart developed control chart technique based on one or several quality related characteristics of product or service to identify whether a production process or service facility meets required quality standards. Montgomery (2005) proposed a number of applications of Shewhart control charts in analyzing quality in manufacturing industries. Fazel Zarandi (2006) developed fuzzy control charts for quality characteristics of
attribute nature. In analysis of a textile industry,
Feili (2010) compared fuzzy control charts with probability control charts.
*Corresponding author:Poongodi, T. Faculty of Engineering,
Avinashilingam Institute for Home Science and Higher Education for Women Coimbatore, India.
ISSN: 0975-833X
Article History:
Received 20th May, 2015
Received in revised form 16th June, 2015
Accepted 16th July, 2015
Published online 21st August,2015
Key words:
Poisson Arrival, Exponential Service, s- Servers, Waiting Time, Fuzzy Control Chart.
Citation: Poongodi, T. and Muthulakshmi, S. 2015. “
International Journal of Current Research,7, (8),
RESEARCH ARTICLE
FUZZY CONTROL CHART ANALYSIS OF MEAN WAITING TIME IN M / M / S QUEUING MODEL
Poongodi, T. and
2Dr. (Mrs.) Muthulakshmi, S.
Faculty of Engineering, Avinashilingam Institute for Home Science and Higher
Education for Women Coimbatore, India
Faculty of Science, Avinashilingam Institute for Home Science and Higher
Education for Women Coimbatore, India
ABSTRACT
Queuing problems are most common features not only in our daily
counters, post offices, ticket booking centers, public transportation systems, but also in more technical environments such as in manufacturing, computer networking and telecommunications.
observable performance characteristics for any queueing system are length and waiting time. chart is a graphical technique used to monitor changes in process over time and signifies to evolve methods to control. To deal with practical situations the control chart with fuzzy parameters are much more realistic than that of assumed classical crisp parameters.
model control limits are established for the mean waiting time of customer
system under fuzzy environment. Numerical illustrations are given to highlight its applications.
This is an open access article distributed under the Creative Commons Att use, distribution, and reproduction in any medium, provided the original work is properly cited.
In general, queues form when the demand for service exceeds its supply. Waiting time in the facility depends on the number of customers in the queue, the number of servers and the length of service time. Providing system with too much of service capacity involves loss to service providers whereas not providing system with enough service capacity results in excessive waiting time involving loss of customers. This warrants the optimal system to accommodate reduction in waiting time along with staffing and service facilities. le servers has been discussed by Gross and Harris (1998) and several other authors. Shewhart developed control chart technique based on one or several quality related characteristics of product or service to identify facility meets required Montgomery (2005) proposed a number of applications of Shewhart control charts in analyzing quality in manufacturing industries. Fazel Zarandi (2006) developed fuzzy control charts for quality characteristics of variable and analysis of a textile industry, Hamid Reza Feili (2010) compared fuzzy control charts with probability
Faculty of Engineering,
Institute for Home Science and Higher Education for Women
Siamak Noori (2008) applied fuzzy control chart in earned value analysis. The applications of control charts in evaluating queueing models with many servers are discussed by Sho (2000) for random queue length of M/M/s queueing model in terms of the first three moments, Shore (2006) for G/G/S queueing system using skewness, Khaparde and Dhabe (2010) for random queue length of M/M/1 queueing model using method of weighted variance and
(2013) constructed for mean
M/M/s queuing model by assuming the inter
service times under non-fuzzy environment. However, in many practical situations, the arrival pattern and
typically described by linguistic values such as fast, slow or moderate rather than with complete probability distributions. The queueing models are more suitable for real life applications by considering system parameters as fuzzy numbers.
Chen (2006) provided a method to conserve the fuzziness of input information when some information of bulk service queueing system is ambiguous. Also Chen (2006) developed a non-linear programming approach to derive the membership function of steady state performance measures in bulk arrival queueing system with varying batch sizes.
International Journal of Current Research
Vol. 7, Issue, 08, pp.18988-18994, August, 2015
Muthulakshmi, S. 2015. “Fuzzy control chart analysis of mean waiting time in M / M / S queuing model 7, (8), 18988-18994.
FUZZY CONTROL CHART ANALYSIS OF MEAN WAITING TIME IN M / M / S QUEUING MODEL
S.
Faculty of Engineering, Avinashilingam Institute for Home Science and Higher
Faculty of Science, Avinashilingam Institute for Home Science and Higher
Queuing problems are most common features not only in our daily-life situations such as bank counters, post offices, ticket booking centers, public transportation systems, but also in more technical ng and telecommunications. The main system are length and waiting time. Control chart is a graphical technique used to monitor changes in process over time and signifies to evolve To deal with practical situations the control chart with fuzzy parameters are much In this paper for M/M/s queueing model control limits are established for the mean waiting time of customers both in queue and in the system under fuzzy environment. Numerical illustrations are given to highlight its applications.
is an open access article distributed under the Creative Commons Attribution License, which permits
applied fuzzy control chart in earned value analysis. The applications of control charts in evaluating queueing models with many servers are discussed by Shore (2000) for random queue length of M/M/s queueing model in terms of the first three moments, Shore (2006) for G/G/S queueing system using skewness, Khaparde and Dhabe (2010) for random queue length of M/M/1 queueing model using e and Poongodi and Muthulakshmi for mean waiting time in the system of M/M/s queuing model by assuming the inter-arrival times and fuzzy environment. However, in many practical situations, the arrival pattern and service pattern are typically described by linguistic values such as fast, slow or moderate rather than with complete probability distributions. The queueing models are more suitable for real life applications by considering system parameters as fuzzy
) provided a method to conserve the fuzziness of input information when some information of bulk service queueing system is ambiguous. Also Chen (2006) developed a linear programming approach to derive the membership state performance measures in bulk arrival queueing system with varying batch sizes.
OF CURRENT RESEARCH
In this paper, based on Zadeh’s extension principle by employing α- cut approach, the membership functions of the parameters of the control chart relating to the mean waiting time of customers in the queue and in the system of M/M/s queueing model are formulated by assuming the arrival rate and service rate as fuzzy numbers.
MATERIALS AND METHODS
M /M /s Queuing Model Description
M/M/s queuing system has s servers arranged in parallel. The customers arrive in a Poisson fashion with mean arrival rate λ and the service time at each server has an independent and identically distributed exponential distribution with rate µ. A customer on arrival may go to any of the free counters. The system has infinite capacity with First Come First Served (FCFS) queue discipline.
Parameters of the control chart
For M/M/s queuing model let Wq be the waiting time of customer in queue and Ws be the waiting time in the system. Then the mean waiting time in queue is derived as
E(Wq) = 2 o
s
P ρ) (1 μ) (s s!
s) (ρ
and the mean waiting time in the system is
E(Ws) = 2 o s
P ρ) (1 μ) (s s!
s) (ρ
+ μ
1
where Po =
1 s n
1 s
0
n
s!
(1
ρ)
)
s
(ρ
s)
(ρ
n!
1
and ρ = λ/(sμ)The variance of waiting time in queue is derived as,
Var(Wq) = 2 3 o q 2
s
))
(E(W
-P
ρ)
(1
μ)
(s
s!
s)
(ρ
2
and the variance of waiting time in system is
Var(Ws)=
2
o 2 s o
3 2 s
2 s!s(1 ρ) P
s) (ρ 1 P ρ) (1 s μs!
λ) 1) (s μ ( s) (ρ 1 2 μ
1
The parameters of the control chart for the mean waiting of customers in queue are
UCL = E(Wq) + 3 Var(Wq)
CL = E(Wq)
and LCL = E(Wq) - 3 Var(Wq)
The parameters of the control chart for the mean waiting time of customers in the system may be calculated using E(Ws) and Var(Ws).
Model with fuzzy parameters
The membership functions of the parameters of the control chart for the mean waiting time in queue and in the system of M
/M /s queueing systemare constructed by assuming the arrival
rate
λ
~
and the service rateμ
~
as fuzzy numbers. Then these fuzzy numbers are represented as
(x, (x)) / x X
λ ~
~λ
(y, (y)) / y Y
μ~
μ~
where ~λ(x)and μ~(y) denote the membership functions and
X and Y are the support of the fuzzy numbers~λandμ~
respectively.
Let P (x, y) and P~(~λ, μ~) denote the parameters of the control chart relating to mean waiting time of customers in the crisp and fuzzy environments respectively, where P stands for the
control chart parameters CL, UCL and LCL. As λ~andμ~ are
fuzzy numbers P~(λ~, μ~) will also be fuzzy. Using Zadeh’s extension principle (1978) the membership function of the control chart parameters of system performance measures
) μ ~ , λ ~ ( P ~
is defined as
(x), (y) / z P(x,y)
min sup
(z) λ~ μ~
Y y X, x ) μ ~ , λ ~ ( P
~
(1)
Now we consider the derivation of the control chart parameters
for mean waiting time of customers bothin queue and in the
system of M /M /s queueing model.
Control chart parameters for the meanwaiting time of customers in queue
The parameters of the fuzzy control chart for mean waiting time of customers in queue are
CL(x, y) = s-1 2 o s
P x) -(sy (y) 1)! -(s
(x)
,
Var(x, y) =
2 o
3 1 -s
s
y)) (CL(x, -P x) -(sy y) ( 1)! -(s
(x) 2
y) Var(x, 3 y) CL(x, y)
UCL(x,
and LCL(x,y) = CL(x,y)-3 Var(x,y)
where Po =
1 1
s
0
n s 1
s n
x) (sy 1)! (s (y)
(x) n!
(x/y)
A mathematical programming approach is developed for deriving the desiredmembership functions for CL, UCL and LCL on the basis of α- cuts.
The α- cut approach based on the extension principle
The α- cuts ofλ~andμ~ as crisp intervals are
x X/ (x) α
y Y/ (y) α
μα μ~ (3) These crisp sets may be expressed as
x X / (x) α , max x X / (x) α
min x
, x
λ λ~
X x λ ~ X x U α L α
α (4)
min y Y / y) α max y Y / μ~(y) α
Y y ( μ ~ Y y U α L α
α y ,y ,
μ (5)
These intervals provide information on the arrival rate and the service rate with possibilityα.
The bounds of these intervals in (4) and (5) are functions of α and may be obtained as
α) ( min 1 λ ~ L α
x
, max (α)
1 λ ~ U
α
x
andy min 1(α)
μ ~ L
α
, y max (α)
1 μ~ U
α
The membership function defined in (1) is also parameterized byα. Thereforeα-cuts may be used to construct the membership function.
Construction of membership function
Consider the membership function relating to CL of the control chart for the mean waiting time of customers in queue as
(z)
L ~ C
. As given in (1), L~(z)
C
is the minimum of
(y) and
(x) μ~
λ
~
To deal with the value of the membership function, we need at least one of the following two cases to hold such that z = CL(x, y) and L~(z) α
C
(i) :λ~(x)= α, μ~(y)≥ α
and (ii) :λ~(x)≥ α, μ~(y)= α (6)
From the definitions of λα and μα in equations (2) and (3), x ϵ λα and y ϵ μα may be replaced by
x ϵ [ xα L
, xα U
] and y ϵ [ yα L
, yα U
] respectively. The following are the formulated parametric non-linear programs (NLPs) for finding the lower and upper bounds of the α-cut of L~(z)
C
corresponding to the two cases stated in (6).
Case (i): 1 L α )
(CL s-1 2 o
s P x) -(sy (y) 1)! -(s (x) min
subject to x x xU and y μ
α L
α
1 U α
CL)
( s-1 2 o
s
P
x)
-(sy
(y)
1)!
-(s
(x)
max
subject to x x xU and y μ
α L
α
Case (ii): 2 L α )
(CL s-1 2 o
s
P
x)
-(sy
(y)
1)!
-(s
(x)
min
subject to
x
λ
αand
y
Lα
y
y
αU
2 U α
)
(CL s-1 2 o
s
P
x)
-(sy
(y)
1)!
-(s
(x)
max
subject to
x
λ
αand
y
Lα
y
y
UαIt is sufficient to find the left shapefunction L(z) and the right shapefunction R(z) of L~(z)
C
which in turnare used to find
the lower bound
L αCL and the upper bound
U αCL of α- cuts of
. L)
C~
(
These may be rewritten as
=
)
(
s-1 2 os Y ∈ y X, ∈ x L α
P
x)
-(sy
y)
(
1)!
-(s
(x)
min CLsubject to x ≤ x ≤xU α L
α and yLα≤ y ≤yUα (7)
=
)
(
s-1 2 os Y ∈ y X, ∈ x U α
P
x)
-(sy
y)
(
1)!
-(s
(x)
max CLsubject to x ≤ x ≤xU α L
α and yLα≤ y ≤yUα (8)
At least one of x and y must be on the boundary of the constraints in equations (7) and (8) to satisfy L~(z)
C
= α. This
pair of mathematical programs falls into the category of parametric non- linear programs which facilitates the systematic study of how the optimal solutions change when xαL ,xαU ,yαL and yαU as α ranges over the interval [0,1]. The
interval
U
α L α ,(CL) CL)
( is a crisp interval representing the α-
cuts of (C~L). Again based on the extension principle and the convexity property of fuzzy numbers we obtain
1 1 α 2 α 0 for CL CL CL
CL
)
,
(
)
(
)
,
(
)
(
U 2 α L 2 α U 1 α L 1α
In other words, as α increases, the values of
CL
Lα increaseand
CL
Uα decrease.The α-cuts give the possible range for the performance measure. At α = 0, the range for the support of the performance measure is calculated and at α = 1, the most possible range for the performance measure is calculated.
If both the lower bound
CL
Lα and the upper bound
CL
αUobtained as L(z) =
(CL)αL
1 and R(z) =
(CL)αU
1 . Then the membership function L~(z)
C
can be expressed as
U 0 α U 1 α U 1 α L 1 α L 1 α L 0 α L~ C (CL) z (CL) R(z), (CL) z (CL) 1, (CL) z (CL) L(z), (z)
Yager ranking index method based on area compensation is used to defuzzify (C~L) of the mean waiting time of customers in queue into a crisp one. TheYager ranking index is
dα1 0 (CL) (CL) 2 1 ) (
Y~CL~ Lα αU
By following the similar procedure, the membership functions
(z)
L C~ U
and C~L(z)
L
and the Yager ranking indices relating to the parameters of the control chart namely UCL and LCL may be derived.
Control chart parameters for mean waiting time of customers in the system
The parameters of the fuzzy control chart for mean waiting time of customers in the system are
CL(x, y) = y
1 P ) x -sy ( (y) 1)! -(s (x) o 2 1 -s s ,
Var(x, y) = s 2 3 o 2
s
2 P (CL(x,y))
x) (sy 1)! (s y x) 1) (y(s x 1 y 2 y) Var(x, 3 y) CL(x, y)
UCL(x,
and LCL(x,y) CL(x,y)3 Var(x,y)
The membership functions and the Yager ranking indices of the parameters of fuzzy control chart relating to the mean waiting time of customers in the system may be derived by adopting the procedure described to mean waiting time of customers in queue presented in the previous section.
Numerical analysis
Three counters are being run on the frontier of a country to check the passports and the necessary documents of the tourists. The arrival pattern of the tourists for verification is assumed to be Poisson with rate λ and the service time of the tourists is assumed to have an exponential distribution with parameter μ.
The arrival rate and service rate are assumed as triangular fuzzy numbers represented by
λ ~
= [5, 7, 9] and μ~= [4, 5, 6].
To avoid congestion in waiting room the authorities of the office wish to analyze the mean waiting time oftourists both in the queue and in the system using fuzzy control charts. The upper and lower bounds of ~λandμ~are obtained as
[xα L
, xα U
] = [2α + 5, 9 – 2α] , [yα L
, yα U
] = [ α + 4, 6 – α ] and s = 3.
Fuzzy control chart for mean waiting time of tourists in the queue
Using the software MATLAB the upper and lower bounds of the parameters of fuzzy control chart for mean waiting time of tourists in the queue is derived as
L αCL = (2α+ 5)3/((5α - 13)(α - 6)(2α2 - 24α + 361))
U αCL = -(2α - 9)3/((5α + 3)(α+ 4)(2α2 + 16α + 321))
Lα
var = -((2α + 5)3(12α3 - 12α2 + 1160α - 4207))/((5α - 13)2(α - 6)2(2α2 - 24α + 361)2)
Lα
UCL =
CL
Lα+3(
var)
Lα
Uα
var = -((2α - 9)3(12α3 - 60α2 + 1256α + 1839))/((5α + 3)2(α + 4)2(2α2 + 16α + 321)2)
Uα
UCL =
CL
Uα + 3(
var)
Uα
Lα
LCL = (CL)αL - 3
(
var)
Lαand
Uα
LCL =
CL
Uα - 3(
var)
UαFor various values of α ϵ [ 0, 1 ], the values of the upper and lower bounds of the parameters of fuzzy control chart are calculated and presented in Table 1.
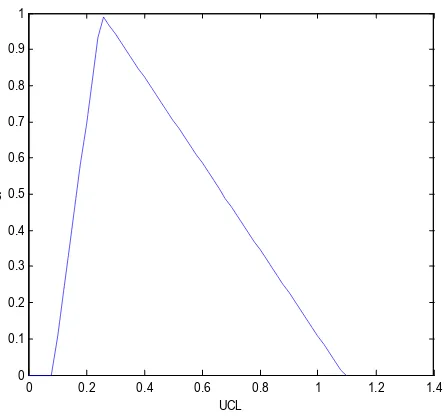
At α = 0 the range of CL is [0.0044, 0.1893] indicating that CL of mean waiting time of tourists in the queue will never exceed 0.1893 or fall below 0.0044. The UCL will never exceed 1.0910 or fall below 0.0817.
[
At α = 1 the values of CL and UCL are 0.0253 and 0.2515 respectively. Theupper andlower bounds of LCL are By using Yager ranking index method the expected CL and UCL of the mean waiting time of tourists in queue are
0441 . 0 dα (CL) (CL) 2 1 ) L ~ (C Y~ 1 0 U α L α 3424 . 0 dα (UCL) (UCL) 2 1 L) C ~ (U
Y~ 1
0 U α L α
With the help of MATLAB, the inverse functions L(z) and R(z) of (CL)αL, (CL)αU, (UCL)αL and (UCL)αU are obtained. The membership functions L~(z)
C
and C~L(z)
U
can be
The shape of membership functions L~(z)
C
and C~L(z)
U
[image:5.595.145.448.63.181.2]α- cuts of CL and UCL relating to mean waiting time oftourists in the queue are displayed in Figs.1 and 2 respectively.
Fig.1. The Membership function of CL of the mean waiting time of tourists in the queue
Fig. 2. The Membership function of UCL of the mean waiting time of tourists in the queue
The upper and lower bounds of the parameters of fuzzy control chart for mean waiting time of tourists in the system are
Lα
CL
= 34/(2α2 - 24α + 361) - 1/(5α - 13)
Uα
CL
= 1/(5α + 3) + 34/(2α2 + 16α + 321)
Lα
var
= (4α5 - 3520α4 + 32176α3 - 554612α2 + 2604293α- 3758354)/((5α- 13)2(α- 6)(2α2 –24α+ 361)2)
Lα
UCL = (CL)αL + 3
(
var)
Lα
Uα
var
= (4α5 + 3480α4 + 4176α3 + 445716α2 + 659637α + 567000)/((5α + 3)2 (α + 4)(2α2 + 16α + 321)2)
Uα
UCL = (CL)αU + 3
(
var)
Uα
Lα
LCL = (CL)αL - 3
(
var)
Lαand
Uα
LCL = (CL)αU - 3
(
var)
UαFor various values of α ϵ [0,1] the values of the upper and lower bounds of the parameters of fuzzy control chart are calculated and presented in Table 2.
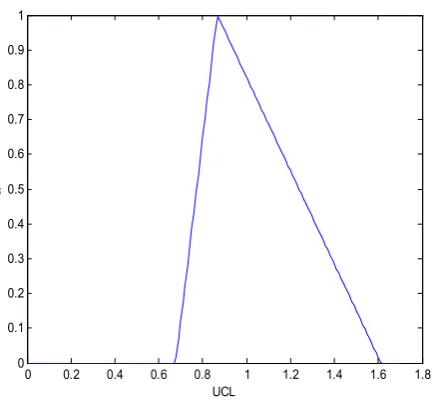
At α = 0 the range of the CL is [0.1711, 0.4393] indicating that CL of mean waiting time of tourists in the system will never exceed 0.4393 or fall below 0.1711. The UCL will never exceed 1.6121 or fall below 0.6770.
At α = 1 the values of CL and UCL are 0.2253 and 0.8665 respectively.
By using Yager ranking index method the expected CL and UCL of the meanwaiting time of tourists in the system are
2468 . 0 dα (CL) (CL) 2 1 )
L~
(C
Y~
1
0
U α L
α
9397 . 0 dα (UCL) (UCL)
2 1 L)
C~
(U
Y~ 1
0
U α L
α
With the help of MATLAB, the inverse functions L(z) and R(z) of (CL)αL, (CL)αU, (UCL)αL and (UCL)αU are obtained.
0 0.02 0.04 0.06 0.08 0.1 0.12 0.14 0.16 0.18 0.2
0 0.1 0.2 0.3 0.4 0.5 0.6 0.7 0.8 0.9 1
CL
0 0.2 0.4 0.6 0.8 1 1.2 1.4
0 0.1 0.2 0.3 0.4 0.5 0.6 0.7 0.8 0.9 1
UCL
[image:5.595.56.276.245.459.2]
Table 1. α- cuts of arrival and service rates and the parameters of fuzzy control chart for mean waiting time of tourists in the queue
α xαL xαU yαL yαU (CL)αL (CL)αU (UCL)αL (UCL)αU (LCL)αL (LCL)αU
[image:5.595.51.274.502.710.2]Fig.3 The Membership function of CL of the mean waiting time of tourists in the system
Fig. 4 The Membership function of UCL of the mean waiting time of tourists in the system
The corresponding membership functionsCL~(z)and UC~L(z)
may be expressed as
4393 . 0 z .2253 0 U(z),
2253 . 0 z 0.1711 L(z), (z)
L ~ C
and
6121 . 1 z .8665 0 U(z),
8665 . 0 z 0.6770 L(z), (z)
L C ~ U
The shapes of the membership functions CL~(z)and UC~L(z)
are displayed in Figs.3 and 4 respectively.
Conclusion
In this paper, fuzzy control chart for waiting timeis constructed to analyze the queueing model by employing a pair of parametric non-linear programming to findα- cuts of the membership functions. By this analysis the system designers and the decision makers may improve the existing systems. This approach maintains the fuzziness of input information to represent the real time system.
REFERENCES
Chen, S.P. 2005. “Parametric non-linear programming approach to fuzzy queues with bulk service”, European Journal of Operations Research, 163, pp: 434-444.
Chen, S.P. 2006, “A bulk arrival queueing model with fuzzy parameters and varying batch sizes,” Applied Mathematical Modeling, 30, pp: 920- 929.
Fazel zarandi, M. H., Turksen, I. B. and Kashan, A. H., 2006,“ Fuzzy control charts for variableand attribute quality characteristics”, Iranian Journal of Fuzzy Systems, Vol. 3, No. 1, pp: 31-44.
Feili, H. R., and Fekraty, P. 2010, “ Comparing fuzzy charts with probability charts and usingthem in a textile company ,”The Journal of Mathematics and Computer Science, Vol .1, No.4, pp: 258-272.
Gross, D.and Harris, M.,1998, “Fundamentals of queueing theory,” 5th edition, John wiley & sons, Inc.,.
Khaparde, M.V. and Dhabe, S.D. 2010, “Control chart for random queue length N for (M/M/1):(∞/FCFS)
Montgomery, D.C., 2005,“Introduction to statistical quality control,”5th edition, John wiley & sons, Inc.
Noori, S., Bagherpour, M. and Zareei, A. 2008. “Applying fuzzy control chart in earned value analysis: A new application,” World Applied Sciences Journal, 3 (4), pp: 684-690.
0 0.05 0.1 0.15 0.2 0.25 0.3 0.35 0.4 0.45 0.5
0 0.1 0.2 0.3 0.4 0.5 0.6 0.7 0.8 0.9
CL
0 0.2 0.4 0.6 0.8 1 1.2 1.4 1.6 1.8
0 0.1 0.2 0.3 0.4 0.5 0.6 0.7 0.8 0.9 1
UCL
[image:6.595.55.272.481.681.2]
Table 2. α- cuts of arrival and service rates and the parameters of fuzzy control chart for mean waiting time of tourists in the system
α xαL xαU yαL yαU (CL)αL (CL)αU (UCL)αL (UCL)αU (LCL)αL (LCL)αU
0.0 5.0 9.0 4.0 6.0 0.1711 0.4393 0.6770 1.6121 -0.3348 -0.7336 0.1 5.2 8.8 4.1 5.9 0.1748 0.3911 0.6905 1.4387 -0.3409 -0.6565 0.2 5.4 8.6 4.2 5.8 0.1788 0.3548 0.7048 1.3103 -0.3473 -0.6006 0.3 5.6 8.4 4.3 5.7 0.1830 0.3265 0.7200 1.2115 -0.3540 -0.5584 0.4 5.8 8.2 4.4 5.6 0.1876 0.3037 0.7362 1.1329 -0.3611 -0.5254 0.5 6.0 8.0 4.5 5.5 0.1925 0.2850 0.7536 1.0689 -0.3686 -0.4989 0.6 6.2 7.8 4.6 5.4 0.1979 0.2693 0.7724 1.0155 -0.3766 -0.4769 0.7 6.4 7.6 4.7 5.3 0.2038 0.2559 0.7928 0.9701 -0.3852 -0.4583 0.8 6.6 7.4 4.8 5.2 0.2102 0.2443 0.8150 0.9310 -0.3946 -0.4423 0.9 6.8 7.2 4.9 5.1 0.2173 0.2342 0.8394 0.8968 -0.4047 -0.4284 1.0 7.0 7.0 5.0 5.0 0.2253 0.2253 0.8665 0.8665 -0.4159 -0.4159
Poongodi, T. and Muthulakshmi, S.,2013, “Control chart for waiting time in system of (M / M / s) :( ∞ / FCFS) Queuing model,” IOSR Journal of Mathematics, Vol. 5, No. 6, pp : 48-53.
Queueing model,” International Journal of Agricultural and Statistical sciences,Vol.1, pp: 319-334.
Shore, H. 2000, “General control charts for attributes,” IIE Transactions, Vol. 32, pp: 1149-1160.
Shore, H., 2006, “Control charts for the queue length in a G/G/S System,” IIE Transactions, Vol. 38, pp : 1117-1130. Wang, S. and Wang, D. 2005, “Membership function solution to multiple-server fuzzy queues, ”Proceedings of International Conference on Services Systems and Services Management, IEEE Publications, Vol. 1, pp : 274 – 277. Zadeh., L.A.,1978, “Fuzzy set theory and its applications,” 2nd
edition., Kluwer-Nijhoff, Boston.