ORIGINAL RESEARCH
Changes in Fiber Integrity, Diffusivity, and
Metabolism of the Pyramidal Tract Adjacent to
Gliomas: A Quantitative Diffusion Tensor Fiber
Tracking and MR Spectroscopic Imaging Study
A. Stadlbauer C. Nimsky S. Gruber E. Moser T. Hammen T. Engelhorn M. Buchfelder O. Ganslandt
BACKGROUND AND PURPOSE: The underlying changes in the neuronal connectivity adjacent to brain tumors cannot always be depicted by conventional MR imaging. The hypothesis of this study was that preoperative sensorimotor deficits are associated with impairment in pyramidal fiber bundles. Hence, we investigated the potential of combined quantitative diffusion tensor (DT) fiber tracking and MR spectroscopic imaging (MRSI) to determine changes in the pyramidal tract adjacent to gliomas.
MATERIALS AND METHODS:Quantitative DT fiber tracking and proton MRSI were performed in 20 patients with gliomas with WHO grades II–IV. Eight patients experienced preoperative sensorimotor deficits. Mean diffusivity (MD), fractional anisotropy (FA), and number of fibers per voxel (FpV) were calculated for the pyramidal tract of the ipsilateral and contralateral hemisphere. Metabolite concen-trations for choline-containing compounds (Cho), creatine (Cr), and N-acetylaspartate (NAA) were computed, using LCModel, for all voxels located at the pyramidal tracts.
RESULTS: For the whole pyramidal tract, quantitative DT fiber tracking resulted in significantly lower FpV and FA values (P⬍.001), but not MD values, for the ipsilateral hemisphere. For the section of the fiber bundle closest to the lesion, we found significantly decreased FpV and FA (P ⬍ .001) and increased MD (P⫽.002). MRSI showed, for the same volumes of interest, significantly decreased NAA (P⫽.001), increased Cho (P⫽.034) and Cho/NAA (P⫽.001) for the ipsilateral pyramidal tract. In patients suffering sensorimotor deficits, we found significantly lower FA (P⫽.022) and higher MD values (P⫽.026) and a strongly negative correlation between FA and MD (R⫽ ⫺0.710,P⫽.024) but no correlation in patients without deficits (R⫽0.078, ns).
CONCLUSION:Quantitative DTI was able to show significant differences in diffusivity of the pyramidal tract in patients with sensorimotor deficits in relation to patients without them. The additional use of proton MRSI may be helpful to discern whether these diffusivity changes in fiber tracts are caused by tumor infiltration or peritumoral edema.
T
he pyramidal tract is a major pathway of the central ner-vous system. This massive collection of axons originates from the motor cortex areas and the postcentral gyrus and descends through the brain stem to the spinal cord. Mild im-pairment or even damage of the corticospinal fibers is often seen in patients with glioma and may result in sensorimotor deficits. Conventional MR imaging, however, cannot always depict the underlying changes of the affected fiber bundles.MR diffusion tensor imaging (DTI) enables detection of anisotropic water diffusion in the brain1,2using at least 6 dif-ferent diffusion gradient directions. The anisotropy of water diffusion in the white matter (WM) derives from its organiza-tion in myelinated axonal fibers, where diffusion is slowest perpendicular to the fiber tract.3It is common practice to cal-culate parametric maps of mean diffusivity (MD) and frac-tional anisotropy (FA) out of DTI data combined with manual segmentation of regions of interest (ROIs) for evaluation. MD and FA describe the magnitude and directionality of water
diffusion, respectively. Fiber tracking is another method for evaluating DTI data that permits in vivo investigation of neu-ronal fibers using a tracking algorithm that compares the in-formation about the orientation of water diffusion on a voxel-to-voxel basis. Recent studies have shown possibility to reconstruct fiber tracts adjacent to the tumor even if the tracts are displaced, disrupted, or invaded by the tumor.4-7The re-constructed fiber bundles are commonly used for visual or qualitative assessment. Quantitative fiber tracking8-10is an ap-proach to determine DTI (eg, FA and MD) and fiber parame-ters (eg, fiber attenuation) of WM structures using a fiber-tracking algorithm for semiautomatic segmentation of the volumes of interest in the brain.
Proton MR spectroscopic imaging (1H-MRSI) allows the noninvasive investigation of the spatial distribution of meta-bolic changes in and around brain lesions. Although no tu-mor-specific metabolites can be measured using in vivo MRSI, it is possible, however, to detect specific patterns in changes of metabolite concentrations compared with the normal brain. It is well known that gliomas show increased levels of choline-containing compounds (Cho) and a reduction in the signal intensity of theN-acetylaspartate (NAA).11,12Cho is thought to be a marker for increased membrane turnover or higher cellular attenuation.13NAA is identified as neuronal marker mainly contained within neurons.14
It was the purpose of our study, using quantitative fiber tracking and proton MR spectroscopic imaging with high spa-Received April 5, 2006; accepted after revision May 23.
From the Departments of Neurosurgery (A.S., C.N., M.B., O.G.), Neurology (T.H.), and Neuroradiology (T.E.), University of Erlangen-Nuremberg, Germany; and MR Center of Excellence (S.G., E.M.) and Department of Diagnostic-Radiology (S.G., E.M.), Medical University of Vienna, Austria.
This study was supported by the German Research Society Grants SFB 603, C9, and DFG GA 638/2-1.
tial resolution, to assess changes in fiber integrity, diffusivity, and brain metabolism of the pyramidal tract adjacent to WHO grade II, III, and IV gliomas compared with the contralateral normal-appearing brain. The combination of DT fiber track-ing and MRSI was performed to discriminate between tumor infiltration and peritumoral edema. These conditions change the fiber integrity and diffusivity. The metabolic changes had to be assessed noninvasively by MRSI because it is not possible to obtain biopsies out of the pyramidal tract. We hypothesized that preoperative sensorimotor deficits are associated with im-pairment in fiber bundles of the pyramidal tract adjacent to the tumor. Therefore, an additional objective was to deter-mine differences in the pyramidal tract between patients with and without preoperative sensorimotor deficits.
Materials and Methods
Patients
We examined 20 patients (age range, 24 –72 years; mean age⫾SD, 40.6⫾13.9 years) with untreated supratentorial gliomas of WHO grades II, III, or IV before surgery. Nine patients were female, and 8 patients experienced paresis, paresthesia, and/or hypesthesia before surgery. Information about the type and location of the tumors and the sensorimotor deficits is summarized in Table 1. For this retrospec-tive study, the ethics committee of the University Erlangen-Nurem-berg did not require its approval or informed consent. However, signed informed consent was obtained from all patients for imaging procedures performed.
MR Data Acquisition
MR examinations, including conventional MR imaging, DTI, and 1H-MRSI, were performed on a 1.5T clinical whole-body scanner
(Magnetom Sonata; Siemens, Erlangen, Germany) equipped with the
standard head coil. Conventional MR imaging consisted of 1) an axial turbo spin-echo (TSE) sequence (TR, 5600 – 6490 ms; TE, 98 ms; section thickness, 5 mm), 2) an axial fluid-attenuated inversion re-covery (FLAIR) sequence (TR, 10,000; TE, 103 ms; section thickness, 5 mm), 3) an axial spin-echo (SE) sequence (T1-weighted, TR, 500 ms; TE, 15 ms; matrix size, 256⫻256; FOV, 16⫻16 cm; 20 sections with no gap; section thickness, 2 mm) that was used for integration of spectroscopic data into the planning station of a stereotactic system,15 and 4) pregadolinium and postgadolinium contrast-enhanced 3D magnetization-prepared rapid acquisition of gradient echo (MPRAGE) sequences (TR, 2020; TE 4.38 ms; isotropic matrix, 1 mm; FOV, 250⫻250 mm; 160 sections).
For DTI, a diffusion-weighted echo-planar imaging (EPI) se-quence was used with the following parameters: TR, 9200; TE, 86 ms; matrix size, 128⫻128; FOV, 240⫻240 mm; section thickness, 1.9 mm; bandwidth, 1502 Hz/pixel. Sixty axial sections were measured with no intersectional gap and an isotropic voxel size of 1.9⫻1.9⫻ 1.9 mm3. Diffusion gradient encoding in 6 directions withb⫽1000 s/mm2and an additional measurement without diffusion gradient (b⫽0 s/mm2) were performed. The sequence design was based on balanced diffusion gradients to minimize eddy-current artifacts. For sufficient signal-to-noise ratio (SNR), 5 averages were applied, re-quiring a total DTI data acquisition time of 5 minutes 31 seconds
[image:2.585.53.538.63.332.2]The MRSI examination immediately followed the DTI. The vol-ume of interest (VOI) of the MRSI experiment with point-resolved spectroscopy sequence (PRESS) volume preselection, a so-called PRESS-box, was aligned parallel to those of the axial T2-weighted TSE and T1-weighted SE sections that showed the maximal dimension of the lesion. Furthermore, the PRESS box was positioned to exclude lipids of the skull and subcutaneous fat. MRSI parameters chosen were TR, 1600 ms; TE, 135 ms; 24⫻24 circular phase encoding scheme across a 16⫻16-cm FOV; section thickness, 10 mm; 50% Table 1: Type, grade, and location of the investigated brain tumors and preoperative sensorimotor deficits of the 20 patients
Patient
Age
(Years) Sex Clinical Diagnosis and Lesion Location
Lesion Location Relative to PT
Preoperative Sensorimotor Deficits
1 29 M Oligoastrocytoma III, right frontal Medial Paresthesia, left arm and leg
2 24 M Astrocytoma II, right frontal Lateral None
3 35 F Oligodendroglioma III, left frontal Anterior Paresthesia, right leg
4 29 F Astrocytoma II, right central Anterior None
5 39 F Oligoastrocytoma III, left frontal Anterior Hemiparesis, right
6 29 M Astrocytoma III, right frontal Anterior None
7 64 M GBM IV, right temporoparietal Posterior Hemiparesis,
hemihypesthesia, left
8 29 M Oligoastrocytoma III, left temporal Lateral None
9 37 M Astrocytoma II, right frontotemporal Anterior None
10 30 M Astrocytoma III, right temporal Anterior None
11 53 F Oligoastrocytoma II, left central Anterior None
12 30 M Astrocytoma II, right postcentral Lateral Hypesthesia, left arm and leg
13 42 F Astrocytoma III, left central Medial None
14 29 M Astrocytoma II, left postcentral Lateral Hypesthesia, right arm
15 37 F Oligoastrocytoma III, right frontal Lateral None
16 39 F GBM IV, left frontal Medial None
17 63 M Astrocytoma III, left postcentral Lateral None
18 72 F GBM IV, left frontal Anterior Hemiparesis,
hemihypesthesia, right
19 52 M Oligoastrocytoma III, right frontal Anterior None
20 50 F GBM IV, right temporal Lateral Hemiparesis, left
Note:—M indicates male; F, female; GBM, glioblastoma multiforme; PT, pyramidal tract.
BRAIN
ORIGINAL
Hamming filter; NEX, 2; spectral width, 1000 Hz; acquisition size, 1024 complex points. The total spectroscopic data acquisition time was less than 13 minutes. Immobilization of the patient’s head to minimize artifacts due to patient motion was achieved by fixation in a headrest.
MR Data Analysis
DTI data were transferred to a workstation (Inspiron 8200; Dell Com-puter Co, Round Rock, Tex) for analysis. Data processing was per-formed using DTIStudio (version 2.4; Johns Hopkins University, Bal-timore, Md).16Three eigenvalues (
1,2,3) and 3 eigenvectors, as well as parametric maps of FA and MD, were calculated.17
Fiber tracking was performed by designating ROIs to define areas of the precentral and postcentral gyrus as seed areas (mean ROI area⫾SD⫽1120⫾205 mm2). To serve as target areas, ROIs were placed to encompass the entire posterior limb of the internal capsule (mean ROI area⫾SD⫽216⫾34 mm2). For 3D reconstruction of pyramidal tracts, the fiber assignment by continuous tracking method was used.1,18The tracking procedure was stopped when a track turn-ing angle greater than 60° was encountered. A lower threshold of FA⫽0.15, which was found to be optimal for the appliance of fiber tracking procedures in glioma patients,19was used as the indicator for termination of tract elongation. The tracking procedure was termi-nated at a pixel with an FA value lower than the threshold. Quantita-tive fiber tracking of the reconstructed fibers was performed using the “tract statistics” function of DTIStudio, which enables the statistical evaluation of parameters of voxels occupied by reconstructed fibers. The calculated DTI and fiber parameters for the pyramidal tracts were FA, MD, and mean number of fibers per voxel (FpV), which can be interpreted as a measure for the fiber attenuation of the selected fiber bundle.
MRSI data were evaluated to obtain quantitative results. For the former, we calculated metabolic maps of Cho and NAA using the freely available reconstruction program csx (Linux version), obtained from the homepage of the Kennedy Krieger Institute (Baltimore, Md). The magnitude of spectra was calculated, the position of NAA was set to 2.02 ppm, and a susceptibility correction was applied. The peak areas for Cho and NAA were calculated by integration over fre-quency ranges of 3.34 –3.14 and 2.22–1.82 ppm, respectively. Smooth linear interpolation to a 256⫻256 matrix resulted in the metabolic maps. Cho and NAA images were used to calculate a map of Cho/ NAA ratios. Segmentation of the tumor due to the metabolic changes related to the lesion in the Cho/NAA ratio map was performed by a method described previously.20Coregistration of conventional MR imaging (T2-weighted TSE and 3D MPRAGE), DTI data sets, and MRSI data in the form of a so-called MR imaging/MRSI hybrid data set21was performed at the planning workstation of a navigation sys-tem (VectorVision Sky; Brain LAB, Heimstetten, Germany) using a semiautomated coregistration (VV2 Planning 1.3; BrainLAB, Heim-stetten, Germany).
For metabolite quantification from the MRSI data, we used the spectral fit program LCModel (version 6.1).22The spectra were ana-lyzed as a linear combination of a set of reference basis spectra. For all spectroscopic data, we used the reference basis set for PRESS and TE of 135 ms. Our method for quantification of metabolite concentra-tions is similar to that published previously.23,24Molar metabolite concentrations out of the in vivo MRSI data were calculated on a workstation (Solaris SPARC; Sun Microsystems, Santa Clara, Calif) using a calibrated LCModel program. All spectral fits were performed in an analysis window from 1.8 – 4.0 ppm. Spectra with an SNR⬍2
and a full width at half-maximum⬎0.075 ppm were not included in the statistical analysis. In addition, metabolites with SD⬎20%, as given by LCModel, were not included in the statistical analysis.
Statistical Analysis
Data were analyzed using statistical software (SPSS, version 12; SPSS, Chicago, Ill). For comparisons of results, 2-sided paired and unpaired
ttests were used, with significance indicated byP⬍.05. To correlate the DTI (FA and MD) and fiber (FpV) parameters among themselves and with the 3 MRSI parameters (concentration of NAA and Cho, and Cho/NAA) we determined Pearson correlation coefficients (R) andP
values for the test of significance. Interpretation of the correlation coefficients was made considering the specifications for interpreta-tion of correlainterpreta-tion coefficients given by Zou et al.25
Results
DTI and high spatial resolution MRSI data of suitable quality were obtained from both hemispheres for all patients. Analysis of data, including fiber tracking of the pyramidal tract, seg-mentation of pathologic metabolite changes in the Cho/NAA-ratio image, and coregistCho/NAA-ration of these results, were success-fully performed in all cases. Overviews of the results obtained from the different aspects of data analysis for a patient having no sensorimotor deficits (patient 17 in Table 1) and a patient with hypesthesia in his right arm (patient 14 in Table 1) are presented in Figs 1 and 2, respectively.
Figs 1Band 2Bshow 3D reconstructions of the pyramidal tract on the ipsilateral (blue) and contralateral (magenta) side of the lesions. Figs 1A, -C, and 2A, -Cdemonstrate the coreg-istration of the T2-weighted TSE images and the segmented metabolic maps using software of the neuronavigation system. The profile of the pyramidal tracts (blue and magenta line) and the tumor (yellow orgreen line) are also depicted on these figures. No overlap of the ipsilateral pyramidal tract and the segmented metabolic map is indicated in the patient without sensorimotor deficits (Fig 1B). However, for the patient with hypesthesia of the right arm, the pyramidal tract extends into the segmented metabolic map. Overlapping pyramidal tract and segmented Cho/NAA maps were found in 5 of 8 patients (patients 1, 3, 12, 14, and 18) having sensorimotor deficits but in none of the other group. Spectra fitted by LCModel for a voxel position at the contralateral (voxel 1in Figs 1Cand 2C) and ipsilateral (voxel 2in Figs 1Cand 2C) pyramidal tract are given in Figs 1D, -E, and 2D, -E, respectively. Only in patients 1 and 18 were the ipsilateral pyramidal tracts located in hyper-intense WM, identified on T2-weighted TSE and FLAIR im-ages by a neuroradiologist as peritumoral edema. The pyrami-dal tracts of all other patients were located in the normal-appearing WM.
10⫺3mm2/s. Two-sided pairedttests revealed significant dif-ferences between ipsilateral and contralateral pyramidal tracts for FpV and FA, but not for MD (Fig 3).
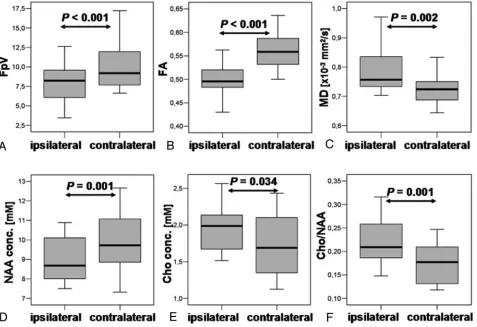
For the DTI and fiber parameters averaged over the 5 DTI sections, which are correlated with the MRSI section (“pyra-midal tract section”), we found, on the ipsilateral side, FpV⫽ 8.0⫾2.4, FA⫽0.50⫾0.04, and MD⫽0.786⫾0.076⫻10⫺3 mm2/s and, for the contralateral side, FpV⫽10.1⫾2.9, FA⫽ 0.56⫾0.04, and MD⫽0.724⫾0.043⫻10⫺3mm2/s. Two-sided pairedttests revealed significant differences between the
ipsilateral and contralateral sections of the pyramidal tracts for FpV, FA, and MD (Fig 4A–C).
Metabolic concentrations for NAA and Cho, and ratios of Cho/NAA were calculated for all voxel positions located in the pyramidal tract and averaged subsequently for the ipsilateral and contralateral fiber structure. To limit partial volume ef-fects at least 75% of a voxels have to be located in the region of interest to be accepted for evaluation. Examples for several ipsilateral and contralateral voxel positions are marked as
small white squaresin Figs 1Cand 2C. Concentrations were
Fig 1.Results of the fiber-tracking procedure of the DTI data and the spectral analysis of the MRSI data for a patient having no sensorimotor deficits (patient 17 in Table 1). Screenshot from the planning workstation of a naviga-tion system of an axial T2-weighted MR imaging (A) coregistered with a segmented metabolic Cho/NAA map (C). Overlaid on these images are the cross sections of the ipsilateral (blue) and contralateral (magenta) pyramidal tracts, the tumor segmented manually by a neurosurgeron (yellow), and the VOI (PRESS-box) of the MRSI experiment (white rectangle).
B, a 3D reconstruction of the ipsilateral (blue) and con-tralateral (magenta) pyramidal tracts depicted on the axial sections of the DTI dataset measured with a b-value⫽0 s/mm2
. LCModel fits (red line) of the MRSI data of voxel position 1 (D) and 2 (E) as depicted inCaswhite squares. Overlaid on these images are the molar concentrations for Cho, Cr, and NAA calculated by LCModel.
Fig 2.Results of the fiber-tracking procedure of the DTI data and the spectral analysis of the MRSI data for a patient with a hypesthesia in right arm (patient 14 in Table 1). Screenshot from the planning workstation of a naviga-tion system of an axial T2-weighted MR imaging (A) coregistred with a segmented metabolic Cho/NAA map (C). Overlaid on these images are the cross sections of the ipsilateral (blue) and contralateral (magenta) pyramidal tracts, the tumor segmented manually by a neurosurgeon (green), and the PRESS-box of the MRSI experiment (white rectangle).
B, a 3D reconstruction of the ipsilateral (blue) and con-tralateral (magenta) pyramidal tracts depicted on the axial sections of the DTI dataset measured with a b-value⫽0 s/mm2
[image:4.585.52.372.38.598.2]averaged and resulted in the following values for the ipsilateral pyramidal tract: NAA⫽8.9⫾1.2 mmol/L, Cho⫽1.9⫾0.3 mmol/L, and Cho/NAA⫽0.22⫾0.05, and for the contralat-eral pyramidal tract: NAA⫽10.0⫾1.4 mmol/L, Cho⫽1.7⫾ 0.4 mmol/L, and Cho/NAA⫽0.17⫾0.04. Two-sided pairedt
tests revealed significant differences between the ipsilateral and contralateral NAA and Cho concentrations as well as Cho/ NAA ratios (Fig 4,D–F).
We found significant differences between patients having
no sensorimotor deficits and patients with a paresis and/or sensory deficits on ipsilateral side for FA and MD (Fig 5) but not for other parameters (FpV, NAA, Cho, and Cho/NAA) and not for the contralateral side.
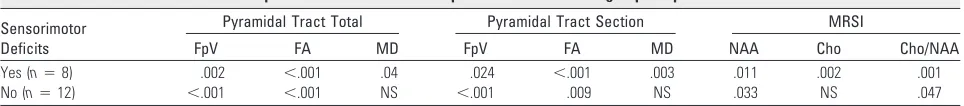
Table 2 shows a summary ofPvalues for 2-sided pairedt
tests between ipsilateral and contralateral DTI and fiber rameters, and metabolic concentrations for subgroups of pa-tients with and without sensorimotor deficits. For both sub-groups, we found significant differences for FpV and FA for
Fig 3.Shown are boxplots of FpV, FA, and MD values of the whole ipsilateral and contralateral pyramidal tracts (A,B, andC, respectively). The horizontal lines are the medians, and the ends of the boxes are the lower and upper quartiles (25th and 75th percentiles). MD values are expressed in units⫻10⫺3mm2/s. The error bars depict the SD. Overlaid are thePvalues calculated from a 2-sided pairedttest (ns⫽not significant).
[image:5.585.56.529.40.192.2] [image:5.585.58.535.241.568.2]the whole pyramidal tract as well as for the section of the py-ramidal tract (5 sections of the DTI dataset) with the shortest distance to the lesion and located at the MRSI section. MD showed significant differences between ipsilateral and con-tralateral pyramidal tract only for the subgroup of patients with sensorimotor deficits. Similar results were found for NAA and Cho/NAA by attest that revealed significant differ-ences between ipsilateral and contralateral voxel positions at the pyramidal tracts for both subgroups. For Cho, we found significant differences only in the subgroup of sensorimotor impaired patients.
Pearson correlation between FA and FpV revealed a strongly positive correlation for the contralateral side in pa-tients with (R⫽0.826,P⫽.001) and without (R⫽0.652,P⫽
.002) sensorimotor deficits, but not for the ipsilateral side. Only on the ipsilateral side, however, did we find a strongly negative correlation between FA and MD for patients with sensorimotor deficits (R⫽ ⫺0.710,P⫽.024) and no associ-ation for patients having no deficits (R⫽0.078, ns). All other correlation analyses were found to be not significant, includ-ing correlations between DTI and fiber parameters and MRSI parameters.
Discussion
DTI and fiber tracking are methods to detect WM fiber tracts according to the anisotropy of water diffusion.1H-MRSI is a noninvasive tool for investigating the spatial distribution of metabolic changes in brain lesions. These MR imaging tech-niques have the potential to overcome a well-known insuffi-ciency of standard MR imaging: the underestimation of im-pairment of WM fiber structures as a result of brain tumors.
Several studies have shown that fiber tracts in the vicinity of brain tumors might be displaced, disrupted, or invaded by the tumor.5-7,26However, all studies used only a qualitative
ap-proach to visually assess changes in the reconstructed fiber bundles. Two recent publications went a step further and used 3D reconstruction of fiber tracts to guide manually the selec-tion of ROIs for quantitative analysis. A study by Schonberg et al9showed that along fiber systems that are displaced and compressed as a result of brain tumors, the diffusivity in-creases parallel and dein-creases perpendicular to the fibers. This leads to an overall increase of FA and to the conclusion that this may reflect the compression of the fiber bundle. Roberts et al8established a so-called fiber attenuation index (FDi) as measure of the number of fiber paths traversing a manually defined ROI to encompass corticospinal and corticopontine fibers. The authors noted that the FDi (as well as the FpV in our study) is not able to assess the real (absolute) number of fibers; rather, it gives a semiquantitative parameter that de-pends on imaging parameters (eg, spatial resolution) and postprocessing (eg, tracking thresholds).
Unlike the FDi, which is calculated from a 2-dimensional ROI, we determined diffusivity (ie, FA and MD) and fiber parameters (ie, FpV) averaged over a 3D VOI (that is, the whole as well as a section of the pyramidal tracts, which were defined using a fiber-tracking algorithm for semiautomatic segmentation of the VOI).
Our FA and MD values for the pyramidal tract section on the contralateral side agree with the data of Cosottini et al27for control subjects (FA⫽0.585 and MD⫽0.697⫻10⫺3mm2/ s). However, FA values reported by 2 other studies for con-tralateral WM in patients ranges from 0.45928to 0.65.8For the ipsilateral side, our MD values correspond with those reported by Provenzale et al28for normal-appearing WM adjacent to hyperintense WM (0.723⫻10⫺3mm2/s), but for FA we found a higher value compared with this study (FA⫽0.375) and with that of Roberts et al8(FA⫽0.40). The differences be-tween the values could be explained by different size of the
Fig 5.Boxplots of FpV, FA, and MD values of the section of the ipsilateral pyramidal tracts corresponding with the MRSI section for subgroups of patients without sensorimotor deficits, “no,” and patients with sensorimotor deficits, “yes” (A,B, andC, respectively). MD values are expressed in units⫻10⫺3
mm2
/s. Overlaid are thePvalues calculated from a 2-sided unpaired
[image:6.585.58.531.44.206.2]ttest (ns⫽not significant).
Table 2:Pvalues forttests between ipsilateral and contralateral parameters and for subgroups of patients
Sensorimotor Deficits
Pyramidal Tract Total Pyramidal Tract Section MRSI
FpV FA MD FpV FA MD NAA Cho Cho/NAA
Yes (n⫽8) .002 ⬍.001 .04 .024 ⬍.001 .003 .011 .002 .001
No (n⫽12) ⬍.001 ⬍.001 NS ⬍.001 .009 NS .033 NS .047
[image:6.585.53.535.265.318.2]VOIs in our study and ROIs in the above-mentioned studies. We found significant differences for FA and MD on the ipsi-lateral side between the subgroups of patients with and with-out sensorimotor deficits. These differences are thought to reflect preoperative deficits. The different ranges of the MD values for the 2 subgroups were unexpected, an explanation for this fact will be provided below.
Between FA and FpV for the section of the pyramidal tract, we obtained a significant correlation only on the contralateral side for all 20 patients. Roberts et al8found a strong positive correlation (R⫽0.81) between FA and FDi for a sample of values consisting of both peritumoral and contralateral WM, but they calculated no correlations for ipsilateral and con-tralateral ROIs separately. Between FA and MD, we found a strong negative correlation on the ipsilateral side for patients with sensorimotor deficits but not for patients without preop-erative sensorimotor deficits. A study by Lu et al29showed a weak correlation (R⫽ ⫺0.44) between FA and MD in
peritu-moral edema of gliomas, defined as a hyperintense area on T2-weighted MR images. Price et al30and Wieshmann et al31 showed that the isotropic component of the diffusion tensor has a limited range and the anisotropic component has a marked range in healthy control subjects. Unfortunately, none of the studies mentioned performed correlation analyses be-tween the components for either the control subjects or the contralateral normal-appearing WM.
In 18 of 20 patients of this study, the ipsilateral pyramidal tract was located outside of the peritumoral edema visible on conventional MR images (ie, in peritumoral normal-appear-ing WM). However, the differences between ipsilateral and contralateral DTI and fiber parameters as well as the correla-tions between FA and FpV, and between FA and MD, respec-tively, indicates an edematous change not detectable by con-ventional T2-weighted MR imaging. Further, correlation between FA and MD for patients with sensorimotor deficits and the differences in the range of MD between the subgroups can be interpreted as a distinct increase of extracellular water. The molar concentrations for Cho and NAA and the values for Cho/NAA ratio on the ipsilateral as well as on the con-tralateral side agree with findings in healthy volunteers from other studies.5,32-35The means and ranges of values calculated from the results of 5 studies also using a phantom replacement technique for quantification are: Cho, 1.7 mmol/L (1.5–1.9 mmol/L), NAA, 9.4 mmol/L (8.0 –10.7 mmol/L), and Cho/ NAA, 0.18 (0.14 – 0.26). However, we found significant differ-ences between ipsilateral and contralateral sides for all 3 met-abolic parameters in all 20 patients, but no significant differences between subgroups. These findings support the re-sults obtained from DTI and fiber tracking. An increase of extracellular water causes a dilution and hence leads to a de-crease of NAA. Also this process results in a higher molecular mobility of the choline-containing compounds and hence to an increase of the T2 relaxation time and, subsequently, an increase in “MR-visible” Cho concentration.36,37
The differences in spatial resolution of the DTI (1.9 mm3 isotropic voxels) and the MRSI (5⫻5⫻10 mm3) is a limita-tion of our study. Hence, partial volume effects occurred for our MRSI findings despite increasing the spatial resolution in MRSI to the limit to obtain spectra with sufficient SNR at 1.5T and in acquisition times acceptable for patients with glioma.
The DTI method used in our study is limited by the fact that we used no parallel imaging technique (spin-echo acquisition and sensitivity encoding or generalized autocalibrating par-tially parallel acquisition), which would allow reduction in susceptibility and motion artifacts. However, because of the reduction in SNR involved with this technique and to obtain MRSI data with higher spatial resolution, it would be neces-sary to go to higher magnetic field strengths (3T or more).38In this study, we used manual placement of the ROI, which is always afflicted with the possibility of anatomic or functional mismatch. Therefore, the possibility exists that other pathways were reconstructed. By our protocol of placing 2 ROIs (in the sensorimotor cortex and in the posterior limb of the internal capsule), which was done by a neuroanatomically experienced neuroradiologist, we tried to keep this uncertainty as low as possible. Another limitation of our study was the relatively small number of patients, especially for the subgroups of pa-tients with sensorimotor deficits (n⫽8).
Conclusion
DTI in combination with quantitative fiber tracking adds to a better characterization of changes of the pyramidal tract adja-cent to brain tumors. We detected significant differences of metabolic changes in these WM structures compared with contralateral normal-appearing WM using 1H-MRSI with high spatial resolution at 1.5T. DTI and1H-MRSI can provide information on changes in WM structures, which are not de-tectable by conventional MR imaging. Quantitative DTI is able to show significant differences in diffusivity of the pyra-midal tract in patients with sensorimotor deficits in relation to patients without them. The additional use of1H-MRSI may be helpful to discern whether these diffusivity changes in fiber tracts are caused by tumor infiltration or peritumoral edema.
References
1. Mori S, Crain BJ, Chacko VP, et al.Three-dimensional tracking of axonal projections in the brain by magnetic resonance imaging. Ann Neurol
1999;45:265– 69
2. Jones DK, Simmons A, Williams SC, et al.Non-invasive assessment of axonal fiber connectivity in the human brain via diffusion tensor MRI.Magn Reson Med1999;42:37– 41
3. Le Bihan D, Mangin JF, Poupon C, et al.Diffusion tensor imaging: concepts and applications.J Magn Reson Imaging2001;13:534 – 46
4. Mori S, Kaufmann WE, Davatzikos C, et al.Imaging cortical association tracts in the human brain using diffusion-tensor-based axonal tracking.Magn Re-son Med2002;47:215–23
5. Nimsky C, Ganslandt O, Hastreiter P, et al.Intraoperative diffusion-tensor MR imaging: shifting of white matter tracts during neurosurgical procedures– initial experience.Radiology2005;234:218 –25
6. Clark CA, Barrick TR, Murphy MM, et al.White matter fiber tracking in pa-tients with space-occupying lesions of the brain: a new technique for neuro-surgical planning?Neuroimage2003;20:1601– 08
7. Yamada K, Kizu O, Mori S, et al.Brain fiber tracking with clinically feasible diffusion-tensor MR imaging: initial experience.Radiology2003;227:295–301 8. Roberts TP, Liu F, Kassner A, et al.Fiber density index correlates with reduced fractional anisotropy in white matter of patients with glioblastoma.AJNR Am J Neuroradiol2005;26:2183– 86
9. Schonberg T, Pianka P, Hendler T, et al.Characterization of displaced white matter by brain tumors using combined DTI and fMRI.Neuroimage2006 10. Berman JI, Mukherjee P, Partridge SC, et al.Quantitative diffusion tensor MRI
fiber tractography of sensorimotor white matter development in premature infants.Neuroimage2005;27:862–71
11. Majos C, Alonso J, Aguilera C, et al.Adult primitive neuroectodermal tumor: proton MR spectroscopic findings with possible application for differential diagnosis.Radiology2002;225:556 – 66
12. Negendank WG, Sauter R, Brown TR, et al.Proton magnetic resonance spec-troscopy in patients with glial tumors: a multicenter study.J Neurosurg
13. Michaelis T, Merboldt KD, Bruhn H, et al.Absolute concentrations of metab-olites in the adult human brain in vivo: quantification of localized proton MR spectra.Radiology1993;187:219 –27
14. Urenjak J, Williams SR, Gadian DG, et al.Proton nuclear magnetic resonance spectroscopy unambiguously identifies different neural cell types.J Neurosci
1993;13:981– 89
15. Horska A, Calhoun VD, Bradshaw DH, et al.Rapid method for correction of CSF partial volume in quantitative proton MR spectroscopic imaging.Magn Reson Med2002;48:555–58
16. Jiang H, van Zijl PC, Kim J, et al.DtiStudio: resource program for diffusion tensor computation and fiber bundle tracking.Comput Methods Programs Biomed2006;81:106 –16
17. Pierpaoli C, Basser PJ.Toward a quantitative assessment of diffusion anisot-ropy.Magn Reson Med1996;36:893–906
18. Xue R, van Zijl PC, Crain BJ, et al.In vivo three-dimensional reconstruction of rat brain axonal projections by diffusion tensor imaging.Magn Reson Med
1999;42:1123–27
19. Stadlbauer A, Gruber S, Nimsky C, et al.Gliomas: histopathologic evaluation of changes in directionality and magnitude of water diffusion at diffusion-tensor MR imaging.Radiology2006;240:803–10
20. Stadlbauer A, Moser E, Gruber S, et al.Improved delineation of brain tumors: an automated method for segmentation based on pathologic changes of 1H-MRSI metabolites in gliomas.Neuroimage2004;23:454 – 61
21. Stadlbauer A, Moser E, Gruber S, et al.Integration of biochemical images of a tumor into frameless stereotaxy achieved using a magnetic resonance imag-ing/magnetic resonance spectroscopy hybrid data set. J Neurosurg
2004;101:287–94
22. Provencher SW.Estimation of metabolite concentrations from localized in vivo proton NMR spectra.Magn Reson Med1993;30:672–79
23. Stadlbauer A, Gruber S, Nimsky C, et al.Preoperative grading of gliomas by using metabolite quantification with high-spatial-resolution proton MR spectroscopic imaging.Radiology2006;238:958 – 69
24. McLean MA, Woermann FG, Barker GJ, et al.Quantitative analysis of short echo time (1)H-MRSI of cerebral gray and white matter.Magn Reson Med
2000;44:401–11
25. Zou KH, Tuncali K, Silverman SG.Correlation and simple linear regression.
Radiology2003;227:617–22
26. Mori S, Frederiksen K, van Zijl PC, et al.Brain white matter anatomy of tumor patients evaluated with diffusion tensor imaging.Ann Neurol2002;51:377– 80 27. Cosottini M, Giannelli M, Siciliano G, et al.Diffusion-tensor MR imaging of corticospinal tract in amyotrophic lateral sclerosis and progressive muscular atrophy.Radiology2005;237:258 – 64
28. Provenzale JM, McGraw P, Mhatre P, et al.Peritumoral brain regions in glio-mas and meningioglio-mas: investigation with isotropic diffusion-weighted MR imaging and diffusion-tensor MR imaging.Radiology2004;232:451– 60 29. Lu S, Ahn D, Johnson G, et al.Diffusion-tensor MR imaging of intracranial
neoplasia and associated peritumoral edema: introduction of the tumor infil-tration index.Radiology2004;232:221–28
30. Price SJ, Pena A, Burnet NG, et al.Tissue signature characterisation of diffu-sion tensor abnormalities in cerebral gliomas.Eur Radiol2004;14:1909 –17 31. Wieshmann UC, Clark CA, Symms MR, et al.Reduced anisotropy of water
diffusion in structural cerebral abnormalities demonstrated with diffusion tensor imaging.Magn Reson Imaging1999;17:1269 –74
32. Soher BJ, Hurd RE, Sailasuta N, et al.Quantitation of automated single-voxel proton MRS using cerebral water as an internal reference.Magn Reson Med
1996;36:335–39
33. Keevil SF, Barbiroli B, Brooks JC, et al.Absolute metabolite quantification by in vivo NMR spectroscopy: II. A multicentre trial of protocols for in vivo lo-calised proton studies of human brain.Magn Reson Imaging1998;16:1093–106 34. Pouwels PJ, Brockmann K, Kruse B, et al.Regional age dependence of human brain metabolites from infancy to adulthood as detected by quantitative lo-calized proton MRS.Pediatr Res1999;46:474 – 85
35. Helms G.A precise and user-independent quantification technique for re-gional comparison of single volume proton MR spectroscopy of the human brain.NMR Biomed2000;13:398 – 406
36. Kamada K, Houkin K, Hida K, et al.Localized proton spectroscopy of focal brain pathology in humans: significant effects of edema on spin-spin relax-ation time.Magn Reson Med1994;31:537– 40
37. Kamada K, Houkin K, Iwasaki Y, et al.In vivo proton magnetic resonance spectroscopy for metabolic changes of human brain edema.Neurol Med Chir (Tokyo) 1994;34:676 – 81