www.impactjournals.com/oncotarget/ Oncotarget, Vol. 7, No. 21
CDX2 increases SLC7A7 expression and proliferation of pig
intestinal epithelial cells
Xiang-guang Li1, Gao-feng Xu1, Zhen-ya Zhai1, Chun-qi Gao1, Hui-chao Yan1, Qian-yun Xi1, Wu-tai Guan1, Song-bo Wang1, Xiu-qi Wang1
1College of Animal Science, South China Agricultural University/National Engineering Research Center for Breeding Swine
Industry, Guangzhou 510642, China
Correspondence to: Xiu-qi Wang, email: [email protected]
Keywords:CDX2, cell proliferation, intestinal epithelial cells, solute carrier family 7 member 7, pig Received: January 11, 2016 Accepted: March 31, 2016 Published: April 21, 2016
ABSTRACT
Nutrient absorption mediated by nutrient transporters expressed in the intestinal epithelium supplies substrates to support intestinal processes, including epithelial cell proliferation. We evaluated the role of Caudal type homeobox 2 (CDX2), an intestine-specific transcription factor, in the proliferation of pig intestinal epithelial cells (IPEC-1) and searched for novel intestinal nutrient transporter genes activated by CDX2. Our cloned pig CDX2 cDNA contains a “homeobox” DNA binding motif, suggesting it is a transcriptional activator. CDX2 overexpression in IPEC-1 cells increased cell proliferation, the percentage of cells in S/G2 phase, and the abundance of transcripts of the cell cycle-related genes Cyclin A2; Cyclin B; Cyclin D2; proliferating cell nuclear antigen; and cell cycle cyclin-dependent kinases 1, 2 and 4, as well as the predicted CDX2 target genes SLC1A1, SLC5A1 and SLC7A7. In addition, luciferase reporter and chromatin immunoprecipitation assays revealed that CDX2 binds directly to the SLC7A7 promoter. This is the first report of CDX2 function in pig intestinal epithelial cells and identifies SLC7A7 as a novel CDX2 target gene. Our findings show that nutrient transporters are activated during CDX2-induced proliferation of normal intestinal epithelial cells.
INTRODUCTION
CDX2 is a caudal-related homeobox gene coding for a homeodomain transcription factor [1]. Intestine-specific CDX2 is a critical regulator of gut development and homeostasis [2], containing a conserved homeotic DNA-binding site [3]. Simmini et al. [4] showed that inactivation of CDX2 in intestinal stem cells re-specifies their identity and fate towards gastric stem cells. CDX2
conditional knock-out mice fail to form mature endoderm in the intestinal epithelium, and intestinal stem cells lacking CDX2 cannot differentiate into normal intestinal lineages in cultured crypts [5].
CDX2 is crucial to cell processes of the intestinal epithelium, including nutrient absorption, proliferation, adhesion, migration, apoptosis, and tumorigenesis, which are induced by transcriptional activation of relevant target genes [1, 2]. A study by Hinoi et al. [6] indicated CDX2 may control intestinal cell fate determination by activating
transcription of liver intestine-cadherin. Moreover, CDX2 directly activates the cell adhesion genes Claudin-1 [7] and Claudin-2 [8]. CDX2 appears to stimulate intestinal epithelial cell differentiation by activating transcription of intestine-specific genes, such as sucrase-isomaltase and lactase phlorizin hydrolase, both of which are markers of the intestinal absorptive cells, and Mucin 2, a goblet cell marker involved in the formation of the mucosal barrier [2, 9].
CDX2 is a biomarker for gastrointestinal cancer [10], but little research has focused on its role in normal cells. Pigs are true omnivores and have intestinal physiologic processes, enteric microbiota composition, and disease pathogenicity similar to humans, such that there is a natural correlation between pig and human intestines [11]. No data are available concerning the role of CDX2 in pigs, and the complete coding sequence (CDS) sequence of pig CDX2
epithelial cell proliferation, and look for novel intestinal nutrient transporter genes targeted by CDX2.
RESULTS
Cloning of pig CDX2
Based on the conserved sequences of human and mouse CDX2, two overlapping fragments of 972 bp and 786 bp were cloned (Figure 1A), yielding an 803 bp 3′-end sequence (Figure 1B). By aligning and splicing these sequences, we produced a 1934 bp pig CDX2 cDNA (GenBank accession no. GU017420) with a complete open reading frame (ORF) containing a 974 bp 3′ UTR and a 981 bp ORF. The homology of the pig CDX2 CDS with the human sequence was found to be 91.5%, while the protein homology was 96.17% (Figure 2). Bioinformatics performed using DNASTAR (www.dnastar.com) showed that pig CDX2 possesses a 61 amino acid “homeobox” DNA binding motif with a helix-turn-helix secondary structure, suggesting it is a transcriptional regulator of “downstream” genes. The CDX2 overexpression vector was verified by RT-PCR with an M13 primer (Figure 1C) and identified through enzyme digest (Figure 1D).
CDX2 overexpression increases the proliferation of IPEC-1 cells
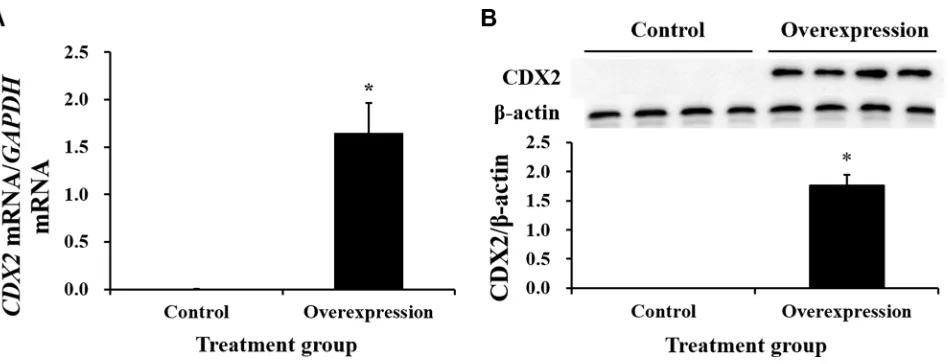
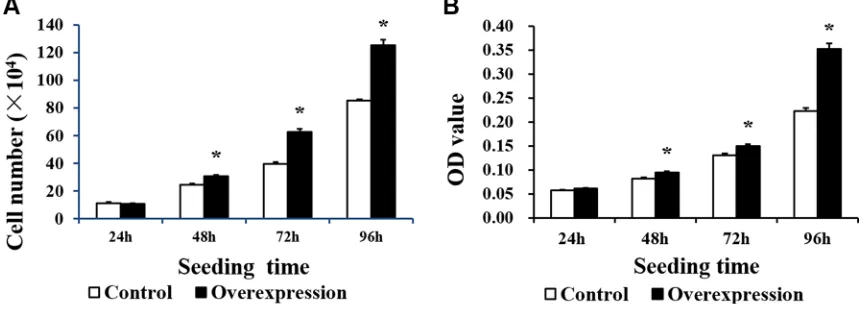
Neither CDX2 mRNA nor protein were detected in control cells (Figure 3). Both were highly increased in CDX2-pcDNA3.1-transfected cells. Cell count and MTT assays on pig intestinal epithelial cell line (IPEC-1) showed that CDX2 overexpression increased cell numbers (Figure 4A) and OD values (Figure 4B) (P < 0.05).
CDX2 overexpression regulates cell cycle distribution of IPEC-1 cells
To further investigate the proliferation differences induced by CDX2 overexpression, cell cycle analysis was conducted via flow cytometry (Figure 5). 48 h after seeding, the percentage of CDX2 overexpressing cells in G1 phase was lower (P < 0.05) and the percentage in G2 phase was higher (P < 0.05) relative to the control group. 72 h after seeding, the percentage of CDX2 overexpressing cells in G2 phase was higher (P < 0.05) than in the control group. Moreover, the percentage of cells in the S/G2 phases was higher (P < 0.05) in the overexpression group than in the control group at 48 and 72 h after seeding.
Increased mRNA abundance of cell cycle related genes and CDX2 target genes
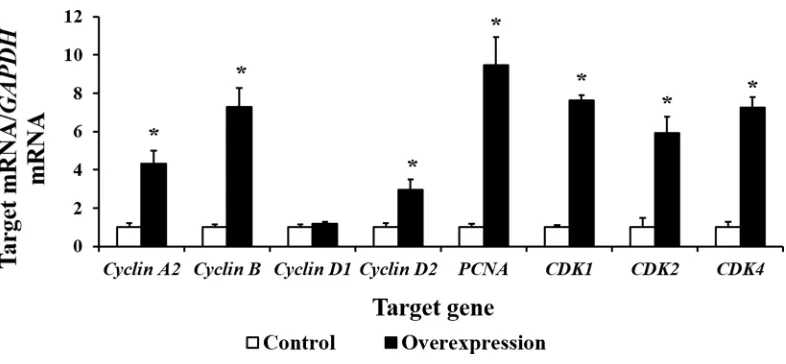
Our results show that CDX2 overexpression increased the mRNA levels of Cyclin A2, Cyclin B,
Cyclin D2, proliferating cell nuclear antigen (PCNA), cell cycle cyclin-dependent kinase 1 (CDK1), CDK2, and CDK4 (P < 0.05) (Figure 6). The results of the bioinformatics analysis using the WWW Promoter Scan, MatInspector, and ALGGEN-PROMO indicate that the intestinal nutrient transporter genes SLC1A1,
SLC3A2, SLC5A1, SLC7A1, and SLC7A7 are candidate target genes of CDX2. Real-time PCR showed that the mRNA abundance of SLC1A1, SLC5A1, and SLC7A7
[image:2.612.63.551.482.673.2]was higher in the overexpression group (P < 0.05) than in the controls (Figure 7). SLC7A7 mRNA was increased approximately 27-fold, the largest change among the candidate target genes.
Figure 2: Comparison of the human and pig CDX2 protein sequences. The pig CDX2 protein was predicted from the cloned nucleotide sequence using DNASTAR (www.dnastar.com), and the comparison was conducted using the same software. *indicates the same amino acid residue.
CDX2 overexpression increases the activity of the SLC7A7 promoter
To investigate whether CDX2 activates the SLC7A7
promoter, the −1899/+22 luciferase reporter construct was transiently transfected into the control and overexpression cells. The primers and identification of the five reporter constructs are shown in Table 3 and Figure 8A, respectively. Figure 8B shows the luciferase reporter activities of the different promoter deletion constructs in the control and overexpression cells. CDX2 transfection increased transcription from the SLC7A7 promoter. The deletion constructs pGL3-P2, pGL3-P4, and pGL3-P5 reduced luciferase activities, suggesting CDX2 binds to the cis-regulatory elements in the −1877/+22 and −1713/+22 regions of the SLC7A7 promoter.
CDX2 binds the SLC7A7 promoter directly
To test whether CDX2 activates the SLC7A7
promoter through direct binding, we performed a ChIP-PCR analysis using a micrococcal nuclease digestion of the CDX2 overexpressing IPEC-1 cells. The promoter regions −1877/+22 and −1713/+22 of SLC7A7 were enriched in anti-CDX2 but not in control immunoglobulin (IgG) immunoprecipitates (Figure 9), suggesting CDX2 binds the ChIP fragment region of the SLC7A7 promoter.
DISCUSSION
CDX2 regulates intestinal cell proliferation [12] by binding specific promoter sites and transcriptionally regulating target genes, including SLC7A7. In the present study, we cloned the complete ORF of pig CDX2 and determined that it codes for a 61 amino acid “homeobox” DNA binding motif indicating that pig CDX2 is a transcriptional regulator, consistent its role in human
and mouse intestines [13]. We proposed that it activates genes that increase normal pig intestinal epithelial cell proliferation.
The regulative roles of CDX2 in cell proliferation are variable. Collectively, CDX2 inhibits the proliferation of cancer cells, including HT-29 colon carcinoma cells [14], Caco2 cells [15], and BGC823 gastric cancer cells [16]. Its regulative role is controversial in IEC-6 cells. Suh et al. [17] reported that the conditional expression of CDX2 in IEC-6 cells inhibits cell proliferation; however, other study shows that the conditional expression of CDX2 in IEC-6 cells increases cell proliferation [18]. In the present study, CDX2 overexpression increased IPEC-1 cell proliferation and led to a greater percentage of cells in the G2 and S/G2 phases. Moreover, the mRNA abundance of PCNA; the cell cycle promoters Cyclin A2,
Cyclin B, and Cyclin D2; and CDK1, CDK2, and CDK4
were increased following CDX2 overexpression. These results collectively demonstrate that CDX2 promotes proliferation in pig intestinal epithelial cells.
Nutrient absorption, mediated by nutrient transporters, supports the growth of intestinal epithelial cells. Our previous studies have shown that the gene expression of SLC1A1, SLC7A9, and SLC15A1 in chicks [19, 20] and SLC7A9, SLC1A1, SLC43A2, SLC15A1,
SLC9A2, SLC9A3, and SLC7A6 in pigeons positively correlates with the growth of embryonic intestines [21, 22]. In addition, the inhibition of SLC1A1 decreased the proliferative activity of the IPEC-1 cells, as expected [23]. We used bioinformatics analysis tools to predict candidate CDX2 target genes from among the nutrient transporters located in the pig intestinal epithelium. CDX2 binding sites were identified in the promoters of pig
SLC1A1, SLC3A2, SLC5A1, SLC7A1, and SLC7A7. The gene expression levels of SLC1A1, SLC5A1, and SLC7A7
[image:4.612.91.523.507.662.2]were increased by CDX2 overexpression; SLC7A7 was increased approximately 27-fold. SLC7A7 is a member of
Figure 5: The cell cycle distribution of IPEC-1 is altered by CDX2 overexpression. At 48 or 72 h after seeding, control and overexpression cells (104 cells per sample) were collected to determine the cell cycle distribution using flow cytometry. (A) and (B) show the cell cycle distribution at 48 and 72 h after seeding, respectively. The results were confirmed by three independent experiments with 5 samples per treatment. The results shown are representative of three independent experiments. The bars are the means ± SE, *indicates a significant difference (P < 0.05).
System y+L, which was originally identified as a transport
system that transports both neutral and basic amino acids in the erythrocyte plasma membrane [24]. When SLC7A7 mediates a heteroexchange, the influx of substrate amino acids is accompanied by the efflux of basic amino acids [25]. Enhancement of SLC7A7 expression may contribute to the improvement of intestinal morphology and absorptive function [26, 27].
Using reporter assays, we found that CDX2 increased SLC7A7 promoter activity in IPEC-1 cells. Deletion analysis revealed that the CDX2 responsive regions were located between bases −1877 to −1763 and −1713 to −1644 relative to the transcription start site. The results of a previous study showed that CDX2
overexpression in the colon cancer cell line SW480 improved the Claudin-1 gene promoter activity by 6-fold but only prompted a 4-fold increase in HCT116 cells [7]. CDX2 binds the promoter region of SLC5A8 and increases its expression in cultured cells and in colonic epithelium. Thus, CDX2 may increase the uptake of SLC5A8 transporter substances in the colon [28]. In this study, after CDX2 was transfected into IPEC-1 cells, the SLC7A7 gene promoter activity increased 2-fold. Like IEC-6 [17] and HIEC cells [29], wild-type IPEC-1 cells do not express CDX2. ChIP assays showed that CDX2 binds directly to SLC7A7 at −1877/+22 and −1713/+22. Currently, the regulation of gut health and nutrient utilization in pigs is believed to depend mainly on exogenous additives, such
[image:5.612.111.504.469.651.2]Figure 7: The mRNA abundance (n = 6) of several candidate target genes of CDX2 is increased by CDX2 overexpression. At 72 h after seeding, control and overexpression cells were collected to determine the mRNA abundance of the nutrient transporter genes. SLC1A1 = solute carrier (SLC) family 1 member 1; SLC3A2 = SLC family 3 member 2; SLC5A1 = SLC family 5 member 1; SLC7A1 = SLC family 7 member 1; SLC7A7 = SLC family 7 member 7. The results were confirmed by three independent experiments with 6 samples per treatment. Representative results of three independent experiments are shown. Bars represent the means ± SE, *indicates a significant difference (P < 0.05).
Figure 8: The promoter activity of the SLC7A7 deletion constructs in IPEC-1 cells transfected with empty vector or
[image:6.612.64.551.425.657.2]as amino acids [30, 31], fatty acids [32], and probiotics [33]. The results of the current study provide additional information on the regulation of nutrient transporter genes in intestinal epithelial cells.
In conclusion, we are the first group to clone a pig
CDX2 cDNA containing its full-length ORF sequence. CDX2 overexpression increases the cell proliferative activity and gene expression of several nutrient transporters in the pig intestinal epithelium. Moreover, we report for the first time that CDX2 binds directly to the promoter region of SLC7A7, and increases gene transcription. According to currently available data, nutrient transporters, particularly SLC7A7, are involved in the CDX2-mediated improvement of cell proliferation. However, additional studies will be valuable in confirming this result.
MATERIALS AND METHODS
Intestinal tissue sample preparation
Three male and 3 female 5-d-old Landrace piglets were euthanized with sodium pentobarbital following the guidelines of the Animal Care Committee of South China Agricultural University (Guangzhou, China). The duodena, jejuna, and ilea were rapidly removed, washed with ice-cold phosphate buffered saline (PBS), and frozen in liquid nitrogen.
RNA extraction and first-strand cDNA synthesis
[image:7.612.91.520.261.640.2]Total RNA was isolated from the duodenum, jejunum, and ileum mixture of the piglets or IPEC-1
cells using TRIzol Reagent (Invitrogen, Carlsbad, CA, USA). The concentration and purity of the RNA sample was determined by measuring the optical density using a NanoDrop 2000 UV-Vis spectrophotometer (Thermo, Wilmington, MA, USA). The integrity of the RNA was assessed with 1.5% agarose gel electrophoresis. The cDNA was synthesized from 2 μg of DNA-free RNA using N10 primers (Sangon, Shanghai, China) and Moloney murine leukemia virus reverse transcriptase (Invitrogen, Carlsbad, CA, USA), according to the manufacturer’s instructions. The synthesized cDNA was stored at −20°C for further processing.
Cloning the full-length cDNA of pig CDX2
Primers were designed using Primer Premier 5.0 (Premier Biosoft, Palo Alto, CA, USA). Two pairs of nested gene-specific primers (CDX2-A, CDX2-A-in; Table 1) and one primer pair (CDX2-B) were first designed based on the human (NM_001265.4) and mouse (NM_023963.1) conserved sequences. After comparison with the human sequence, a contig was made of the two fragments. Then, the 3′ gene-specific primer (Table 1) was designed to extend the cDNA end with a SMART RACE cDNA Amplification Kit (Clontech, Palo Alto, CA, USA) based on the contig sequence. The amplification reaction for the GC-rich region of the full-length cDNA was performed with EX-Taq Polymerase (TaKaRa, Shiga, Japan) in the presence of GC-buffer 1 (TaKaRa, Shiga, Japan). After aligning, the 3′ sequence and the previous contig sequence were assembled to the full-length CDX2 cDNA sequence. The open reading frame (ORF) was later cloned to verify the results.
Construction of the CDX2-pcDNA3.1 plasmids
The CDS of CDX2 was amplified with primers (Table 1), which contained EcoRI and BamHI enzyme digest sites. The purified PCR product was cloned into the EcoRI/BamHI site of the pcDNA3.1+ vector. The resulting plasmid CDX2-pcDNA3.1 was transferred into DH5α and cultured in a LA medium plate for 14–16 h at 37°C. Several colonies were chosen to expand the culture and extract their plasmids for PCR, enzyme digestion, and subsequent sequencing identification. The purification of the PCR product and plasmid was performed using the TIANgel Midi Purification Kit (Tiangen, Beijing, China) and EndoFree Maxi Plasmid Kit (Tiangen, Beijing, China), respectively, according to the manufacturer’s protocol.
Cell culture and the construction of stable cell strains
IPEC-1 cells were obtained from Texas A&M University [34] and maintained in growth medium [Dulbecco’s modified Eagle’s medium (DMEM) supplemented with 5% fetal bovine serum (FBS),
epidermal growth factor (EGF, 5 μg/L), insulin (5 µg/ mL), transferrin (5 µg/mL), selenium (5 ng/mL), penicillin (50 µg/mL) and streptomycin (4 µg/mL)] at 37°C in a 5% CO2 incubator (Shellab, Cornelius, OR, USA). DMEM, FBS, EGF, and penicillin/streptomycin were obtained from Gibco (Carlsbad, CA, USA). Insulin, transferrin, and selenium were purchased from ScienCell (Carlsbad, CA, USA). IPEC-1 cells were seeded onto 6-well plates (#3516, Corning, NY, USA) at a density of 1 × 10⁶ cells/ well and transfected with the basic-pcDNA3.1 or CDX2-pcDNA3.1 plasmid using Lipofectamine 2000 (Invitrogen, CA, USA) on the following day, according to the manufacturer’s recommendations. 6 h after transfection, the cells were detached with 0.25% trypsin (Sigma, St Louis, MO, USA) and reseeded onto 6-well plates at a ratio of 1:10. G418 was then added to the medium at a final concentration of 400 µg/mL. After 7 d, the G418 concentration was decreased to 200 µg/mL. At this point, the cells of non-transfected group had all died. Fourteen days later, the surviving clones were selected, and CDX2 mRNA and protein expression was analyzed to confirm the positive clones. In the following experiments, the IPEC-1 cells transfected with basic-pcDNA3.1 and CDX2-pcDNA3.1 were named the control group and the overexpression group, respectively.
Cell proliferation analysis
To assess cell proliferation, cell count and MTT assays were completed as previously described [35, 36].
Cell count assay
Control and overexpression cells were cultured in 6-well plates (#3516, Corning, NY, USA) at a density of 6 × 10⁴ cells/mL in growth medium and counted using trypan blue. Briefly, cells were detached with 0.25% trypsin (Sigma, St Louis, MO, USA) for 3–5 min at 37°C after washing twice with PBS and then blocked with an equal volume of growth medium. The number of viable cells was determined using a hemocytometer under an Inversion Microscope System (Nikon, Japan) at 24, 48, 72, and 96 h after seeding. The results were confirmed by three independent experiments with three samples per treatment. Representative results of the three independent experiments are shown.
The MTT assay
Control and overexpression cells were cultured in 96-well plates (#3599, Corning, NY, USA) at a density of 5×10³ cells/ mL in growth medium. 20 µl of
MTT solution was carefully removed. Then, 150 mL of dimethylsulfoxide (DMSO) was added to each well. After a 10-min incubation at room temperature, the OD value was evaluated on a microplate reader at a wavelength of 490 nm. The results were confirmed by three independent experiments with 20 samples per treatment.
Cell cycle distribution analysis
In order to determine the effects of CDX2 overexpression on the cell cycle distribution, the control and overexpression cells cultured in the 6-well plates were collected at 48 or 72 h after seeding. Flow cytometry was performed as previously described [37]. Briefly, the cells were washed twice with ice cold PBS and fixed with 70% ice-cold ethanol overnight at −20°C until further processing. The cells were centrifuged at 1500 × g for 5 min at 4°C and were subsequently re-suspended in 1 mL PBS. They were then treated with 100 μL of 200 mg/mL DNase-free RNaseA and incubated at 37°C for 30 min. Finally, the cells were treated with 100 μL of 1 mg/mL propidium iodide (PI) and incubated at room temperature (25°C) for 10 min. Then, 104 cells per sample were subjected to flow cytometry using a Becton Dickinson FACScan (BD Biosciences, Franklin Lake, NJ, USA) at 500 mW. The results were confirmed by three independent experiments with 5 samples per treatment. Representative results of the three independent experiments are shown.
Real-time polymerase chain reaction (real-time PCR)
The control and overexpression cells were cultured in 6-well plates (#3516, Corning, NY, USA) at a density of 6 × 10⁴ cells/mL in growth medium. At 72 h after seeding, the cells were collected for real-time PCR analysis, which was performed on a StratageneMxPro 3005P thermocycler (Agilent Technologies, Santa Clara, CA, USA) using the SYBR Green Real-Time PCR Master Mix (TOYOBO, Tokyo, Japan). The gene-specific primers used for real-time PCR are detailed Table 2. The results were confirmed by three independent experiments with three samples per treatment. Representative results of the three independent experiments are shown.
Western blot
[image:9.612.58.566.69.284.2]The control and overexpression cells were cultured in 6-well plates (#3516, Corning, NY, USA) at a density of 6 × 10⁴ cells/mL in growth medium. At 72 h after seeding, the cells were collected for Western blot analysis. The cells were homogenized in a buffer containing 50 mmol/L tris-HCl (pH 7.5), 150 mmol/L NaCl, 1 mmol/L phenyl-methylsulfonyl fluoride (PMSF) and 3 mmol/L ethylene diamine tetraacetic acid (EDTA) at 4°C. The homogenates were then centrifuged at 12000 × g for 15 min to obtain the supernatant proteins. The protein concentration was determined using a BCA Protein Assay
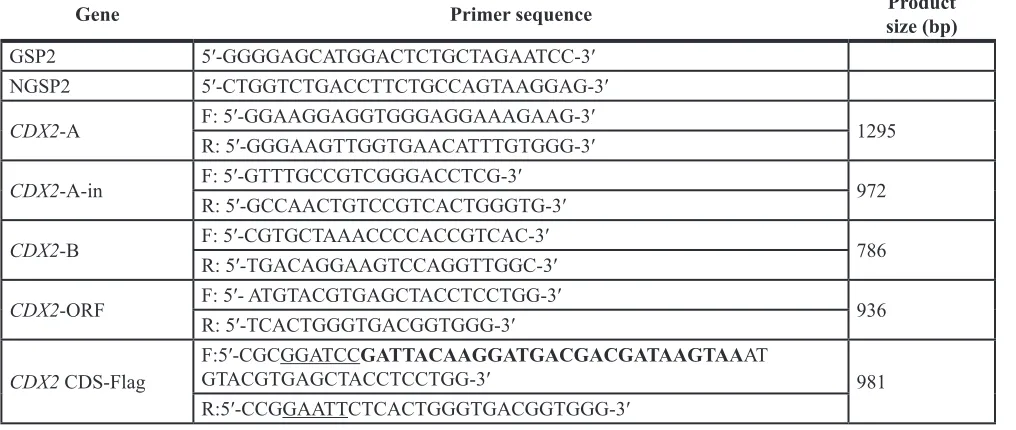
Table 1: Primers used for cloning the CDS of
CDX2
Gene Primer sequence size (bp)Product
GSP2 5′-GGGGAGCATGGACTCTGCTAGAATCC-3′
NGSP2 5′-CTGGTCTGACCTTCTGCCAGTAAGGAG-3′
CDX2-A F: 5′-GGAAGGAGGTGGGAGGAAAGAAG-3′ 1295
R: 5′-GGGAAGTTGGTGAACATTTGTGGG-3′
CDX2-A-in F: 5′-GTTTGCCGTCGGGACCTCG-3′ 972
R: 5′-GCCAACTGTCCGTCACTGGGTG-3′
CDX2-B F: 5′-CGTGCTAAACCCCACCGTCAC-3′ 786
R: 5′-TGACAGGAAGTCCAGGTTGGC-3′
CDX2-ORF F: 5′- ATGTACGTGAGCTACCTCCTGG-3′ 936
R: 5′-TCACTGGGTGACGGTGGG-3′
CDX2 CDS-Flag
F:5′-CGCGGATCCGATTACAAGGATGACGACGATAAGTAAAT
GTACGTGAGCTACCTCCTGG-3′ 981
R:5′-CCGGAATTCTCACTGGGTGACGGTGGG-3′
Reagent Kit (Pierce, Rockford, IL, USA). After boiling for 5 min, the samples (20 μg each) were subjected to 10% SDS-polyacrylamide gel electrophoresis (PAGE) at 80 V for 20 min and 110 V for 70 min using Tris-glycine
[image:10.612.60.560.64.607.2]running buffer. The separated proteins were transferred onto polyvinylidene difluoride (PVDF) membranes by electroblotting in a transfer buffer (25 mmol/L Tris base, 192 mmol/L glycine, and 10% methanol, pH 8.3). The
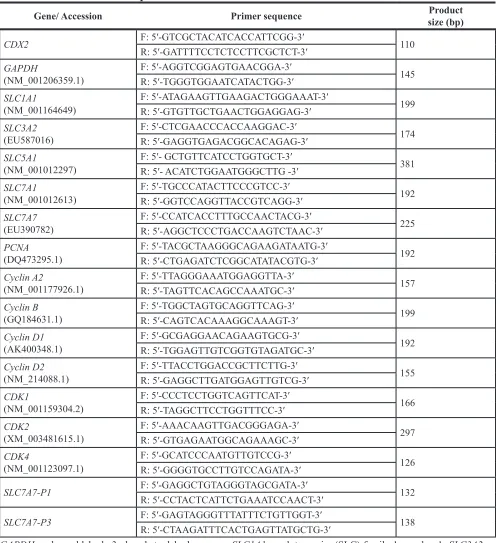
Table 2: Primers used for quantitative real-time PCR
Gene/ Accession Primer sequence size (bp)Product
CDX2 F: 5′-GTCGCTACATCACCATTCGG-3′ 110
R: 5′-GATTTTCCTCTCCTTCGCTCT-3′
GAPDH
(NM_001206359.1) F: 5′-AGGTCGGAGTGAACGGA-3′R: 5′-TGGGTGGAATCATACTGG-3′ 145
SLC1A1
(NM_001164649) F: 5′-ATAGAAGTTGAAGACTGGGAAAT-3′R: 5′-GTGTTGCTGAACTGGAGGAG-3′ 199
SLC3A2
(EU587016) F: 5′-CTCGAACCCACCAAGGAC-3′R: 5′-GAGGTGAGACGGCACAGAG-3′ 174
SLC5A1
(NM_001012297)
F: 5′- GCTGTTCATCCTGGTGCT-3′
381 R: 5′- ACATCTGGAATGGGCTTG -3′
SLC7A1
(NM_001012613) F: 5′-TGCCCATACTTCCCGTCC-3′R: 5′-GGTCCAGGTTACCGTCAGG-3′ 192
SLC7A7
(EU390782) F: 5′-CCATCACCTTTGCCAACTACG-3′R: 5′-AGGCTCCCTGACCAAGTCTAAC-3′ 225
PCNA
(DQ473295.1) F: 5′-TACGCTAAGGGCAGAAGATAATG-3′R: 5′-CTGAGATCTCGGCATATACGTG-3′ 192
Cyclin A2
(NM_001177926.1) F: 5′-TTAGGGAAATGGAGGTTA-3′R: 5′-TAGTTCACAGCCAAATGC-3′ 157
Cyclin B
(GQ184631.1)
F: 5′-TGGCTAGTGCAGGTTCAG-3′
199 R: 5′-CAGTCACAAAGGCAAAGT-3′
Cyclin D1
(AK400348.1) F: 5′-GCGAGGAACAGAAGTGCG-3′R: 5′-TGGAGTTGTCGGTGTAGATGC-3′ 192
Cyclin D2
(NM_214088.1) F: 5′-TTACCTGGACCGCTTCTTG-3′R: 5′-GAGGCTTGATGGAGTTGTCG-3′ 155
CDK1
(NM_001159304.2) F: 5′-CCCTCCTGGTCAGTTCAT-3′R: 5′-TAGGCTTCCTGGTTTCC-3′ 166
CDK2
(XM_003481615.1) F: 5′-AAACAAGTTGACGGGAGA-3′R: 5′-GTGAGAATGGCAGAAAGC-3′ 297
CDK4
(NM_001123097.1)
F: 5′-GCATCCCAATGTTGTCCG-3′
126 R: 5′-GGGGTGCCTTGTCCAGATA-3′
SLC7A7-P1 F: 5′-GAGGCTGTAGGGTAGCGATA-3′ 132
R: 5′-CCTACTCATTCTGAAATCCAACT-3′
SLC7A7-P3 F: 5′-GAGTAGGGTTTATTTCTGTTGGT-3′ 138
R: 5′-CTAAGATTTCACTGAGTTATGCTG-3′
GAPDH = glyceraldehyde-3-phosphate dehydrogenase; SLC1A1 = solute carrier (SLC) family 1 member 1; SLC3A2 = SLC family 3 member 2; SLC5A1 = SLC family 5 member 1; SLC7A1 = SLC family 7 member 1; SLC7A7 = SLC family 7 member 7; PCNA = proliferating cell nuclear antigen; CDK = cell cycle cyclin-dependent kinase; SLC7A7-P1 = SLC7A7
membranes were blocked in 5% BSA in TBST buffer (20 mmol/L Tris, 500 mmol/L NaCl, 0.05% Tween-20, pH 7.6) for 3 hours at room temperature and then incubated overnight at 4°C with primary antibodies (anti-CDX2, Cell Signaling Technology, Beverly, MA, USA, 1:2000; anti-β-actin, Santa Cruz Biotechnology, Dallas, TX, USA, 1:2000). The next day, the membranes were washed 6 times for 5 min each with TBST buffer, followed by incubation with horseradish peroxidase-labeled anti-goat IgG (Bioworld Technology, Louis Park, MN, USA; 1:5000) for 1 h at room temperature. Immunoreactivity was detected using the ECL Plus chemiluminescence detection kit (Beyotime, Shanghai, China) in a FluorChem M system (Cell Biosciences, San Leandro, CA, USA). The density of the bands was analyzed using Image Analysis Software (Tanon, Shanghai, China). Unless otherwise indicated, all other chemicals were purchased from Sigma-Aldrich (St. Louis, MO, USA). The results were confirmed by three independent experiments with 6 samples per treatment. Representative results of the three independent experiments are shown.
Bioinformatics
The WWW Promoter Scan (http://www-bimas. cit.nih.gov/molbio/proscan/) and MatInspector (http:// www.genomatix.de) bioinformatics programs were used to complete the analysis of the promoter regions of the nutrient transporter genes in the pig intestine and to further predict the novel target genes of CDX2.
Construction of reporter plasmids and cell transfection
The promoter region of pig SLC7A7 was cloned and inserted into the KpnI/MluI sites of pGl3-basic luciferase (Promega, Madison, WI, USA) to construct the pGL3-P1 plasmid. Subclones extending to positions −1763, −1713, −1644, and −1285 were constructed by deletion with restriction enzymes and re-ligation or by cloning the PCR sub-fragments into the pGl3-basic plasmid to produce pGL3-P2, pGL3-P3, pGL3-P4, and pGL3-P5 plasmids, respectively. (Table 3; Figure 8). Cells were seeded onto 24-well plates at a density of 105 cells/mL for 48 h, after which the cells reached approximately 70–80% confluence. Cells were then transfected with 0.1 mg purified recombinant report plasmids and 0.1 mg internal control reporter pRL-TK vector in serum-free medium using the Lipofectamine 2000 reagent (Invitrogen, Carlsbad, CA, USA).
Luciferase reporter assay
The activities of firefly and renilla luciferase in the cell lysates were measured using the Dual-Luciferase Reporter Assay System (Promega, Madison, WI, USA)
according to the manufacturer’s instructions. Cells were washed with PBS twice and then lysed with lysis buffer at room temperature for 15 min at 48 h after transfection. 20 μL of the cell lysate was transferred to a 96-well plate, and then 100 μL of Luciferase Assay Reagent II and 100 μL of Stop & Glo Reagent were sequentially added. The resulting intensity of the firefly and renilla luciferase was measured using a luminometer (BioTek, Winnoski, VT, USA). As a transfection efficiency control, the firefly luciferase activity was normalized to the renilla luciferase activity. All experiments were performed in duplicate and repeated at least three times with positive (pGL3-Control, Promega) and negative (pGL3-Basic, Promega) controls.
Chromatin immunoprecipitation (ChIP) assay
Standard ChIP assays were performed using the Pierce™ Agarose ChIP Kit (#26156; Thermo Fisher Scientific, USA) according to the manufacturer’s instructions. The Overexpression cells were seeded in a culture plate for 48 h to reach 50% confluence. The cross-linking between the nuclear protein and genomic DNA was performed in the growth medium with 1% formaldehyde supplementation at room temperature for 10 min. The cells were harvested and lysed with Lysis Buffer I. Chromatin was digested with MNase for 15 min at 37°C and incubated with CDX2 antibody or normal rabbit IgG overnight at 4°C. The antibody-chromatin complex beads were captured by Protein A/G agarose. DNA was separated from the beads and eluted using IP Elution Buffer for 40 min at 65°C. The DNA was further purified using a DNA Clean-up Column. Real-time PCR amplification was performed on a Stratagene MxPro 3005P thermocycler (Agilent Technologies, Santa Clara, CA, USA) using gene-specific primers for SLC7A7-P1 and SLC7A7-P3 (Table 2). PCR products were analyzed by electrophoresis on 1.5% agarose gels.
Statistical analysis
Data were processed using the statistical software package SAS 9.1.3 (SAS Institute Inc., NC) and expressed as the mean ± SE. Variance analysis was completed using a GLM procedure. P < 0.05 was considered a significant difference between the groups.
ACKNOWLEDGMENTS AND FUNDING
(2015A030310524), the National 948 Program of China (2011-G35), and the Science and Technology Planning Project of Guangzhou, Guangdong Province, China (201510010020).
CONFLICTS OF INTEREST
The authors declare no conflicts of interest.
REFERENCES
1. Guo RJ, Suh ER, Lynch JP. The role of Cdx proteins in intestinal development and cancer. Cancer Biol Ther. 2004; 3:593–601.
2. Coskun M, Troelsen JT, Nielsen OH. The role of CDX2 in intestinal homeostasis and inflammation. Biochim Biophys Acta. 2011; 1812:283–289.
3. Freund JN, Duluc I, Reimund JM, Gross I, Domon-Dell C. Extending the functions of the homeotic transcription factor Cdx2 in the digestive system through nontranscriptional activities. World J Gastroenterol. 2015; 21:1436–1443. 4. Simmini S, Bialecka M, Huch M, Kester L, van de
Wetering M, Sato T, Beck F, van Oudenaarden A, Clevers H, Deschamps J. Transformation of intestinal stem cells into gastric stem cells on loss of transcription factor Cdx2. Nat Commun. 2014; 5:5728.
5. Stringer EJ, Duluc I, Saandi T, Davidson I, Bialecka M, Sato T, Barker N, Clevers H, Pritchard CA, Winton DJ. Cdx2 determines the fate of postnatal intestinal endoderm. Development. 2012; 139:465–474.
6. Hinoi T, Lucas PC, Kuick R, Hanash S, Cho KR, Fearon ER. CDX2 regulates liver intestine–cadherin expression in normal and malignant colon epithelium and intestinal metaplasia. Gastroenterology. 2002; 123: 1565–1577.
7. Bhat AA, Sharma A, Pope J, Krishnan M, Washington MK, Singh AB, Dhawan P. Caudal homeobox protein Cdx-2 cooperates with Wnt pathway to regulate claudin-1 expression in colon cancer cells. PLoS One. 2012; 7:e37174.
8. Sakaguchi T, Gu X, Golden HM, Suh E, Rhoads DB, Reinecker HC. Cloning of the human claudin-2 5′-flanking region revealed a TATA-less promoter with conserved binding sites in mouse and human for caudal-related homeodomain proteins and hepatocyte nuclear factor-1α. J Biol Chem. 2002; 277:21361–21370.
9. Mesquita P, Jonckheere N, Almeida R, Ducourouble MP, Serpa J, Silva E, Pigny P, Silva FS, Reis C, Silberg D. Human MUC2 mucin gene is transcriptionally regulated by Cdx homeodomain proteins in gastrointestinal carcinoma cell lines. J Biol Chem. 2003; 278:51549–51556.
10. Johnson DR, Abdelbaqui M, Tahmasbi M, Mayer Z, Lee HW, Malafa MP, Coppola D. CDX2 protein expression compared to alcian blue staining in the evaluation of esophageal intestinal metaplasia. World J Gastroenterol. 2015; 21:2770–2776.
11. Gonzalez LM, Williamson I, Piedrahita JA, Blikslager AT, Magness ST. Cell lineage identification and stem cell culture in a porcine model for the study of intestinal epithelial regeneration. PLoS One. 2013; 8:e66465. 12. Silberg DG, Swain GP, Suh ER, Traber PG. Cdx1 and cdx2
expression during intestinal development. Gastroenterology. 2000; 119:961–971.
13. Beck F. The role of Cdx genes in the mammalian gut. Gut. 2004; 53:1394–1396.
14. Hinoi T, Loda M, Fearon ER. Silencing of CDX2 expression in colon cancer via a dominant repression pathway. J Biol Chem. 2003; 278:44608–44616.
[image:12.612.61.557.83.208.2]15. Guo RJ, Funakoshi S, Lee HH, Kong J, Lynch JP. The intestine-specific transcription factor Cdx2 inhibits β-catenin/
Table 3: Primers used for the construction of the truncated mutants of the SLC7A7 promoter
region
Gene/ Accession Primer sequence size (bp)Product
pGL3-P1-F F: 5′-CGGGGTACCGAGGCTGTAGGGTAGCGATAA-3′ 1899 pGL3-P2-F F: 5′CGGGGTACCGATTTCAGAATGAGTAGGGTTTAT-3′ 1785 pGL3-P3-F F: 5′-CGGGGTACCATTTAAGTACACTCTAACAACAG-3′ 1735 pGL3-P4-F F: 5′-CGGGGTACCGCCAGTTCAGCATAACTCAG-3′ 1666 pGL3-P5-F F: 5′-CGGGGTACCCAACCTTCCTGCCTTTCTT-3′ 1307 pGL3-P-R R: 5′-CCGCTCGAGCTCACAACACCACTCTTTTCC-3′
pGL3-P1-F = forward primer of recombinant pGL3-P1 (-1877/+22 in SLC7A7 promoter region); pGL3-P2-F = forward primer of recombinant pGL3-P2 (−1763/+22 in SLC7A7 promoter region); pGL3-P3-F = forward primer of recombinant pGL3-P3 (−1713/+22 in SLC7A7 promoter region); pGL3-P4-F = forward primer of recombinant pGL3-P4 (−1644/+22 in
TCF transcriptional activity by disrupting the β-catenin–TCF protein complex. Carcinogenesis. 2010; 31:159–166. 16. Bai ZG, Ye YJ, Shen DH, Lu YY, Zhang ZT, Wang S. PTEN
expression and suppression of proliferation are associated with Cdx2 overexpression in gastric cancer cells. Int J Oncol. 2013; 42:1682–1691.
17. Suh E, Traber PG. An intestine-specific homeobox gene regulates proliferation and differentiation. Mol Cell Biol. 1996; 16:619–625.
18. Uesaka T, Lu H, Katoh O, Watanabe H. Heparin-binding EGF-like growth factor gene transcription regulated by Cdx2 in the intestinal epithelium. Am J Physiol Gastrointest Liver Physiol. 2002; 283:840–847.
19. Li XG, Chen XL, Wang XQ. Changes in relative organ weights and intestinal transporter gene expression in embryos from white Plymouth Rock and WENS Yellow Feather Chickens. Comp Biochem Physiol A Mol Integr Physiol. 2013; 164:368–375.
20. Li XG, Sui WG, Yan HC, Jiang QY, Wang XQ. The in ovo administration of L-trans pyrrolidine-2, 4-dicarboxylic acid regulates small intestinal growth in chicks. Animal. 2014; 8:1677–1683.
21. Chen MX, Li XG, Yang JX, Gao CQ, Wang B, Wang XQ, Yan HC. Growth of embryo and gene expression of nutrient transporters in the small intestine of the domestic pigeon (Columba livia). J Zhejiang Univ Sci B. 2015; 16:511–523. 22. Chen MX, Li XG, Yan HC, Wang XQ, Gao CQ. Effect
of egg weight on composition, embryonic growth, and expression of amino acid transporter genes in yolk sac membranes and small intestines of the domestic pigeon (Columba livia). Poult Sci. 2016:doi:10.3382/ps/pew044. 23. Li XG, Sui WG, Gao CQ, Yan HC, Yin YL, Li HC, Wang
XQ. L-Glutamate deficiency can trigger proliferation inhibition via down regulation of the mTOR/S6K1 pathway in pig intestinal epithelial cells. J Anim Sci. 2016:doi:10.2527/jas2015–9432.
24. Toivonen M, Tringham M, Kurko J, Terho P, Simell O, Heiskanen KM, Mykkänen J. Interactions of y+LAT1 and 4F2hc in the y+L amino acid transporter complex:consequences of lysinuric protein intolerance-causing mutations. Gen Physiol Biophys. 2013; 32: 479–488.
25. Kanai Y, Fukasawa Y, Cha SH, Segawa H, Chairoungdua A, Kim DK, Matsuo H, Kim JY, Miyamoto K-i, Takeda E. Transport properties of a system y+L neutral and basic amino acid transporter insights into the mechanisms of substrate recognition. J Biol Chem. 2000; 275: 20787–20793.
26. Yin J, Ren WK, Duan JL, Wu L, Chen S, Li TJ, Yin YL, Wu GY. Dietary arginine supplementation enhances intestinal expression of SLC7A7 and SLC7A1 and ameliorates growth depression in mycotoxin-challenged pigs. Amino Acids. 2014; 46:883–892.
27. Yang H, Fu D, Kong X, Wang W, Yang X, Nyachoti C, Yin Y. Dietary supplementation with N-carbamylglutamate increases the expression of intestinal amino acid transporters in weaned Huanjiang mini-pig piglets. J Anim Sci. 2013; 91:2740–2748.
28. Kakizaki F, Aoki K, Miyoshi H, Carrasco N, Aoki M, Taketo MM. CDX transcription factors positively regulate expression of solute carrier family 5, member 8 in the colonic epithelium. Gastroenterology. 2010; 138:627–635. 29. Escaffit F, Paré F, Gauthier R, Rivard N, Boudreau F,
Beaulieu JF. Cdx2 modulates proliferation in normal human intestinal epithelial crypt cells. Biochem Biophys Res Commun. 2006; 342:66–72.
30. Sun YL, Wu ZL, Li W, Zhang C, Sun KJ, Ji Y, Wang B, Jiao N, He BB, Wang WW. Dietary L-leucine supplementation enhances intestinal development in suckling piglets. Amino Acids. 2015; 47:1517–1525. 31. Liu XD, Wu X, Yin YL, Liu YQ, Geng MM, Yang HS,
Blachier F, Wu GY. Effects of dietary L-arginine or N-carbamylglutamate supplementation during late gestation of sows on the miR-15b/16, miR-221/222, VEGFA and eNOS expression in umbilical vein. Amino Acids. 2012; 42:2111–2119.
32. Liu YL. Fatty acids, inflammation and intestinal health in pigs. J Anim Sci Biotechnol. 2015; 6:41.
33. Zhou D, Zhu YH, Zhang W, Wang ML, Fan WY, Song D, Yang GY, Jensen BB, Wang JF. Oral administration of a select mixture of Bacillus probiotics generates Tr1 cells in weaned F4ab/acR− pigs challenged with an F4+ ETEC/ VTEC/EPEC strain. Vet Res. 2015; 46:1–15.
34. Yao K, Yin YL, Li XL, Xi PB, Wang JJ, Lei J, Hou YQ, Wu GY. Alpha-ketoglutarate inhibits glutamine degradation and enhances protein synthesis in intestinal porcine epithelial cells. Amino Acids. 2012; 42:2491–2500.
35. Wang XQ, Yang WJ, Yang Z, Shu G, Wang SB, Jiang QY, Yuan L, Wu TS. The differential proliferative ability of satellite cells in Lantang and Landrace pigs. PloS One. 2012; 7:e32537.
36. Gao CQ, Zhi R, Yang Z, Li HC, Yan HC, Wang XQ. Low dose of IGF-I increases cell size of skeletal muscle satellite cells via Akt/S6K signaling pathway. J Cell Biochem. 2015; 116:2637–2648.