©IJRASET: All Rights are Reserved
201
Analyzing the Effect of Parametric Variation on
Performance of Grid Connected Solar PV System
in Indian Scenario
Sadaf Siddiqui1, Atul Kumar Dadhich 2
1
M.Tech. (Scholar) Department of Electrical Engineering, Vivekananda Global University, Jaipur, Rajasthan, India 2
Assistant Professor, Department of Electrical Engineering, Vivekananda Global University, Jaipur, Rajasthan, India
Abstract: The performance and economy of a solar photovoltaic system depends on location and geographic parameters. Predicting energy efficiency is important for effective planning and evaluation rates. The proposed study explores the performance evaluation of three interconnected geographically connected photovoltaic solar systems. In Jaipur, Kolkata and Chennai have been testing a 1 MW solar PV system for a year.
Simulations were performed using PV Syst (a software tool developed by the University of Geneva) and hourly weather data was obtained from NASA and METEONORM. The loss map for energy production and calculations shows the significant impact of geography on the performance and economics of solar PV systems.
The monthly performance of the system indicates the impact of changes in weather parameters on radiation and ambient temperature performance and energy system performance.
In order to optimize system performance, the annual power generation per unit of electricity at different locations was compared and discussed.
Keywords:Loss Analysis, PV-Syst, Grid Connected System, Yield.
I. INTRODUCTION
A Solar Photovoltaic (PV) is electronic PV device that converts the light energy into electric energy. The first solar panel power satellite was launched 1958 through the “Hoffman electronics”.
Solar power is the one of the best options. because sun ray never reserves and decrease. On the other hand benefit of solar radiation available in our atmosphere in free of cost.
The regular price hike in fuel and global warming and environmental pollution leads the path towards the use of renewable energy sources. Solar Pv system consists of an arrangement of several components, including solar panels to absorb and convert sunlight into electricity, a solar inverter to change the electric current from DC to AC, as well as mounting, cabling and other electrical accessories to set up a working system.
The term "photovoltaic" combines two terms - "photo" means light and "volt" means voltage. The photovoltaic system in this discussion uses photovoltaic cells to convert sunlight directly into electrical energy. Made of crystalline silicon. Solar cells are also known as photovoltaic (PV) cells. It is a static device with no moving parts. The photovoltaic system is designed to power the load. The load can be AC or DC. It takes place during the day or night or twice. Photovoltaic systems can only be supplied during the day. We need consumables because we have batteries and electricity that can be stored and used. Solar photovoltaic (PV) devices generate electricity directly from sunlight through electronic processes, and the process naturally occurs in certain types of materials, called semiconductors. The electrons in these materials are released by solar energy and can be sensed by electrical circuits to power electrical equipment or generate electricity to the grid.
II. GRIDCONNECTEDPVSYSTEM
©IJRASET: All Rights are Reserved
202
Figure 1.Grid Connected Solar PV SystemThe inverter is used to convert the direct current (DC) generated by the solar panel into a load of alternating current (AC). Today, many investors on the market are based on battery connections and network systems. Investors need to determine the magnitude of the expected power level to be processed and are compatible with the conditions on the network side. Other components include JS mounting systems, wiring, switches, disconnectors and system monitors. These components have not been studied in detail. The use of DC cables should at least maintain high resistance losses and costs [39]. For the central inverter, there is also a junction box between the matrix and the inverter fuse to protect against voltage overload. In a network system, the grid itself is like an infinite energy store. Excess energy can be supplied to the grid.
III. SYSTEMMODEL
To use PVSYST and study the performance potential of photovoltaic and solar thermal systems, irradiation data and precise global temperatures are critical. In PVSYST, both wind speed and diffuse radiation are optional.
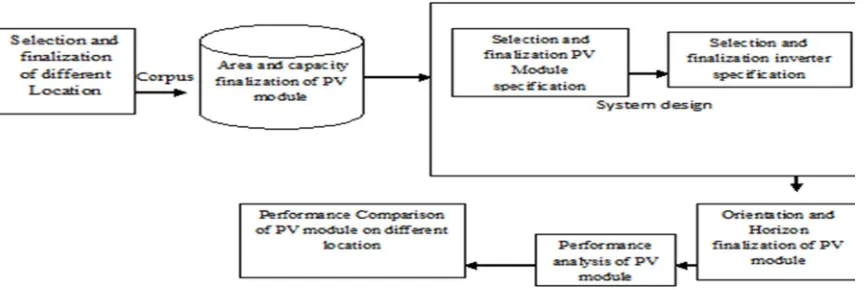
Figure 2. Architecture of the Proposed Grid Connected Solar PV System
PVSYST uses the irradiance data imported in PVSYST to create irregular markers using imported functional weather data. Unless otherwise stated, the information in this chapter is the PVSYST Contextual Help Manual. The layout and simulation of network-connected solar PV systems was extended using the following data sets.
Meteological Data- Meteonorm software provides monthly weather data for every point on the planet. They also use a stochastic model to provide time-based data based on synthetic generation. If there is a station in a given venue, Meteonorm will use interpolation between the three stations. Satellite data from five geostationary satellites was used as a supplement when soil data was poor. 8 km horizontal resolution. Soil measurement uncertainty ranges from 1% to 10% (Meteonorm results [46]) and satellite data ranges from 3% to 4% (low latitude). For terrestrial interpolation, the uncertainty is 1% over a distance of 2 km, 6% to 100 km, and 8% for distances greater than 2000 km. Horizontal diffuse illumination was calculated using the Perez model to separate the global radiation beam and the diffuse component.
[image:2.612.93.526.430.575.2]©IJRASET: All Rights are Reserved
203
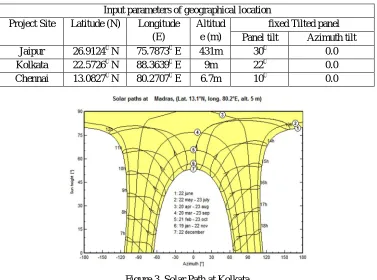
Table 1 : Input Parameters of Geographical LocationsFigure 3. Solar Path at Kolkata
1) Selection of Solar Panel- In PV systems, the preset is based on area or power. Depending on the size, the panel is selected based on the rated power and operating voltage.
2) Selection of Inverter- In PV syst the selection of inverter is done in accordance with the selection of pv panel.The rating of invereter should match with the specifications of panel.
[image:3.612.179.432.526.708.2]3) Orientation and Horizon- In the proposed work study, we have simulated a 1 MWp fixed tilt system that has been selected for fixed tilted linear shading. Photovoltaic systems have been established in Jaipur (26.9124°N, 75.7873°E and 431m), Kolkata (22.57260 N, 88.36390 E and 9 m) and Chennai (13.0827°N, 80.2707°E and 6.7 m) with latitude and altitude Height and altitude. Again, it is also developed for other places. The time zone is selected according to the Indian Standard Time (IST). In the next section, the stepwise integration of the mathematical equivalent model for a given grid-connected system in PV Syst is discussed.
Figure 4. Orientation and Horizon finalization of PV module Input parameters of geographical location
Project Site Latitude (N) Longitude (E)
Altitud e (m)
©IJRASET: All Rights are Reserved
204
III. SIMULATION&RESULT
[image:4.612.180.433.135.300.2]The overall simulation has been performed on PVSyst 5.74. 1 MWp simulation results can be divided into three categories Production forecast/simulation, Loss simulation, and Economic simulationThese simulations were conducted for Jaipur, Calcutta, and Chennai for 1 MWp grid-connected solar PV systems so that we can analyze and compare performance.
Figure 5. Design of Solar PV over Area
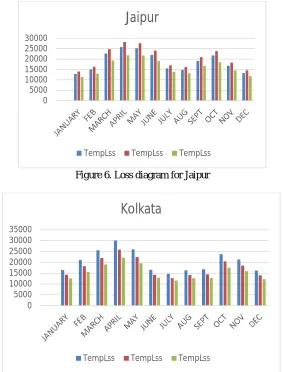
[image:4.612.164.447.342.714.2]Losses Simulation-The yearly nominal yield and actual yield has been simulated using pv syst software for three different locations. The plot of yield has been characterized as normaized poroduction and main results.
Figure 6. Loss diagram for Jaipur
Figure 7. Loss diagram for Kolkata 0 50 100 150 200 250 Ja n -1 6 Fe b -1 6 M ar -1 6 Ap r-16 M ay -1 6 Ju n -1 6 Ju l-1 6 Au g-1 6 Se p -1 6 O ct -1 6 N ov -1 6 D e c-16
Synthetic-Meteo For Jaipur
GlobHor DiffHor GlobInc
0 5000 10000 15000 20000 25000 30000
Jaipur
TempLss TempLss TempLss
0 5000 10000 15000 20000 25000 30000 35000
Kolkata
©IJRASET: All Rights are Reserved
205
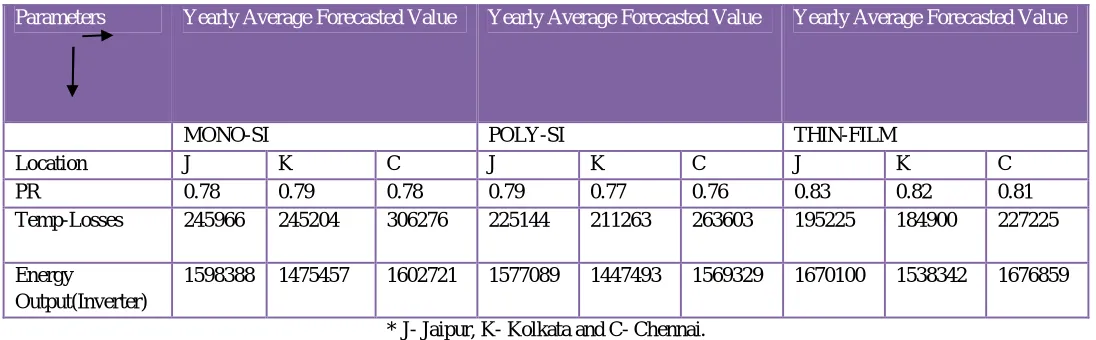
Figure 8. Loss diagram for ChennaiThe table 3 compares parameters namely performance ratio, temperature dependent losses and energy output (Inverter) for different PV technology and compare it with values in three different cities namely- Jaipur, Kolkata and Chennai.
Table 3 Comparision of Simulation/Forecasting
Parameters Yearly Average Forecasted Value Yearly Average Forecasted Value Yearly Average Forecasted Value
MONO-SI POLY-SI THIN-FILM
Location J K C J K C J K C
PR 0.78 0.79 0.78 0.79 0.77 0.76 0.83 0.82 0.81
Temp-Losses 245966 245204 306276 225144 211263 263603 195225 184900 227225
Energy
Output(Inverter)
1598388 1475457 1602721 1577089 1447493 1569329 1670100 1538342 1676859
* J- Jaipur, K- Kolkata and C- Chennai.
IV. CONCLUSION
We infer from the above data from the PV SYST software. For thin film modules, Jaipur's performance is better than other venues. For polysilicone modules, Jaipur has the best performance ratio. Compared to a single silicone component, Kolkata's performance is better than other sites. For single-unit silicone modules, the temperature-dependent loss at the Kolkata site is minimal. For the silicone module, the temperature-dependent loss of Kolkata is minimal for the film silica gel module, and the temperature dependence loss of the Kolkata site is minimal. For film modules, Chennai's final production is the highest compared to other parts. For silicone modules, Jaipur's final production is the highest compared to other locations. For mono silica modules, Chennai's final production is the highest compared to other parts. For thin film modules, Chennai's energy output works best on co. Compared with other parts. For polysilicone modules, Jaipur's energy output is optimal compared to other parts. For mono silica gel modules, Chennai's energy output is optimal compared to other parts. So we can see that the thin film module is the best, but the disadvantage of the thin film module is that it requires more area than other module technologies.
REFERENCES
[1] Villalva, Marcelo Gradella, Jonas Rafael Gazoli, and Ernesto Ruppert Filho. "Comprehensive approach to modeling and simulation of photovoltaic arrays." IEEE Transactions on power electronics 24.5 (2009): 1198-1208.
[2] Sera, Dezso, Remus Teodorescu, and Pedro Rodriguez. "PV panel model based on datasheet values." Industrial Electronics, 2007. ISIE 2007. IEEE International Symposium on. IEEE, 2007.
[3] Soto, W. D. SA Klein e WA Beckman,”Improvement and validation of a model for photovoltaic devices.” Renewable Energy 247 (2002): 78-88.
[4] Caracciolo, F., Dallago, E., Finarelli, D. G., Liberale, A., & Merhej, P. (2012). Single-variable optimization method for evaluating solar cell and solar module parameters. IEEE Journal of Photovoltaics, 2(2), 173-180
0 10000 20000 30000 40000
Chennai
[image:5.612.33.581.303.473.2]©IJRASET: All Rights are Reserved
206
[5] Acakpovi, Amevi, and Essel Ben Hagan. "Novel photovoltaic module modeling using Matlab/Simulink." International Journal of Computer Applications 83.16 (2013).
[6] Nema, Savita, R. K. Nema, and Gayatri Agnihotri. "Matlab/simulink based study of photovoltaic cells/modules/array and their experimental verification." International journal of Energy and Environment 1.3 (2010): 487-500.
[7] Gow, J. A., and C. D. Manning. "Development of a photovoltaic array model for use in power-electronics simulation studies." IEE Proceedings-Electric Power Applications 146.2 (1999): 193-200.
[8] Femia, Nicola, et al. "Optimization of perturb and observe maximum power point tracking method." IEEE transactions on power electronics 20.4 (2005): 963-973.
[9] Xiao, Weidong, Nathan Ozog, and William G. Dunford. "Topology study of photovoltaic interface for maximum power point tracking." IEEE Transactions on industrial electronics 54.3 (2007): 1696-1704.
[10] A Ortiz-Conde, D Lugo-Munoz, FJ García-Sánchez,” An explicit multiexponential model as an alternative to traditional solar cell models with series and shunt resistances” IEEE Journal of Photovoltaics, 2012
[11] Rahmani, R., et al. "A complete model of stand-alone photovoltaic array in MATLAB-Simulink environment." Research and Development (SCOReD), 2011 IEEE Student Conference on. IEEE, 2011.
[12] Mahmoud, Yousef, W. Xiao, and H. H. Zeineldin. "A simple approach to modeling and simulation of photovoltaic modules." IEEE transactions on Sustainable Energy 3.1 (2012): 185-186.
[13] Xiao, Weidong, et al. "Real-time identification of optimal operating points in photovoltaic power systems." IEEE Transactions on Industrial Electronics 53.4 (2006): 1017-1026.
[14] Bayrak, Zehra Ural, et al. "A low-cost power management system design for residential hydrogen & solar energy based power plants." International Journal of Hydrogen Energy 41.29 (2016): 12569-12581
[15] Uzunoglu, M., and M. S. Alam. "Dynamic modeling, design, and simulation of a combined PEM fuel cell and ultracapacitor system for stand-alone residential applications." IEEE Transactions on Energy Conversion 21.3 (2006): 767-775.
[16] Onar, O. C., M. Uzunoglu, and M. S. Alam. "Modeling, control and simulation of an autonomous wind turbine/photovoltaic/fuel cell/ultra-capacitor hybrid power system." Journal of Power Sources 185.2 (2008): 1273-1283.
[17] Hidaka, Yasuhito, and Koji Kawahara. "Modeling of a hybrid system of photovoltaic and fuel cell for operational strategy in residential use." Universities Power Engineering Conference (UPEC), 2012 47th International. IEEE, 2012.
[18] Gaonkar, D. N., and Sanjeev Nayak. "Modeling and performance analysis of microturbine based Distributed Generation system,“a review”." Energytech, 2011 IEEE. IEEE, 2011.
[19] Khan, M. J., and M. T. Iqbal. "Pre-feasibility study of stand-alone hybrid energy systems for applications in Newfoundland." Renewable energy 30.6 (2005): 835-854.
[20] Ganguly, Aritra, D. Misra, and S. Ghosh. "Modeling and analysis of solar photovoltaic-electrolyzer-fuel cell hybrid power system integrated with a floriculture greenhouse." Energy and Buildings 42.11 (2010): 2036-2043.
[21] Yu, Dachuan, and S. Yuvarajan. "Electronic circuit model for proton exchange membrane fuel cells." Journal of Power Sources 142.1-2 (2005): 238-242. [22] Reddy, J. Nagarjuna, M. Kalia Moorthy, and DV Ashok Kumar. "Control of grid connected PV cell distributed generation systems." TENCON 2008-2008
IEEE Region 10 Conference. IEEE, 2008.
[23] Jiang, Yuncong, Jaber A. Abu Qahouq, and Tim A. Haskew. "Adaptive step size with adaptive-perturbation-frequency digital MPPT controller for a single-sensor photovoltaic solar system." IEEE transactions on power Electronics 28.7 (2013): 3195-3205.
[24] Bhuvaneswari, G., and R. Annamalai. "Development of a solar cell model in MATLAB for PV based generation system." India Conference (INDICON), 2011 Annual IEEE. IEEE, 2011.
[25] Park, Hyeonah, and Hyosung Kim. "PV cell modeling on single-diode equivalent circuit." Industrial Electronics Society, IECON 2013-39th Annual Conference of the IEEE. IEEE, 2013.
[26] Islam, Aneek, and Md Iqbal Bahar Chowdhury. "A Simulink based generalized model of PV cell/array." Developments in Renewable Energy Technology (ICDRET), 2014 3rd International Conference on the. IEEE, 2014.
[27] Kumar, Nitin, Priya Yadav, and S. S. Chandel. "Comparative analysis of four different solar photovoltaic technologies." Energy Economics and Environment (ICEEE), 2015 International Conference on. IEEE, 2015.
[28] Almaktar, Mohamed, Hasimah Abdul Rahman, and Mohammad Yusri Hassan. "Effect of losses resistances, module temperature variation, and partial shading on PV output power." Power and Energy (PECon), 2012 IEEE International Conference on. IEEE, 2012.
[29] Irwanto, M., et al. "Analysis simulation of the photovoltaic output performance." Power Engineering and Optimization Conference (PEOCO), 2014 IEEE 8th International. IEEE, 2014.