THE APPLICATION OF pH and ORP PROCESS CONTROL
PARAMETERS WITHIN THE AEROBIC DENITRIFICATION
PROCESS
A THESIS SUBMITTED
IN
FULFILMENT
OFTHE
DEGREE OF DOCTOR OF PHILOSOPHY IN CIVIL ENGINEERING
BY JOSEPH BERNARD HOLMAN
DEPARTMENT OF CIVIL ENGINEERING
THE UNIVERSITY OF CANTERBURY
NEW ZEALAND
ACKNOWLEDGEMENTS
I would like to give sincere thanks to my Supervisor Dr David Wareham for his guidance and encouragement throughout my study. The advice and knowledge imparted by David is much appreciated.
Special thanks also to Dave MacPherson and Richard Newton (technical staff at the University of Canterbury) who provided so much input to the project from 2000-2004.
The financial support offered by the University of Canterbury through a research grant is gratefully acknowledged.
Thanks is given to the Foundation for Research Science and Technology whose support through a Bright Future Scholarship made this research possible.
ACKNOWLEDGEMENTS TABLE OF CONTENTS
TABLE OF CONTENTS
LIST OF FIGURES AND TABLES ABSTRACT
Chapter 'I LITERATURE REVIEW
1.1 NITROGEN IN WASTEWATER
1.2 NITRIFICATION
1.3 DENITRIFICATION
1.4 AEROBIC DENITRIFICATION
1.4.1 BIOLOGICAL EXPLANATIONS FOR AEROBIC DENITRIFICATION
1.4.2 PHYSICAL EXPLANATION FOR AEROBIC DENITRIFICATION
1.5 OPERATION OF PROBES
1.5.1 OXIDATION REDUCTION POTENTIAL (ORP)
1.5.2 HYDROGEN ION CONCENTRATION (pH)
1.5.3 DISSOLVED OXYGEN CONCENTRATION [DO]
1.6 ONLINE REAL TIME PROFILES (ORT PROFILES)
1.7 APPLICATION OF ONLINE PARAMETERS
1.8 PROJECT NEED, OBJECTIVES, AND METHODOLOGY
1.8.1 PROJECT NEED
1.8.2 PROJECT OBJECTIVES
1.8.3 PROJECT METHODOLOGY
Chapter 2 EXPERIMENTAL HARDWARE AND OPERATION
2.1 REACTORS
2.2 AIR SUPPLY SYSTEM
2.3 PROCESS CONTROL SYSTEM
2.4 FEED SUPPLY SYSTEM
2.5 EXPERIMENTAL OPERATION
2.6 REACTOR SEED
2.7 REACTOR FEED
2.8 REACTOR OPERATION AND CONTROL PARAMETERS
2.9 REACTOR COMISSIONING
Chapter 3 EXPERIMENTAL TESTING
3.1 TESTING UNDERTAKEN
3.2 SAMPLE PRESERVATION AND STORAGE
3.2.1 COD
3.2.2 TPN
3.2.3 NH3-N
3.2.4 N03-N
3.2.5 N02-N, ORTHO P, AND TP
3.3 ON-LINE MONITORING
3.3.1 ORP
3.3.2 pH
3.3.3 DO
Chapter 4 EXPERIMENTAL RESULTS SUMMARY
2 4 6 8 14 18 19 20 22 23 28 32 32 33 34 36 38 41 44 46 47 47 50 52 53 56 56 56 57 57 57 57 58 58 58
4.1 INTRODUCTION TO EXPERIMENTAL RESULTS 59
4.2 SUMMARY AND EXAMPLE OF OPERATIONAL DISSOLVED OXYGEN CONCENTRATION 4.0 mg/L 64
4.3 SUMMARY AND EXAMPLE OF OPERATIONAL DISSOLVED OXYGEN CONCENTRATION 2.5 mg/L 70
4.4 SUMMARY AND EXAMPLE OF OPERATIONAL DISSOLVED OXYGEN CONCENTRATION 1.0 mg/L 77
5,1 5,2 5,3 5.4 5,5 5,6 5,7 6,1 6,2 A1 A2 A3 A4 B1 B2 B3 B4
TABLE
CONTENTS
Chapter 5.0 DISCUSSION
(Objective 1) Confirm the presence of aerobic denitrification activity
(Objective 2) Elucidate some operational aspects of aerobic denitrification, in particular comment on the nitrification, denitrification, and sludge production rates,
5,2,1 Nitrification rates
5,2,2 Denitrification rates
5,2,3 Sludge production rates
(Objective 3) Comment on the requirements for air relative to conventional separate stage nitrification denitrification processes,
(Objective 4) Identify the dissolved oxygen conditions necessary for aerobic denitrification and for its optimisation,
(Objective 5) Comment on the need for soluble organic carbon for the removal of nitrogen in the aerobic denitrification process,
(Objective 6) Confirm if the online profiles have unique features with respect to the aerobic denitrification process, in particular the ammonia elbow on the ORP prOfile and the ammonia valley on the pH profile, Correlate these online features with measured biochemical events such as the depletion of organic carbon or ammonia nitrogen,
5,6,1 ORP
5,6.2 pH
5,6,3 Dissolved oxygen [DO]
5,6.4 Air flow rate
(Objective 7) Develop and demonstrate control algorithms that use online features to control the aerobic
denitrification process, (Le, indirectly detect the biochemical events), In doing so demonstrate the reliability of pH and ORP control algorithms based upon relative rather than absolute values,
5,7,1 ORP
5,7,2 pH
5,7,3 Disolved oxygen [DO]
5,7.4 Air flow rate
Chapter 6.0 CONCLUSIONS AND RECOMMENDATIONS
CONCLUSIONS RECOMMENDATIONS
APPENDIXA1
TRACK STUDY ONE TO TRACK STUDY SEVEN DOSP 4,0 mg/L TRACK STUDY ONE TO TRACK STUDY SEVEN DOSP 2,5 mg/L TRACK STUDY ONE TO TRACK STUDY SEVEN DOSP 1,0 mg/L TRACK STUDY ONE TO TRACK STUDY SEVEN DOSP 0,5 mg/L
APPENDIX 81
PHOTOS OF EXPERIMENTAL HARDWARE
SEQUENCING BATCH REACTOR OPERATIONAL PARAMETERS
DETERMINATION OF AERATION SYSTEM EFFICIENCY
PROCESS CONTROL SOFTWARE AND CONTROL ALGORITHMS
Figure
Figure 1.4-1 Figure 1.4-2 Figure 1.5-1 Figure 1.5-2 Figure 1.6-1 Figure 1.6-2 Figure 1.7-1 Figure 2.1-1 Figure 2.2-1 Figure 2.2-2 Figure 2.3-1 Figure 2.4-1 Figure 2.5-1 Figure 2.7-1 Figure 2.7-2 Figure 4.1-1 Figure 4.2-1 Figure 4.2-2 Figure 4.2-3 Figure 4.2-4 Figure 4.2-5 Figure 4.2-6 Figure 4.3-1 Figure 4.3-2 Figure 4.3-3 Figure 4.3-4 Figure 4.3-5
LIST OF FIGU
Description
Schematic of possible dissolved oxygen profile within microbial floc (Adapted from Pochana and Keller 1999).
Representative view of sludge floc under a microscope with suggested zones for nitrification and denitrification. (Adapted from Demoulin et al (2001)).
Diagram of an ORP electrode and operation Diagram of a pH electrode
Generalized schematic of ORP, pH, and DO profiles, main bending points illustrated. Typical ORP vs time profile showing nitrate breakpoint (adapted from Wareham et al (1993))
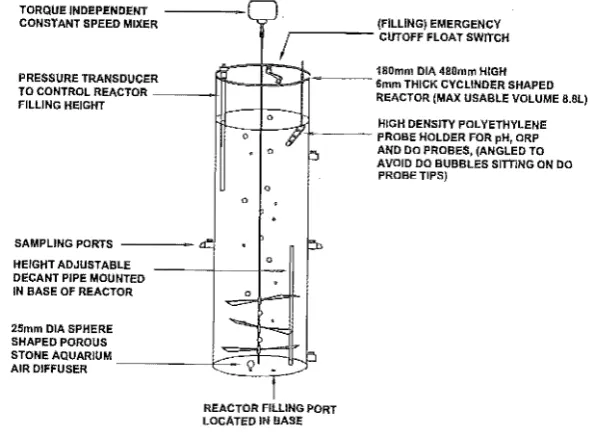
Typical ORP profile for AIO BNR plant (adapted from NZWWA, 1997) Diagram of one sequencing batch reactor
Aeration system for set pOints down to 1.0 mg/L (Duplicated for second reactor).
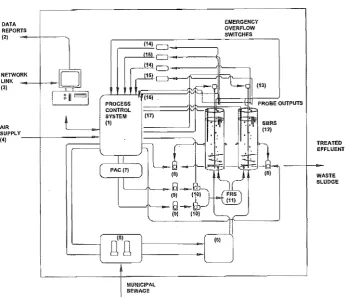
Aeration system for set points below 1.0 mg/L (Duplicated for second reactor) Process control system (with attached hardware)*
Heating of wastewater
Representative configuration of the SBR process.
Schematic of Bromley wastewater treatment plant with the location of experimental feed collection indicated, (Adapted from Christchurch City Council public information brochure). Organic carbon degradation during wastewater storage
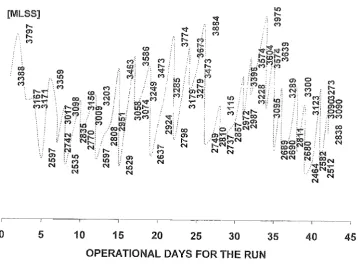
Effect of DO concentration on SRT required to achieve effluent ammonia concentrations less than 1.0 mg/L in a completely mixed activated sludge system (adapted from Metcalf and Eddy Mixed liquor suspended solids concentration DOSP 4.0 mg/L
Mixed liquor wastage DOSP 4.0 mg/L
Solids residence time DOSP 4.0 mg/L
pH and [soluble nitrogen] Air flow rate [NH3-N] and [COD] ORP and [~O]
Mixed liquor suspended solids concentration OOSP 2.5 mg/L
Mixed liquor wastage DOSP 2.5 mg/L Solids residence time DOSP 2.5 mg/L
pH and [soluble nitrogen] Air flow rate [NH3-N] and [COD]
Figure Figure 4.4-2 Figure 4.4-3 Figure 4.4-4 Figure 4.4-5 Figure 4.4-6 Figure 4.5-1 Figure 4.5-2 Figure 4.5-3 Figure 4.5-4 Figure 4.5-5 Figure 4.5-6 Figure 5.2-1 Figure 5.2-2 Figure 5.5-1 Figure 5.5-2 Figure 5.6.1-1 Figure 5.6.1-2 Figure 5.6.1-3 Figure 5.6.1-4
LIST OF FI URES
Description Mixed liquor wastage OOSP 1.0 mg/L
Solids residence time OOSP 1.0 mg/L pH and [soluble nitrogen]
Air flow rate [NH3-N] and [COD] ORP and [~O]
Mixed liquor suspended solids concentration OOSP 0.5 mg/L Mixed liquor wastage OOSP 0.5 mg/L
Solids residence time OOSP 0.5 mg/L pH and [soluble nitrogen]
Air flow rate, [1\lH3-N] and [COD] ORP and [~O]
Nitrification rate versus dissolved oxygen concentration
Extension in aeration time required to oxidise ammonia nitrogen (relative to OOSP 4.0 mg/L) Cycle illustrating nitrogen removal rate versus soluble organic carbon availability
PHS (poly-B-hydroxybutyrate)
Illustration of ORP elbow in an AlO process. (Figure Adapted from Yu et al (1998)
Illustration of ORP elbow in an AlO process. (Figure Adapted from Ra et al (2000)
Illustration of ORP ammonia elbow in an aerobic denitrification process, Holman and Wareham (2003), (note anoxic phase for first 10 minutes). *First ORP elbow resulted from organic carbon depletion, not shown.
Illustration of ORP elbow in aerobic sludge digestion process. (Figure adapted from Wareham
et al 1993).
Figure 5.6.1-5 Illustration of absence of ORP ammonia elbow when dissolved oxygen concentration maintained at a consistent level (taken from TS1 OOSP 4.0 mg/L).
Figure 5.6.2-1 Typical pH profile, (aeration starts at time = 0) Figure 5.6.4-1 Typical air flow profile
Table Table 2.7-1 Table 2.7-2 Table 3.1-1 Table 3.1-2 Table 3.1-3 Table 4.1-1 Table 4.2-1 Table 4.2-2 Table 4.3-1 Table 4.3-2 Table 4.4-1 Table 4.4-2 Table 4.5-1 Table 4.5-2 Table 5.2-1 Table 5.2-2 Table 5.2-3 Table 5.3-1 Table 5.4-1
LIST OF TABLES
DescriptionI nfluent wastewater characteristics
Wastewater degradation while in cold storage Chemical parameters monitored
Chemical parameters analyzed using colorimetric methods HACH nitrogen tests used in this research
Summary of results DOSP 4.0 mg/L - 0.5 mg/L
Summary of track study data [operational dissolved oxygen] 4.0 mg/L Summary of HRT values DOSP 4.0 mg/L
Summary of track study data [operational dissolved oxygen] 2.5 mg/L
Summary of HRT values DOSP 2.5 mg/L
Summary of track study data [operational dissolved oxygen] 1.0 mg/L
Summary of HRT values DOSP 1.0 mg/L
Summary of track study data [operational dissolved oxygen] 0.5 mg/L
Summary of HRT values DOSP 0.5 mg/L
Aeration time relative to dissolved oxygen concentration
Comparison of biochemical transformation rates between conventional and aerobic denitrification processes.
Normalized sludge production
Total air required for ammonia oxidation
Effect of dissolved oxygen concentration on aerobic nitrogen losses
Page number
ABSTRACT
Aerobic denitrification is a biological nitrogen removal process in which nitrification and denitrification occur simultaneously (in the same reactor) under identical environmental conditions. This contrasts to traditional separate stage nitrification denitrification in which the nitrification and denitrification processes occur sequentially in different reactors under opposing environmental conditions. While aerobic denitrification has long been identified in other ecosystems (such as the nitrogen cycle within soil) it was not thought possible within wastewater treatment processes. The existence of aerobic denitrification within wastewater treatment systems was first identified in the early 1980's following nitrogen mass balances that suggested unexplained nitrogen losses were occurring in the aeration tanks of many full-scale biological nutrient removal facilities (total nitrogen losses of up to 30% were frequently occurring U.S.EPA (1987)). Since then researchers and engineers have attempted to elucidate the mechanics behind the aerobic denitrification phenomenon and the conditions required for its optimization. It is thought that aerobic denitrification may offer advantages and possible savings when compared to alternative traditional separate stage nitrification denitrification processes.
The use of real time parameters such as ORP, pH, DO and airflow rate (oxygen demand) can provide immediate insight into a biological treatment process. This knowledge can be used to ensure optimum performance in terms of real time pollutant concentrations and hydraulic loads. This research aimed to elucidate some operational aspects of the aerobic denitrification phenomenon, to investigate opportunities for several types of real time control (ORP, pH, DO, and airflow), and to develop a process control system using the online parameters.
online in real time while other biochemical parameters (such as the various forms of nitrogen) were measured periodically using HACH photometric procedures. Dissolved oxygen concentration was the operational variable (dissolved oxygen set points (DOSP) 4.0-0.5 mg/L), other parameters such as MLSS concentration and feed strength were maintained (where possible) at a consistent value (-3000
mg/L and - 600 mg/L COD respectively). The system was operated under both
nitrification and aerobic denitrification conditions with the dissolved oxygen concentration determining the degree to which aerobic denitrification existed
(-40% TN removal at DOSP 0.5 mg/L).
The biochemical event of interest was the depletion of ammonia nitrogen. The key online profiles of interest were the ORP-time profile and the pH-time profile. The research sought to demonstrate the credibility of ORP and pH as real time control parameters for the depletion of ammonia nitrogen in the aerobic denitrification process. To achieve this a microprocessor-software based process control system was developed by using the relationship between online measurements and biochemical events.
was the dissolved oxygen concentration. The results indicated the aerobic denitrification process has an optimum dissolved oxygen concentration around but probably below 0.5 mg/L. The process probably does not have an optimum concentration but an optimum range. It is likely this range is influenced by variables such as the biomass concentration and the release of reducing power in terms of the ability to hydrolyze stored carbon polymers.
A secondary objective of this research was to elucidate advantages of aerobic denitrification relative to alternative traditional separate stage nitrification denitrification processes. For example it has been proposed that aerobic denitrification may require smaller treatment reactors, require less air for nitrification, produce less sludge per unit of wastewater treated (relative to a traditional nitrification-denitrification process), and have less dependence on organic carbon for denitrification.
The results suggested the low dissolved oxygen concentrations required for the aerobic denitrification process significantly inhibit the nitrification process. This causes a considerable extension in the required aeration times for the oxidation of ammonia nitrogen (-300% increase in aeration time relative to a traditional nitrification process). The longer aeration times suggest the process may not offer savings in terms of aeration requirements (aerobic denitrification required -200% more air per unit of wastewater treated relative to a traditional nitrification process) or treatment tank sizes (relative to traditional separate stage processes).
Chapter 1 LITERATURE REVIEW
1.1 NITROGEN 11\1 WASTEWATER
Untreated wastewater typically contains nitrogen in one of five forms. These are
organic nitrogen, ammonia nitrogen (I\IH3-N) ammonium nitrogen (NH/-N), nitrite
nitrogen (N02-N), and nitrate nitrogen (N03-N). The organic and ammonia
nitrogen forms predominate. Organic nitrogen is converted to ammonia nitrogen
as cells die and bacterial decomposition of matter occurs. Ammonia nitrogen
exists either as the ammonium ion or as ammonia depending upon the pH, at pH
levels below 9 the ammonium ion predominates (Metcalf and Eddy (2001 )).
Primary and secondary treatment facilities do not remove nitrogen from
wastewater. Typically nitrogen remains in the organic, ammonia nitrogen, or
nitrate nitrogen forms. In some instances the discharge of nitrogen in treated
effluents may pose an environmental or public health risk. Nitrogen in the form of
organic nitrogen, ammonia, or the ammonium ion can exert an oxygen demand
on the receiving water body as it is transformed to an oxidized form. Nitrogen in
the ammonia and nitrite forms is known to be toxic to fish. Nitrate is a
biostimulant which may cause eutrophication of water bodies and has also been
linked to methemoglobinemia or blue baby syndrome in infants when present in
drinking water supplies (particularly contaminated ground water sources)
(Spalding and Exner (1993), Azov ef al (1995), Meinardi et al (1995), Agrawal ef
al (1999), Addiscott (2000)).
Due to the potential environmental and public health impacts the removal of
nitrogen from wastewater is becoming a requirement in many developed
countries. For example, countries within the European Union (EU) are
increasingly specifying nitrogen removal as a treatment objective (Fuerhacker et
a/ (2000)). Typical nitrogen removal rates (such as those required in Austria)
N03-N to below 10 mg/L. The removal of nitrogen is also an economic necessity
for some European wastewater plants. New environmental protection legislation has seen penalty taxes applied to nitrogen in wastewater effluents. For example in Denmark the discharge of nitrogen from treatment plants is now taxed at a rate of $US2.40/kg (Cecil (2003». Cecil (2003) investigated the Ejby Molle plant in Denmark and reported possible penalty tax savings of $US 48,000 per year for every 1 mg/L of N that could be removed. The removal of nitrogen is typically achieved in two separate stages, these are called nitrification and denitrification.
1 NITRIFICATION
Nitrification involves two steps the first being the biological oxidation of the ammonium ion, (NH/) to nitrite nitrogen (N02-) as shown in equation (1.2-1).
Step One - (Nitrification)
5NH/ +7602 +109HC03 Nltrosomonas
Oxidation state of nitrogen -3 + +4 ::;; +1
Equation 1
Oxidation
+ -4::;; -1 of nitrogen :::
First stage of nitrification.
Within this simplified step the oxidation state of the nitrogen goes from in the ammonium to +3 in the nitrite. This has involved the donation of electrons from the nitrogen atom (or oxidation) where oxygen has acted as the electron acceptor (has been reduced). ((Metcalf and Eddy (1991».
This reaction proceeds through the action of a group of approximately six
bacteria commonly referred to as Nitrosomonas. These bacteria are
(1980». The bacteria act as catalysts in the reaction by reducing the activation energy required for the ammonium ion to be oxidized (Thain and Hickman
(1996».
The second nitrification step involves the oxidation of nitrite (N02-) to nitrate (N03-) as shown in equation (1.2-2).
Step Two - (Nitrification)
Oxidation state of nitrogen:: +3 +3 + -4 ='1
Equation 1
Nilrobacter
Oxidation state of nitrogen:: +5
+5 +"6::'1
Second stage of nitrification.
Within this simplified step the oxidation state of the nitrogen goes from +3 in the nitrite to +5 in the nitrate. This has involved the donation of electrons from the nitrogen atom (or oxidation). Again oxygen acts as the electron acceptor.
This reaction proceeds through the action of a group of bacteria, commonly referred to as Nitrobacter. These bacteria are also chemoautotrophic. As with the previous stage these bacteria act as catalysts reducing the activation energy required for the reaction to occur.
approximately 4.3 mg of O2 is required for the oxidation of each mg of ammonia nitrogen to nitrate nitrogen. In a biological treatment process additional oxygen would be supplied (by aeration) to the wastewater for these reactions. The research of Painter (1977) found the DO concentration for nitrification should be higher than 2.0 mg/L for nitrification to occur without the availability of oxygen being rate limiting to the process. Bliss and Barnes (1986) found that nitrification ceased to occur at residual DO concentrations below 0.2 mg/L ..
It should be noted that the nitrification steps described in equations 1.2-1 and 1.2-2 do not facilitate nitrogen removal from the wastewater but they do eliminate its oxygen demand. However the nitrogen is now in the form of nitrate nitrogen (N03-N). To remove nitrogen another step called denitrification is required.
1.3 DENITRIFICATION
thought that the electron transfer pathway for the transfer of electrons from organic material to the electron acceptor is similar regardless of whether oxygen or nitrate acts as the final electron acceptor (Christensen and Harremoes (1977) and Haandel et al (1981 )).
A simplified illustration of the denitrification reaction is shown in equation 1.3-1.
Equation 1.3-1 Simplified illustration of denitrification reaction.
The last three compounds are gaseous products (nitrogen monoxide or nitric oxide, di-nitrogen oxide or nitrous oxide, and nitrogen gas) that are released to the atmosphere.
The simplified denitrification reaction shown in equation 1.3-1 can be illustrated in an example-using methanol as the carbon source as shown in equations 1.3-2, 1.3-3, and 1.3-4. Equations 1.3-2 and 1.3-3 show the energy creation and growth components of the denitrification reactions with methanol while equation 1.3-4 shows the overall combination of the two reactions (Metcalf and Eddy, 1991). Example, Denitrification (using methanol as the carbon source)
6NOJ - +2CHPH -+6N02 - +2C01 +4H20
6N02 - +3CH30H -+ 3N2 +3COa +3H2
0+60H-/
Oxidation stale of nitrogen = +5
'5 +"61:'1
1
Oxidation stale of carbon:: " 2
'2 + '3 + '2 + +1 1: 0
\
~
""dot'" ... of Mm, ... 0Oxidation state of carbon = +4
+4 +"4:: 0
Equation 1.3-3 Biosynthesis reaction
N03- +l.08CHPH +H+ -+O.065CsH7N02 +0.47N2 +O.76C02 +2.44H20
Equation 1.3·4 Overall reaction
Note in equation 1.3-2 that the oxidation state of nitrogen goes from +5 to O.
Therefore the nitrogen atom has accepted electrons or has been reduced. The
electrons have come from the organic carbon source. Note also the oxidation
state of the carbon has gone from -2 to +4 i.e. it has donated electrons or has
been oxidized.
Until recently denitrification within the wastewater treatment environment was
considered as being exclusively anoxic. However it has been found that (under
certain conditions) denitrification can occur in aerobic environments. This
phenomenon has been called aerobic denitrification.
1.4 AEROBIC DENITRIFICATION
Aerobic denitrification other wise known as simultaneous or co-current
nitrification and denitrification (SND) (co-N/DN) implies that nitrification and
denitrification occur simultaneously in the same treatment reactor under identical
environmental conditions.
Aerobic denitrification has attracted the interest of wastewater treatment plant
designers and operators because it offers
1. Potential to save on a second anoxic tank either by a reduction or by the
elimination of the need for anoxic facilities
2. May result in a reduction in the treatment time required for a nitrification
3. Potential advantages in terms of energy savings by reducing the aeration requirements required for the oxidation of ammonia nitrogen
4. Potential advantages in terms of reducing the need for variable anoxic/aerobic zones and the associated energy requirements
5. Potential "biological" as well as conventional energy savings. For example, research by Helmer and Kunst (1998) and Stross (2000) suggests that under certain conditions the micro-organisms responsible for aerobic denitrification may be autotrophic. Other research Third (2004) suggests that under certain conditions aerobic denitrification may be undertaken using stored intracellular carbon. If either of these claims are true the need to supply a readily degradable organic carbon source (as a source of electrons/energy) for denitrification may be reduced or overcome. This may allow a reduction in the quantity of flow recycled or the need for an additional external carbon source.
Pontiac Michigan in which full-scale aeration tanks reported total nitrogen reductions of 30%.
Other early reports of the existence of aerobic denitrification activity include Moriyama et 81 (1990) who demonstrated aerobic denitrification in biological contactor units and Masuda et 81 (1991) and Gupta et 81 (1994) who demonstrated aerobic denitrification in fixed film RBC units. Halling et 81 (1992) demonstrated aerobic denitrification within up flow fixed bed reactors and Watanabe et 81 (1992) and Munch et 8/ (1996) who demonstrated the phenomenon within sequencing batch reactors.
There have been various explanations for the mechanisms by which nitrogen is reduced within aerobic treatment systems to nitrogen gas. These explanations sL1ggest aerobic denitrification is the result of either a biological or a physical phenomenon. It is possible that a number of different processes all contribute in some way to the reduction of oxidized ammonia.
1.4,1 BIOLOGICAL EXPLANATIONS AEROBIC
Biological explanations include microorganisms continuing to use nitrogen after an anoxic phase, microorganisms simultaneously using oxygen and nitrate as receptors, inhibition of oxygen respiration by nitrite resulting in the use of NOx-I\l, that traditional BNR theory is too simplistic, and the physiological variety of microorganisms is greater then previously thought.
the denitrifying enzymes of some bacteria were inactivated by oxygen, while in others, synthesis was suppressed, but the existing enzymes disappeared only gradually meaning it might be possible for some denitrifiers to continue denitrifying after an increase in DO concentration. Munch et al (1996) suggested that heterotrophic bacteria coming from the anaerobic/anoxic phase might for a limited period still produce enzymes that use NOx-N as a final electron acceptor even though readily available dissolved oxygen is present. Patureau et al (2000) also identified improved aerobic denitrification activity just after an anoxic period and suggested it was due to the "expression of" enzymes synthesized during the anoxic period.
However there have been many instances of the existence of aerobic denitrification in systems that do not contain anoxic or anaerobic environments. Thus while these explanations cannot be ruled out it is now clear that there are also other mechanisms involved. Another explanation for the aerobic nitrogen reduction is the suggestion that it might be possible for some microorganisms to simultaneously use oxygen and nitrate/nitrite as electron acceptors in the oxidation process (Zhao et al (1999».
(1991) have suggested a possible inhibition of oxygen respiration by nitrite,
resulting in the use of NOx-N as an electron acceptor.
When aerobic denitrification is active the [NOTN] is often elevated (Hayward
(1998), Yoo et al (1999)). This is unusual as the traditional two stage nitrification
process is usually rate limited by the oxidation of NH3-N to N02-N resulting in the
rapid conversion of N02-1\I to N03-I\I, (and a distinct absence of
detectable/measurable N02-N). The higher levels of N02-N suggest the second
step of nitrification (nitration undertaken by Nitrobacter) may be inhibited.
Free ammonia or elevated pH levels have been known to inhibit Nitrobacter,
other inhibitors include reduced temperatures, operating solids content, and
acute process loadings (Anthonisen et al (1976), Alleman (1984), Abeling and
Seyfried (1992), Ballmelle et al (1992), Rhee et al (1997), Yu et al (1998)).
A number of researchers have proposed that nitrogen removal may take place
via a shortened nitrite pathway. In some instances this is accompanied by
elevated nitrite concentrations. For example Pochana and Keller (1999)
conjectured that elevated N02-N levels experienced in the aerobic denitrification
process may be linked to reduction of nitrogen directly from the N02-N form.
They found that when nitrification activity in the aerobic denitrification process
was inhibited nitrite was not further oxidized to nitrate even after ammonia
oxidation was complete. They proposed this situation accompanied a shortened
nitrogen removal pathway with the reduction of N02-N directly to nitrogen gas.
Kim et al (2003) demonstrated aerobic denitrification within a biofilm airlift reactor
operated specifically under conditions in which low dissolved oxygen created
Nitrobacter inhibition. Biological nitrogen removal via the nitrite pathway was
also demonstrated by Strous et al (1997). He identified a bacterium belonging to
the Planctomycetes group called ANAMMOX (acronym for Anaerobic Ammonium
acceptor (converting it to dinitrogen gas and trace amounts of nitrate). The ammonium was converted to dinitrogen gas and small amounts of nitrate. Stross (2000) found that ANAMMOX bacteria can be active in the aerobic denitrification process and that under conditions of low dissolved oxygen can reduce nitrite directly to dinitrogen gas. He found that under conditions of low dissolved oxygen concentration traditional nitrifiers such as Nitrosomonas and Nitrosospira could work cooperatively with ANAMMOX bacteria. That is nitrification was limited to the production of nitrite by Nitrosomonas and Nitrosospira which was then simultaneously reduced. This is a completely autotrophic process which Dijkman and Strous (1999) named CANON (an acronym for Completely Autotrophic Nitrogen-removal Over Nitrite). The CANON process can be considered in two stages which occur simultaneously, first the oxidation of ammonium to nitrite (equation 1.4-1) and the reduction of nitrite to nitrogen gas (equation 1.4-2). The combined reaction is illustrated in equation 1.4-3.
Equation 1
+ +H 0
2
Half step nitrification reaction under low dissolved oxygen conditions
NH/
+
1. 3 N02 ~ N2 +O.13N03- +2H20Equation 1.4-2 Anammox mediated reaction
Equation 1.4-3 CANON reaction - Autotrophic removal of nitrogen under aerobic denitrification conditions
formed) and Abeling and Seyfried (1992), Yang and Alleman (1992), Akunna et al (1993), Ho (1994), Helmer and Kunst (1998), Gejlsbjerg et al (1998), and Yoo
et al (1999) who identified coupled NH/-N oxidation and N02-N reduction as an
important source of N20 production under nitrifying conditions in activated sludge.
From the mid 1980's it was also found that nitrate may be reduced under certain aerobic conditions in place of oxygen. Poth (1986), Abeliovich and Vonshak (1992), and Bock et al (1995) found that under oxygen limiting conditions some autotrophic nitrifiers were able to reduce nitrate or nitrite into nitric and nitrous oxide and nitrogen gas. More recently Patureau et al (1996a) demonstrated co-respiration of oxygen and nitrates through kinetic experiments.
The use of nitrate nitrogen as an electron acceptor (in place of oxygen) may also be considered from a thermodynamic perspective. The potential energy available to microorganisms from the transfer of electrons depends upon several variables
including the final electron acceptor. The free energy change (peo) between the
-2
use of 02' N03-N, and S04 shows the free energy change available through the use of oxygen is only slightly higher than when N03-1\J is used. This might suggest the 02 electron acceptance pathway is only slightly preferred over the N03-N pathway (i.e. the additional energy available to microorganisms through
the use of 02 as opposed to N03-N may not be that significant). The peo values
-2
for 02' N03-N, and S04 respectively are +21.5 , +21, +5.75 (Snoeyink and David (1980)).
denitrification theory is too simplistic, and some previously identified organisms have a more complex respiratory system than was initially recognized.
In recent years some researchers have suggested the physiological variety of microorganisms involved in biological wastewater nutrient transformation is greater than previously thought. For example Drysdale et al (1999) undertook an investigation into the microbial species responsible for denitrification in activated sludge processes and found the microbial consortium was so diverse that he recommended further research to identify constituent bacteria. Delgenes and Patureau (2004a) while investigating the ability of M. aerodenitrificans to nitrify and aerobically denitrify attempted to isolate other aerobic denitrifiers, they found many aerobic denitrifying strains. Frette et al (1997) isolated one hundred and sixty-nine bacterial strains from an alternating aerobic/anaerobic activated sludge wastewater treatment basin. They found sixteen strains from a sub sample of 23 nitrogen oxide reducers were true respiratory denitrifiers, and all denitrified under both anaerobic and aerobic conditions.
identified heterotrophic microorganisms able to both nitrify in aerobic
environments and denitrify in both aerobic and anoxic environments and Zhao et
al (1999) found that heterotrophic nitrification could contribute a significant
fraction of ammonia oxidation under favorable conditions, such as low dissolved
oxygen concentration and relatively high organic loading. It was suggested that
autotrophic nitrifiers became inhibited under these conditions. The presence of
autotrophic denitrifiers has also been demonstrated Poth (1986), Abeliovich and
Vonshak (1992), and Bock et al (1995). They identified autotrophic denitrifiers
able to reduce nitrate or nitrite into nitric and nitrous oxide and nitrogen gas
under conditions of low dissolved oxygen concentration.
Since the mid 1980's it has also become evident that some of the previously
identified BNR species have a more complex respiratory system than was initially
recog nized. For example Robertson and Kuenen (1984) and Lloyd et al (1987)
demonstrated how traditional nitrifier species such as Nitrosomonas eutropha
and Nitrosomonas europea were able to denitrify in the presence of small
amounts of oxygen.
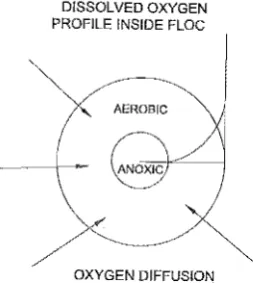
1 PHYSICAL EXPLANATION DENITRIFICATION
Another explanation is that aerobic denitrification results from anoxic micro zones
inside activated sludge flocs (Rittmann and Langeland (1985), Metcalf and Eddy
(2001 ». This theory suggests that aerobic denitrification is a physical
phenomenon that can be explained using the traditional concepts of autotrophic
nitrification on the exterior of sludge flocs and heterotrophic denitrification using
adsorbed organic carbon within an anoxic micro zone at the centre of the sludge
floc. The corner stone to this theory is the belief that denitrification could occur
within flocs due to a dissolved oxygen concentration gradient within the floc as
DISSOLVED OXYGEN PROFILE INSIDE FLOC
Y-:;:,
--~-
\ANOXIC [image:26.595.223.350.119.261.2]/K--
OXYGEN DIFFUSIONFigure 1.4-1 Schematic of possible dissolved oxygen profile within rnicrobial floc
(Adapted from Pochana and Keller 1999),
Typical floc sizes within the activated sludge process were found to range from
5-200 IJm in diameter by Andreadakis (1993), 10-70 IJm by Pochana and Keller
(1999), and 50-110 IJm Third (2004). The floc diffusion theory was tested by
Pochana and Keller (1999) who illustrated that a reduction in median floc size
from 80 to 40 IJm by high speed blending of the biomass before a cycle resulted
in a reduction in aerobic denitrification nitrogen losses from 52 to 21 %. This
occurred while nitrification rates remained constant suggesting that the drop in
aerobic denitrification was not due to blending operations affecting the viability of
the biomass. The studies suggested that floc size may play an important part in
aerobic denitrification activity. Pochana et al (1999) also developed a
mathematical model to simUlate internal floc diffusion mechanisms and found
that while the outer part of flocs had a DO level above 0.2 mg/L (thereby
reducing denitrification activity) the central sections of flocs had considerable
time with virtually no DO providing an environment suitable for anoxic reduction
to occur. This finding supported the theory that aerobic denitrification may be
partly attributed to traditional denitrification within sludge flocs.
From a full-scale perspective it has been reported that the Potsdam wastewater
internal floc denitrification. Demoulin et al (2001) illustrated how the plant used
online measuring of the specific oxygen uptake rate to control the aerobic
denitrification process. Typical floc profiles were as illustrated in Figure 1.4-2.
They found the rate of nitrate diffusion into the floc was on the order of ten times
that of oxygen, thus under aerated conditions there was no nitrate limitation
within the floc. They also reported that sufficient carbon provision for
denitrification was achieved through carbon storage (biosorption) and the control
of dissolved oxygen which minimized the use of substrate carbon by oxic
metabolism.
NITRIFICATION
DENITiR
I
IFICATION
Figure 1.4-2 Representative view of sludge floc under a microscope with
suggested zones for nitrification and denitrification. (Adapted from Demoulin et al
(2001)).
Heinen and Norgaard (1998) reported on the application of floc diffusion theory to
the full-scale "Symbio process". The Symbio process is a nitrogen removal
technology which has been developed on the basis of using dissolved oxygen
concentration gradients within microbial flocs, The process attempts to maintain
aerobic and anoxic zones within flocs through the control of a number of
The floc oxygen diffusion theory may be indirectly supported by a number of researchers (refer discussion 5.4) who have suggested the optimum dissolved oxygen concentration for aerobic denitrification would be around 0.5 mg/L. The general consensus is that the process has an upper limit of around 1.0 mg/L and an optimum just under 0.5 mg/L. It should be noted these are theoretical values, a review of the literature found no research that has experimentally determined the optimum dissolved oxygen concentration range for the aerobic denitri'fication process.
However the floc diffusion explanation has also been questioned by a number of researchers including Helmer and Kunst (1998) who achieved significant aerobic denitrification nitrogen losses in a reactor (with dilute mechanically homogenized biomass) in which large cell clusters were eliminated ensuring all cells were supplied equally with DO during batch tests. The earlier research of Kugleman et al (1991) also creates some doubt as to the degree of nitrogen loss that can be
were of 1 to 2 orders of magnitude higher than those in the middle and bottom layers. From this they suggested the surface layers had a higher denitrifying activity. They also found aerobic denitrification was active at dissolved oxygen concentrations up to 6 mg/L.
It is clear that to date, no definitive explanation for the loss of nitrogen under aerobic conditions has been agreed upon. It is likely that aerobic nitrogen losses may be the result of a number of mechanisms such as biological conversion by a broad range of microorganisms under a range of conditions, as well as traditional biological conversion resulting from a physical phenomenon such as anoxic micro zones contained within flocs. As to the debate over the conditions required for aerobic denitrification the generally accepted consensus is that aerobic denitrification is principally a low dissolved oxygen concentration process (:::; 1.0
mg/L), the optimum dissolved oxygen concentration range for aerobic
denitrification has not been determined experimentally. The requirements for organic carbon remain unclear.
The measurement of biochemical parameters such as dissolved oxygen and pH is important for control and monitoring of the nitrification, denitrification, and aerobic denitrification processes, this is typically achieved using insitu probes.
1 OPERATION OF PROBES
1.5.1 OXIDATION REDUCTION POTENTIAL (ORP)
ORP cannot be determined experimentally, rather it is always measured using an
ORP probe. The measurement of ORP allows the ratio of oxidants to reductants
prevailing within a solution to be established. The actual redox potential of a
solution may be considered as the tendency to give up or take up electrons (Le.
to be oxidized or reduced).
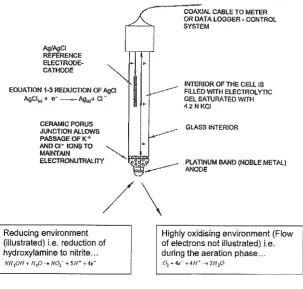
The ability of a solution to give up or take up electrons can be measured by
immersion of a platinum electrode along with a reference electrode (such as
Ag/AgCI). Figure 1.5-1 provides an illustration of an ORP probe and its
components. When the probe is immersed into a solution the flow of electrons (in
an attempt to create an equilibrium) results in a measurable millivolt difference
between the two electrodes.
AglI'(JCI REFERENCE ELECTRODE-CATHODE
EQUATION 1-3 REDUCTION OF Agel
AgCI!,) + e- _ ~+
a-CERAMIC PORUS JUNCTION ALLOWS PASSAGEOfK+
AND Cl- IONS T O " ..
COAXIAL CABLE TO METER OR DATA LOGGER - CONTROL SYSTEM
INTERIOR Of THE CELL IS FILLED WITH ELECTROLYTIC GEL SATURATED WITH 4.2 NKCI
GLASS INTERIOR
MAINTAIN ' "
ELECTRONUTRALITY 0" :::...--- PlATINUM BAND (NOBLE METAL) ANODE
/ \
Reducing environment (illustrated) Le. reduction of hydroxylamine to nitrite ...
NH,OH + H,O .... NO,- +5H+
+4.-Highly oxidising environment (Flow of electrons not illustrated) i.e. during the aeration phase ...
[image:30.595.141.445.393.682.2]0, ~ 4,-+4H' -> 2H,0
To illustrate, within a denitrification process, there is a lack of freely available dissolved oxygen. Organic material within this environment is continuously subjected to degradation by redox reactions catalyzed by enzymes. The organic material is oxidized in that it donates electrons and these electrons are accepted by nitrate nitrogen which is itself reduced to nitrogen gas. When an ORP probe is in this solution some of the electrons from the oxidized organics will gravitate along the platinum wire to the electrode (cathode) since the Ag/AgCI reference electrode has a large positive electrode potential. The flow of electrons will cause the Ag/AgCI to be reduced forming solid silver and free chloride irons. In this environment when the flow of electrons is from the solution to the reference electrode the recorded ORP value will be negative. Thus a reducing environment (I.e. during an anoxic phase) will cause the ORP mV reading to fall or have a negative slope over time (BIOLAB Scientific (2003)).
When oxygen is present in solution the oxygen has a larger positive potential than the reference Ag/AgCI electrode. That is the electrons from the oxidation of materials such as organic carbon and ammonia which would have traveled to the reference electrode wi" instead travel to the oxygen (and reduce the oxygen to water). Thus material such as organic carbon and ammonia nitrogen are oxidized and donate electrons while oxygen is reduced or accepts electrons. In addition the oxygen has a greater attraction for electrons than the probe's Ag/AgCI electrode and this results in a flow of electrons from the electrode to the oxygen in solution. When the flow of electrons is from the reference electrode to the solution the recorded ORP value will be positive. Thus an aerobic environment (I.e. during an aeration phase) wi" cause the ORP mV reading to increase or have a positive slope over time (BIOlAB Scientific (2003)).
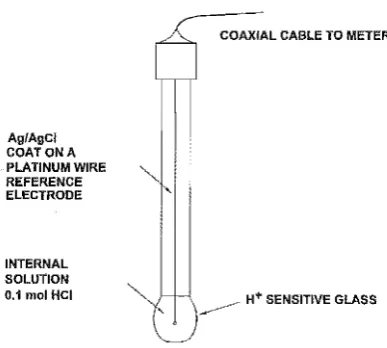
1.5.2 HYDROGEN ION CONCENTRATION (pH)
composed of material such as Ag/AgCI. The probes have a thin glass (bulb shaped) membrane located at the tip. The glass membrane separates the internal HCI solution from the material being measured but allows an H+ ion exchange to take place. The electrode works by allowing hydrogen ions to exchange at the glass surface. The flow of H+ between the internal solution and the solution being measured changes the
cr
concentration in the HCI solution. This is in turn balanced by the Ag/AgCI electrode. Equation 1.5-1 illustrates the action of the Ag/AgCI reference electrode depending upon thecr
concentration in the probe HCI solution.AgCI(s)
+
e
¢:> Ag(s)+
cr
Equation 1 Action of reference electrode
AII/AgCI COATONA PLATINUM WIRE REFERENCE ELECTRODE
INTERNAL SOLUTION 0.1 mol HCI
COAXIAL CABLE TO METER
[image:33.595.196.390.136.310.2]~ H+ SENSITIVE GLASS
Figure 1.5-2 Diagram of a pH electrode
1 DISSOLVED OXYGEN CONCENTRATION [DO]
The dissolved oxygen concentration within a solution can be measured experimentally via chemical titration or alternatively using a DO probe and meter. A DO probe contains a sensor which is surrounded by KCI solution. A membrane separates the sensor from the solution being measured. Dissolved oxygen is free to pass from the solution being measured into the probes KCI solution. A DO meter is able to take a reading by passing a polarizing voltage across the sensor, this causes oxygen which has passed throUgh the membrane to react at a cathode causing a current to flow. The membranes and KCI solution are disposable and usually require replacement every week if the probe is used continuously. For low dissolved oxygen measurements such as in the aerobic denitrification process thin membranes can be used which allow increased sensitivity and greater accuracy of measurement (BIOlAS Scientific (2003)).
1.6 ONLINE REAL TIME PROFILES (ORT PROFILES)
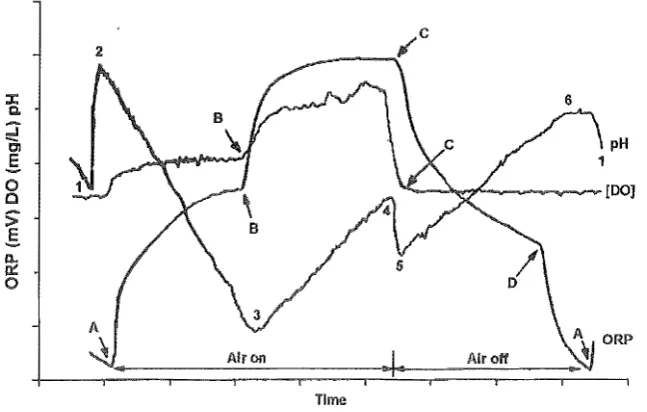
The present research used four online parameters, these were oxidation reduction potential (ORP), pH, dissolved oxygen concentration [DO], and air demand. Figure 1.6-1 illustrates a generalized schematic of the online profiles that could be expected from an AIO process treating domestic wastewater (note the air demand profile is not illustrated).
Time
pH 1
[image:34.595.129.453.266.472.2]ORP
Figure 1.6m1 Generalized schematic of ORP, pH, and DO profiles, main bending
points illustrated.
With respect to the ORP profile in Figure 1.6-1, the ORP profile has four main bending points; these are labeled A, B, C and 0 respectively, (note that bending points Band C also appear on the DO profile).
At point A the air is switched on which causes the ORP to change from a negative (downward facing) slope to a positive slope, (Le. as discussed in section 1.5.1 electrons start flowing from the ORP electrode to the oxygen in solution). The strong attraction of oxygen for electrons results in an interrelationship between the ORP and DO profiles. ORP is linked to dissolved oxygen concentration (or any electron acceptor/donor for that matter) by a logarithmic relationship (Paul et al (1998». Thus the change in ORP is not proportional to electron acceptor concentration but the log of its concentration. This means that large changes in concentration result in small changes in redox potential (Mosey (1985».
The logarithmic relationship between the dissolved oxygen concentration and ORP allows the bending point B on the ORP profile to be used to indicate whether the aeration rate is appropriate for the oxygen demand. That is the appearance of the ORP bending point typically indicates the oxygen supply rate is suited to the oxygen requirements at that time. Under aeration will result in the dissolved oxygen not breaking through in the aeration time of the process (which means point B does not appear) while over aeration will also result in Point B not appearing on the ORP profile. The absence of point B can also indicate problems with the nitrification process, such as nitrification inhibition (Paul et 81 (1998)).
Once aeration is terminated the dissolved oxygen concentration starts to fall rapidly as biological activity consumes the remaining residual dissolved oxygen. Once the freely available dissolved oxygen is fully depleted the system makes the transition from using dissolved oxygen to using chemically bound oxygen, that is the system goes from aerobic to anoxic activity. At the point where the system becomes anoxic the ORP changes from a relatively level plateau to a steep negative slope (illustrated in Figure 1.6-1 as point C). The flow of electrons changes due to the shift to a reducing environment, that is electrons start flowing to the ORP cathode. It should be noted that this part of the ORP profile effectively represents the actual respirometric activity of the sludge and ORP will decrease strongly only when dissolved oxygen has been consumed completely (Zipper et 81 (1998)).
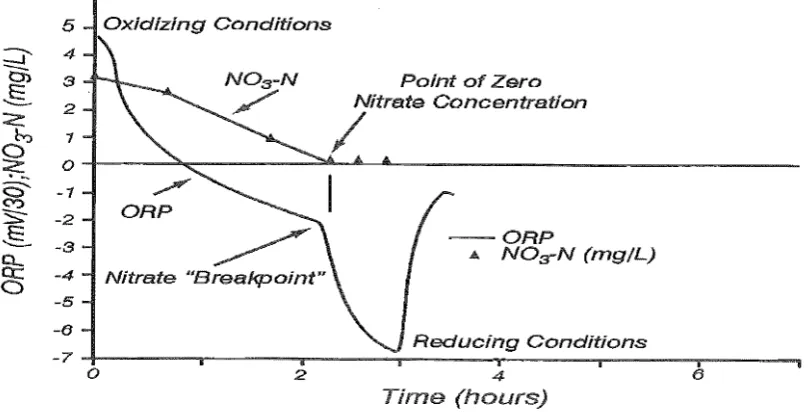
anaerobic conditions results in a nitrate breakpoint feature (Peng et al (2002), Cecil (2003)). This is Illustrated as point 0 on Figure 1.6-1 and also in more detail in Figure 1.6-2. The nitrate breakpoint feature is often called the "nitrate knee" and it signals the point where the denitrification reaction is complete (i.e. all nitrates have been eliminated).
5
:::::J' 4
c::n
:3~ 2 <:
h 1
~
.
-
0<3"
("'j -1
"S;:- -2
~ -3
&:
0 -4 -5
-6
-7
0 2
Point of Zero Nitrate Concentration
/
- - O R P
A NOs-N (mg/L)
Reducing Conditions
4 (hours)
[image:37.595.94.500.229.435.2]6
Figure 1.6-2 Typical ORP vs time profile showing nitrate breakpoint (adapted from Wareham et al (1993))
Points Band D (Figure 1.6-1) are of particular interest to those working with online real time systems as they represent the points at which nitrification and denitrification (respectively) are complete. Identification of these points can potentially allow treatment sequences to be terminated resulting in benefits such as savings in aeration, greater treatment capacity, and improved process stability.
is thought to be due to CO2 stripping from the system caused by the initiation of aeration (Hao and Huang (1996)). After the initial increase the pH decreases again (points 2-3), as nitrification consumes alkalinity as part of the nitrification process (7.14 mg HC03 consumed per mg of ammonia). At point 3, the pH curve shows the feature termed "ammonia valley" (Andreottola et al (2001)) Point 3 occurs when ammonia is essentially depleted (and nitrification is complete), note that point 3 corresponds to point B on the ORP profile.
Following the ammonia valley at point 3 continued aeration will result in an increase in the pH (points 3-4). Hao and Huang (1996) found that the mechanism behind this increase in pH was complex and not fully understood. They suggested it may be caused by the hydrolysis (or cleavage of organic nitrogen molecules with water) of organic nitrogen after the exhaustion of the ammonia.
For a short period following the termination of aeration the pH can fall. This occurs as the stripping of CO2 from the system (caused by aeration) ends and
there is an increase in the CO2 concentration (points 4-5) which may occur until
anoxic conditions develop. Once the conditions are anoxic the pH increases again as alkalinity (consumed during nitrification) is partially released back into the environment (points 5-6). The increase in pH occurs until denitrification is complete, i.e. all nitrates have been reduced to nitrogen gas. At this point there is a pH breakpoint commonly referred to as the "nitrate apex", (point 6) (Peng et al (2002)). The nitrate apex is related to the ORP "nitrate knee" in that it signifies the pOint at which all nitrates have been depleted and the system makes the transition from anoxic to anaerobic conditions.
most common of which is acetic acid. The breakdown of products into organic
acids results in the fall in pH observed between points 6-1.
Points 3 and 6 are of particular interest to those working with online real time
systems as they represent the points at which nitrification and denitrification
(respectively) are complete. As with the ORP features the identification of these
points can potentially allow treatment sequences to be terminated resulting in
benefits such as savings in aeration, greater treatment capacity, and improved
process stability.
1.7 APPLICATION OF ONLINE PARAMTERS
Stricter wastewater effluent requirements and issues such as conservation of
energy and a limitation on the available area for treatment facilities has
emphasized the need for incorporating new technology into wastewater
treatment processes in order to increase their performance (Peng et al (2002)).
The move towards greater efficiency may be considered both in terms of greater
pollutant removal but also in terms of regulating plants to ensure optimum
performance in terms of real time pollutant concentrations and hydraulic loads,
that is to minimize inefficiencies caused by plants designed for operation at a
static design load (Risholt et al (2002), Baeza et al (2002)). In the last few
decades the establishment of intemational commissions has resulted in the
implementation of new wastewater treatment regulations within the European
Union (EU). These regulations have drastically increased the need for real time
monitoring systems within European wastewater treatment plants (Gunatilaka
and Dreher (2003)). Regulatory authorities are now frequently requiring biological
nutrient removal (BNR) strategies to be implemented at wastewater treatment
facilities, for example new regulations within parts of the EU require nitrogen
removal as a treatment objective. Common nitrogen removal requirements (such
as those required in Austria) include 60-70% nitrogen removal (BGBI 210/1996)
There is also a growing need within the EU for improved online real time control systems to monitor and control pollution in rivers and water bodies into which treated wastewater is discharged, that is to monitor and take into account pollutant emissions when determining control strategies for minimizing the impact of compounds such as ammonia nitrogen on urban water bodies (Meirlaen ef al (2002), Frehmann ef al (2002». Online real time control strategies are a way of achieving the new treatment objectives and facilities such as new BNR plants offer the opportunity to incorporate real time control as part of the plants ICA system (Cecil (2003».
pH is an established form of online measurement often used in the wastewater treatment industry to pinpoint the end of nitrification by identifying the ammonia depletion breakpoint (AI-Ghusain ef al (1994), AI-Ghusain and Hao (1995), Ra ef al (2000), Andreottola ef al (2001
».
ORP is also an established form of online measurement used to pinpoint the end of denitrification «Koch ef al (1985), Wareham ef al (1993), Yu ef al (1997a), Charpentier ef al (1998), Yu ef al (1998), Peng ef al (2002), Cecil (2003».ORP measurement was first used in wastewater treatment from the early 1940's following the development of practical ORP electrodes for this application (Rohlich (1948)). However with the subsequent development of the dissolved oxygen electrode engineers and plant operators lost interest in redox (Cecil (2003)). Interest in ORP was revived when nutrient removal became an objective in the 1980's (Koch (1985)). Nutrient removal required the inclusion of treatment phases in which no dissolved oxygen was present. The profiles from pH, and ORP can operate in anoxic and anaerobic conditions and have the capacity to provide useful information under these conditions with respect to nitrogen transformation and removal. This is primarily because in low dissolved oxygen and/or anoxic-anaerobic environments significant changes in pH and redox potential can occur while conventional control parameters such as the dissolved oxygen probe may show little or no change.
The use of the ORP profile in aerobic-anoxic-anaerobic conditions is illustrated in Figure 1.7-1. The figure shows aeration/non-aeration phases of an AlO type BNR plant. From the start of aeration the ORP profile increases steadily until aeration is terminated after which the ORP decreases. While the operating range of the dissolved oxygen probe stops when the dissolved oxygen is depleted the ORP profile continues providing information during the anoxic-anaerobic reducing conditions. pH and ORP have now become promising contenders for the automated control of process trains that incorporate a micro/non-aerated zone.
Aeration On
r::==::::J. __
...r:==L.._J:====L ___
.L Off 1'""Relative Oxygen
Concentration ¥---I-_...L.~_.L-_ ... ~_..L _ _ _ ~
ORP
Time (hours)
The use of pH and or ORP profiles for control purposes requires the online data to be analyzed so that process control decisions can be made. Specific profile features are correlated to known biochemical events, when these profile features appear their detection by a control system provides an indirect way of identifying when the biochemical event has occurred. Control decisions can be based upon either the use of set point (absolute) values (that is using set points at which the event is thought to occur) or relative values. Relative values involve measurement of the profile slope so that changes in slope can be used to identify the feature.
Profile features may be considered relative in the sense that different probes may show the breakpoints (features) occurring at different absolute values due to irregularities in the mixing regime, individual probe characteristics, and localized oxidation-reduction reactions occurring in the vicinity of the tip of the probe (ORP). However most probes will tend to show the breakpoints occurring at the same moment in time.
Initial concerns regarding the usefulness of ORP measurements in biological systems Stumm (1966), Morris and Strumm (1967) and Harrison (1972) have been alleviated in light of the knowledge that the emphasis in some situations can be transferred from the absolute ORP value to the relative ORP value (Le. the ORP variation with time or dORP/dt).
The use of relative ORP variations to monitor nutrient depletion has been demonstrated by numerous researchers including Charpentier
et
al (1989), Peddieet
al (1990), Warehamet
aJ (1994). Paulet
aJ (1998), and Raet
al(2000). For example Ra
et
al (2000) operated a two stage sequencing batchor derivative of the ORP profile has also been employed in some modern process control systems and aspects such as the nitrate knee are now being regularly detected by on-line systems which use the information in real time to make changes to the process control (Le. initiation or termination of aeration). For example, the recent adoption of the nitrate knee in the Zullig ORP control system is reported to provide savings in energy of up to 30% over a strictly timer-based system (Water and wastes in NZ (1997)).
The use of relative pH or pH and ORP variations to monitor nutrient depletion has also been demonstrated by numerous researchers including AI-Ghusain and Hao (1995), Yu et al (1997), Kim and Hao (2001), and Peng et al (2003). For example Peng et al (2003) investigated the variation of pH with time during a nitrification process treating brewery wastewater. They attempted to use the pH ammonia valley to determine the point of ammonia depletion. Kim and Hao (2001) operated an alternating aerobic-anoxic continuous flow activated sludge process and used relative pH to detect the point of ammonia depletion via the ammonia valley and relative ORP to detect the point of nitrate depletion via the nitrate knee.
Aspects such as the application of online parameters for monitoring and possibly control of the aerobic denitrification process, the optimum dissolved oxygen concentration, and the requirements for organic carbon are some areas that require further research and clarification.
1.8 PROJECT NEED, OBJECTIVES, AND METHODOLOGY 1.8.1 PROJECT NEED
how ORP measurement and its rate of change throughout a cycle could successfully control dissolved oxygen set points as well as optimize nitrogen and phosphorus removal in a full-scale aerobic denitrification sequencing batch reactor facility, Holman (2000) who investigated online ORP and DO profile features within the aerobic denitrification process and highlighted possible features for process control, and Third (2004) who used online OUR measurements as a process control parameter for the aerobic denitrification process.
A review of the literature suggests there is still a need to experimentally determine the optimum dissolved oxygen concentration for the aerobic denitrification process. It is likely the optimum dissolved oxygen concentration for
aerobic denitrification will not be a fixed value but an optimum range dependent upon variables such as the wastewater composition and the biomass concentration.
The requirements for organic carbon in the aerobic denitrification process needs to be clarified. For example the removal of nitrogen via autotrophic denitrification (including aerobic denitrification) was identified in 2002 as an area that requires further research by WG 4 biological processes (working group 4) a division of COST (European cooperation in the field of scientific and technical research) (Cost (2003)).
1.8.2 PROJECT OBJECTIVES
investigate opportunities for several types of real time control (ORP, pH, DO, and
airflow).
To achieve this the experimental work had the following specific objectives:
1. Confirm the presence of aerobic denitrification activity
2. Elucidate some operational aspects of aerobic denitrification, in particular
comment on the nitrification, denitrification, and sludge production rates
3. Comment on the requirements for air relative to conventional separate
stage nitrification denitrification processes
4. Identify the dissolved oxygen conditions necessary for aerobic
denitrification and for its optimisation
5. Comment on the need for soluble organic carbon for the removal of
nitrogen in the aerobic denitrification process
6. Confirm if the online profiles have unique features with respect to the
aerobic denitrification process, in particular the ammonia elbow on the
ORP profile and the ammonia valley on the pH profile. Correlate these
online features with measured biochemical events such as the depletion of
organic carbon or ammonia nitrogen
7. Develop and demonstrate control algorithms that use online features to
control the aerobic denitrification process, (Le. indirectly detect the
biochemical events). In doing so demonstrate the reliability of pH and
ORP control algorithms based upon relative rather than absolute values
1.8.3 PROJECT METHODOLOGY
Lab scale sequencing batch reactors were operated treating domestic
wastewater under conditions likely to produce nitrification and aerobic
An intensive chemical parameter testing program (series of track studies) was undertaken along with on-line monitoring of ORP, pH, DO, and air demand to provide real-time analysis of process conditions. Specific cycles were singled out for intensive testing of parameters such as COD, TN, NH3-N, N02-N and N03-N.
Samples for each of the parameters were taken periodically throughout a cycle. The track studies provided an indication of the presence of aerobic denitrification activity (in the event that a loss of NH3-N occurred without a corresponding increase in N02-N or N03-N, once nitrogen assimilation had been considered).
Following the confirmation of the presence of aerobic denitrification activity, its performance was monitored as the operational dissolved oxygen concentration was decreased.
The automatic collection of probe readings at intervals of up to sixty seconds provided real-time profiles rich in information. The outputs from the probes were used for analysis of both trends and specific biological events.