Application of Time-Scale
Techniques to Detection of
Epileptiform Activity in the EEG
Hansjerg
Golz,
DipPhysics
A thesis presented for the degree of
Doctor of Philosophy
in
Electrical and Electronic Engineering
at the
University of Canterbury,
Christchurch, New Zealand.
2 B FEB ZOOl
ABSTRACT
Epilepsy is a neurological disorder for which the electroencephalogram (EEG) is the most important diagnostic tool. Detection of interictal (between-seizure) epileptiform activity in the EEG is, however, complicated by various artifacts and spike-like transient waveforms in the normal background EEG. Approaches to the automatic detection of epileptiform discharges (EDs) require sophisticated signal analysis methods.
We have developed a new system for the detection of EDs spikes, sharp waves, and spike-and-wavecomplexes in the EEG. It is based on the continuous wavelet transform (CWT) and incorporates statistical pattern recognition and 3D spatial source analysis.
Wavelet-based approaches to signal analysis include the discrete wavelet transform (DWT) , the CWT, and matching pursuit. Both DWT and CWT are based on a prototype filter, defined by a wavelet function applied at various scales, that can lead to accurate localization in both the time and frequency domains. Wavelet-based methods are more appropriate for the analysis of non-stationary signals - such as the EEG than the more conventional standard and short-time Fourier transforms. Both the DWT and CWT1 have been applied previously to the spike detection problem but the CWT with a complex-valued wavelet is considered superior due to translation-invariance and independence from the phase of the transient.
Statistical pattern recognition covers a wide range of classification techniques includ-ing artificial neural networks and both linear and quadratic discriminant functions. Linear and quadratic discriminant functions perform well on the separation of two non-Gaussian distributed samples from multidimensional feature spaces. In many medical diagnostic decision problems there is a large number of healthy controls but only a small number of definitively diagnosed patients. The resulting unequal sample sizes pose a problem for classification but can be counter-balanced by a bias term in the discriminant functions. An alternative interpretation of the output of discriminant functions can be gained by using a Bayesian approach to provide an additional mea-sure of confidence in the decision process.
A quasi-regular geodesic sampling grid of hypothetical current sources (dipoles) in the source space (brain volume) leads to a new paradigm for the estimation of source
iv ABSTRACT
location and source orientation. The orientation estimate forms the basis of a new characteristic spatial feature of epileptogenic spikes.
The wavelet-based system can be separated into two distinct stages. Stage 1 detects candidate epileptiform discharges (CEDs). The magnitude of wavelet coefficients of a single scale of the CWT are evaluated on a logarithmic scale to adaptively estimate the background activity. Sudden deviations from the background trigger CED detections. In Stage 2 features of CEDs are extracted from their multichannel multiscale context. Important features are derived from the multiscale edges and ridges of the CWT. A lin-ear discriminant function with a Bayesian approach is applied to obtain the probability that a single-channel transient is epileptiform. The source orientation of each CED is estimated with the dipole model and another linear discriminant function is used to estimate the spike probability of the multichannel CED. A training set of 53 EEGs (13 epileptiform and 40 normal) was used in the design and training of the system.
The system was evaluated using a test set of 53 EEGs (14 epileptiform and 39 normal). This indicated a mean sensitivity of 57.9%, a mean selectivity of 62.5%, and a mean false detection rate of 6.8 false detections per hour. Detection results compare favourably with those obtained with two other published systems (Hybrid I and Hybrid II) on the same data set. The system is sensitive to weak EDs but fails to reject artifacts in several recordings. It is considered that the system would benefit from the addition of a further stage able to make use of wide-sense temporal context of detections.
ACKNOWLEDGEMENTS
I am grateful to many people for the advice, support, assistance and encouragement they gave me during the course of my research and the preparation of this thesis.
I would like to thank my supervisors, Dr Philip Bones and Dr Richard Jones for their guidance, feedback and encouragement.
I gratefully acknowledge receipt of a University of Canterbury Postgraduate Schol~ arship.
CONTENTS
ABSTRACT iii
ACKNOWLEDGEMENTS v
PREFACE xiii
CHAPTER 1 BRAIN AND ELECTROENCEPHALOGRAM 1
1.1 Introduction 1
1.2 The Human Brain 1
1.2.1 Neurons 1
1.2.2 Principle of Operation 1
1.2.3 Neuronal Input, Processing and Output 2 1.2.4 Major Structural Elements of the CNS 2
1.2.5 Cerebral Cortex 3
1.2.6 Pyramidal Cells 3
1.2.7 Localization of Function 3
1.3 The Electroencephalogram 4
1.3.1 Origin 4
1.3.1.1 Rhythmic Activity 5
1.3.2 Recording System 6
1.3.3 Features of Brain Waves 7
1.3.3.1 Alpha Activity 7
1.3.3.2 Beta Activity 1.3.3.3 Theta Activity 1.3.3.4 Delta Activity 1.3.3.5 Gamma Activity 1.3.4 Artifacts
1.3.4.1 Muscle Activity 1.3.4.2 Sweating 1.3.4.3 Drift Artifacts 1.3.4.4 1.3.4.5 1.3.4.6 1.3.4.7 1.3.4.8 Electrode Artifact ECG Artifact
Eye Blinks and Eye Movements Electric Appliance Artifact Mains Interference
viii CONTENTS
1.4 Summary 10
CHAPTER 2 EPILEPSY AND THE SPIKE DETECTION
PROBLEM 11
2.1 Introduction 11
2.2 Epilepsy 11
2.2.1 Epileptic Seizures 11
2.2.2 Changes in the EEG 12
2.2.3 Ictal Changes 12
2.2.4 Interictal Changes 12
2.2.5 Focal and Non-focal Epileptiform Discharges 14
2.2.6 Diagnostic limitations of the interictal EEG 14
2.2.6.1 EEG Spikes in Healthy Subjects 14
2.2.6.2 Epileptic Patients without EEG Spikes 15 2.3 Automatic Detection of Interictal Spikes in the EEG 15
2.3.1 The Spike Detection Problem 16
2.3.2 Second Derivative Techniques 16
2.3.3 Zero Crossing Techniques 16
2.3.4 Mimetic Approaches 17
2.3.5 Parametric Approaches 18
2.3.6 Syntactic Approach 18
2.3.7 Approaches based on Artificial Neural Networks 19
2.3.8 Rule-based Systems 19
2.3.9 Wavelet-Based Approaches 20
2.3.10 Seizure Detection and Prediction 22
2.4 Summary 24
2.5 Objective 24
CHAPTER 3 WAVELET-BASED SIGNAL ANALYSIS 25
3.1 Introduction 25
3.2 Relationship to the Short-Time Fourier Transform 26
3.3 Discrete Wavelet Transform 27
3.3.1 Multiresolution Decomposition 27
3.3.2 Wavelets for the DWT 28
3.3.3 Daubechies Wavelet Family 29
3.3.4 Aliasing in the DWT 30
3.3.5 Symmetric, Biorthogonal and More Wavelets 31
3.3.6 Response of the DWT to Non-Dyadic Signal
Trans-lations 31
3.3.7 Wavelet Packets 31
3.4 Continuous Wavelet Transform 32
3.4.1 Wavelet filters for the CWT 32
3.4.2 Derivatives of the Gaussian 33
3.4.3 Modulation of the Gaussian 33
CONTENTS ix
3.4.5
Wavelets based on B-Splines36
3.4.6
Time-Frequency Resolution and Relative Bandwidth37
3.5
Scale and Frequency Coverage39
3.5.1
Normalization of Wavelet Coefficients39
3.6
Matching Pursuit40
3.7
Summary40
CHAPTER 4 APPLICATIONS OF WAVELET-BASED METHODS 43
4.1
Introduction43
4.2
Transient Detection43
4.2.1
Construction of a Test Signal44
4.2.2
Fourier Transform44
4.2.3
Short-Time Fourier Transform46
4.2.4
Discrete Wavelet Transform48
4.3
Continuous Wavelet Transform49
4.3.1
Normalization and Frequency Bias50
4.3.2
Multiscale Edge Extraction53
4.3.2'.1
Real Wavelet53
4.3.2.2
Complex Wavelet55
4.3.3
Ridge Tracking56
4.3.4
Distance Subtraction Method58
4.4
Matching Pursuit59
4.5
Comparison to Time-Frequency Analysis63
4.5.1
Wigner-Ville Distribution63
4.5.2
Choi-Williams Distribution65
4.6
Summary67
CHAPTER 5 STATISTICAL PATTERN RECOGNITION 69
5.1
Introduction69
5.2
Statistical Classifiers70
5.2.1
Euclidean Distance Classifier70
5.2.2
Fisher's Linear Discriminant 715.2.3
Quadratic Discriminant 715.2.4
Multinominal Classifier 725.2.5
Histogram Classifier72
5.2.6
Bayesian Approach72
5.3
Simulation73
5.3.1
Performance Indicators73
5.3.2
Simulation A: Equal Sample Sizes and Variancesof Features
75
5.3.3
Simulation B: Unequal Sample Sizes and EqualVariances of Features
76
5.3.4
Simulation C: Equal Sample Sizes and UnequalVariances of Features
76
x CONTENTS
5.4.1 Simulation Set D: Two-dimensional Gaussian
Sam-ples 79
5.4.2 Simulation Set E: Five-dimensional Gaussian
Sam-ples 79
5.4.3 Simulation Set F: Five-dimensional non-Gaussian
Samples 80
5.4.4 Receiver Operating Characteristics 80
5.5 Bayesian Probabilities 81
5.6 Summary 82
CHAPTER 6 SPATIAL ANALYSIS OF THE ELECTROENCEPHALOGRAM
6.1 Introduction
83 83 83 84 85 85 86 87 88 89 89 90 90
91
91
92 93 93 94 95 95 96 96 99 6.2 Relevant Source and Signal Spaces6.2.1 Electrode Space and Absolute Reference 6.2.2 Channel Space and Montages
6.2.3 Source Space and Electrostatic Models 6.3 Forward Solution for Four-Shell Spherical Model
6.3.1 Forward Solution for Radial Dipoles 6.3.2 Forward Solution for Tangential Dipoles 6.3.3 Implications of Forward Solutions 6.3.4 Boundary Element Models
6.4 Lead Fields 6.4.1 Direction
6.4.2 Channel-Specific Sensitivities 6.5 Inverse Problem
6.5.1 Dipole Fitting
6.5.1.1 Spatial Resolution 6.5.2 Estimation of Distributed Activity
6.6 Geodesic Dipole Model
6.6.1 Geodesic Sampling Grid 6.6.2 Montage-Specific Sensitivities
6.6.2.1 Minimum Response Orientation 6.6.2.2 Radial Orientation
6.7 Location and Orientation Estimates
6.7.1 Closest Node 99
6.7.2 Weighted Nodes 100
6.7.2.1 Optimal Choice of Parameter Alpha 100
6.7.3 Performance 101
6.8 Application in Spike Detection System 6.9 Summary
CONTENTS xi
CHAPTER 7 A WAVELET-BASED SPIKE DETECTION SYSTEM 105
7.1 Introduction 105
7.2 Wavelet Filters 105
7.2.1 Background Distribution 106
7.3 System Schematic 108
7.4 Stage 1: Transient Detection 108
7.4.1 Single-Channel Processing 109
7.4.2 Multichannel Transient Detection 111
7.5 Stage 2: Transient Analysis and Classification 113
7.5.1 Synopsis 113
7.5.2 Single-Channel Features 116
7.5.2.1 The Multichannel Multiscale Blackboard 116 7.5.2.2 Identification of Primary Channels and
Fiducial Point 116
7.5.2.3 Indicators derived from Multiscale Ridges 117
7.5.2.4 Multiscale Edges 119
7.5.2·.5 Multiscale Amplitude Features 121
7.5.2.6 EOG Indicator 121
7.5.2.7 Chirp Features 121
7.5.2.8 Electrode Artifact Indicators 123 7.5.3 Evaluation of the single-channel features 123
7.5.3.1 Development Cycle 123
7.5.3.2 Bayesian Evaluation of the Discriminant
Function 123
7.5.4 Multichannel Features 124
7.5.4.1 Source-Orientation Estimate 124
7.5.4.2 Combined Probabilities 125
7.5.4.3 Adjacency Filter 126
7.5.5 Final Classification 126
7.6 Summary 127
CHAPTER 8 SYSTEM EVALUATION 129
8.1 Introduction 129
8.2 Performance Measures 129
8.2.1 Traditional Measures 129
8.2.2 Continuous-Valued Sensitivities and Selectivities 130
8.3 EEG Data Set 131
8.3.1 Data Subsets for Training and Testing 132
8.3.2 Recording Protocols 132
8.4 Training of the Wavelet-Based Spike Detection System 133 8.4.1 Refinement of the Training Data Set 133 8.4.2 Training of the Linear Discriminant Functions 134 8.5 Performance of the Wavelet Based Spike Detection System 134
xii
8.5.2 Test Data Set 8.5.3 Missed Detections 8.5.4 False Detections
CONTENTS
135 135 135
8.6 Comparison with Two Other Systems 138
8.6.1 Hybrid I System 138
8.6.2 Hybrid II System 139
8.7 Performance at the Level of Entire Recordings 144 8.8 Performance of Systems in the Literature 145
8.9 Possible Improvements 147
CHAPTER 9 CONCLUSIONS AND FUTURE RESEARCH 149
9.1 Conclusions 149
9.2 Suggestions and FUture Research 151
9.2.1 Wavelet Analysis in the Detection of Epileptiform
Spikes 151
9.2.2 Chirps 152
9.2.3 Discriminant FUnctions 153
9.2.4 Knowledge 153
APPENDIX A RELEVANT EEG EPISODES 155
PREFACE
The following thesis presents the work done in more than three years as a student in the Department of Electrical and Electronic Engineering. Most of the research and development was conducted in the Department of Medical Physics and Bioengineering at Christchurch Hospital in collaboration with the Department of Neurology.
I first got involved in the analysis of digital EEG as a physics student at the University of Marburg in 1993. As a summer student I ported EEG averaging software written in the iC' programming . language from the Atari/GEM environment to the Vax/VMS platform in collaboration with Prof Frank RosIer. I did my final year project and thesis under the supervision of Prof Frank RosIer and Prof Reinhard Eckhorn on the development of a technique for the decomposition of averaged auditory and somatosensory event-related potentials (ERPs) into a set of spatial components and respective temporal activation signals [GOlz 1995], similar to independent component
analysis (ICA) [Makeig
et
al. 1996, Ghahremaniet
al. 1996, Makeiget
al. 1997]. I developed an extensive software package for ERP analysis in the object-oriented 'C++' programming language including a graphical user interface and a script interpreter for psychophysiological research as a research assistant after graduating. Because the ERP waveforms feature a small number of waves with various phase lags, I tried to design a complex wavelet filter with the smallest possible number of oscillations and studied the properties of the resulting CWTs [Golzet
al. 1997].In 1997 I enrolled for a Masters degree in Electrical and Electronic Engineering under the supervision of Dr Phil Bones and Dr Richard Jones and started working on the analysis of clinical EEG and the spike detection problem. In December 1997 I applied for, and was awarded, a University of Canterbury Postdoctoral Scholarship and enrolled for the degree of Doctor of Philosophy.
The development of automated systems for the enhancement and detection of epileptiform spikes in the EEG has a long history as a collaborative project between the Department of Medical Physics and Bioengineering at Christchurch Hospital and the Department of Electrical and Electronic Engineering at the University of Canterbury. One of the earliest spike detection systems was designed by Dr Bruce Davey [Davey
neu-xiv PREFACE
ral network (ANN) for the classification of the mimetic features [James 1997] and Dr Donna Ward applied beamformer techniques used in radar systems to the enhancement of deep epileptiform activity [Ward 1998].
There are four main parts in this thesis: part one (Chapters 1 & 2) gives an introduction to the basic anatomy and neurophysiology of the brain, and the processes involved in the generation of electric surface potentials by the activity of the brain known as EEG. An introduction to the various symptoms and seizure types related to epilepsy and to the problem of identifying epileptiform transients that occur between seizures, the spike detection problem, follow.
Part two (Chapters 3 & 4) deals with wavelet-based methods for signal analysis. The two major transforms, DWT and CWT, are presented along with a variety of suitable wavelets. While the DWT is fast and invertible, the CWT is better suited to a detection problem since it is translation-invariant. Transient specific features can be reliably extracted from the CWT only. The wavelet-based approaclles are compared to two bilinear time-frequency representations: the Wigner-Ville distribution (WVD) and the Choi-Williams distribution (CWD).
In part three (Chapters 5 & 6) additional methods needed to build a spike detection system are presented. Discriminant functions are used as a tool to classify feature vectors in to two classes. Most discriminant functions have a term called bias that balances unequal sample sizes. This is important for the spike detection problem since the number of artifacts is commonly much larger than the number of epileptiform spikes.
Electrostatic models for the generation of the electric surface potential are pre-sented. From a given forward solution, an inverse estimate of the source distribution can be obtained. While the generation of the EEG is confined to the source space, some artifacts may also occur in electrode space. The absence of an absolute zero poten-tial reference makes it impossible to invert the transformation from electrode space to channel space. The effect of an electric current generator in the volume of the source space, the forward solution, is simulated.
In part four (Chapters 7 & 8) a wavelet-based spike detection system is presented, evaluated and compared to two existing systems. The system is based on the CWT and has two stages. In the first stage, transient waveforms are detected with an adaptive multichannel filter based on a single scale of the CWT. In the second stage, multichannel multiscale features of transients are extracted and classified with a linear discriminant function. The results of the new system are compared to those obtained with the two systems developed by Dingle [1992] and James [1997].
PREFACE xv
presentations and papers have been prepared:
Goelz, H., Jones, RD. and Bones, P.J., 'Wavelets and their Application to Analysis of Biomedical Signals' 3rd Annual International Conference of the Australasian College of Physical Scientists and Engineers in Medicine, Christchurch Hospital, November 1, 1998.
Goelz, H., 'Wavelet Analysis of transient biomedical signals and its application to detection of epileptiform activity in the EEG' pre-conference Workshop on Time-Frequency and Time-Scale (Wavelets) for biomedical signal and image processing, IEEE Engineering in Medicine and Biology (EMBS) and Bio Medical Engineering Society (BMES) Conference, Atlanta, October 12, 1999.
Goelz, H., Jones, RD. and Bones, P.J., 'Continuous Wavelet Transform for the Detection and Classification of Epileptiform Activity in the EEG' IEEE Engineering in Medicine and Biology (EMBS) and Bio Medical Engineering Society (BMES) Con-ference, Atlanta, October 13-16, 1999.
Goelz, H., Jones, RD. and Bones, P.J., 'Wavelet Analysis of transient biomedical signals and its application to detection of epileptiform activity in the EEG' Inaugural
Meeting of the EEG (9 Clinical Neuroscience Society (ECNS) at the George Washing-ton School of Medicine, Washington D.C., October 21-23, 1999.
Goelz, H., Jones, RD. and Bones, P.J. (2000), 'Wavelet Analysis of Transient Biomedical Signals and Its Application to Detection of Epileptiform Activity in the EEG', Clinical Electroencephalography Vol. 41, pp.181-191.
The following paper has been submitted for publication:
Chapter
1
BRAIN AND ELECTROENCEPHALOGRAM
1.1
INTRODUCTION
This chapter begins with a brief introduction to the anatomy and neurophysiology of the human brain at various scales. A concise review of the processes involved in the generation of the electric phenom<mon related to the brain's activity, the electroen-cephalogram (EEG), is given followed by a presentation of the techniques used in its measurement. Finally, the various normal patterns of the EEG and commonly found artifacts are discussed. Most information in this chapter is drawn from Nolte [1981], Nunez [1981], Duffy et al. [1989], Laidlaw et ai. [1993] and Binnie [1993].
1.2 THE HUMAN BRAIN
1.2.1 Neurons
The basic building elements of the brain are neurons and glial cells. About 100 billion neurons and ten times as many glial cells make up the human central nervous system (eNS). Neurons come in a great variety of sizes and shapes but most have a long protrusion, the axon, that carries information from the cell body, the soma, to other cells. Special structures at the end of the axons, the synaptic terminals connect one cell to another. On the receiving side of the synaptic terminals there are shorter protrusions called dendrites that pick up the information and carry it to the receiving cell's soma. Most of the glial cells form a special kind of wrapping, the myelin sheaths, around the axons that speed up information conduction and provide electrical insulation.
1.2.2 Principle
of Operation
2 CHAPTER 1 BRAIN AND ELECTROENCEPHALOGRAM
Between the neurons, information is carried by chemical processes. A mitter is released at the synaptic terminals by the firing neuron. The neurotrans-mitter is picked up by chemical receptors of the receiving neuron's dendrites where it causes a post-synaptic potential. The post-synaptic potential may either be excitatory or inhibitory.
1.2.3 Neuronal Input, Processing and Output
There are three main functional classes of neurons: sensory neurons, interneurons and motor neurons. Sensory neurons collect information from specific nonneural receptor cells which are sensitive to visual, auditory, tactile, proprioceptive, olfactory, or other sensory stimuli. Motor neurons directly control muscles and glands. All other neurons are interneurons which connect neurons amongst each other and make up 99.99% ofthe CNS. Interneurons are strongly interconnected with their dendrites having as many as 103 to 105 synaptic terminals.
1.2.4 Major Structural Elements of the eNS
The CNS is composed of two main components: the brain and the spinal cord. The brain can further be subdivided into the cerebrum, the cerebellum and the brainstem (Fig. 1.1). The brainstem is the structure through which nerve fibres relay signals in both directions between the spinal cord and higher brain centres. The cerebellum lies posterior to the brainstem and has a primary role in coordinating movements. The shape of the cerebrum is characterized by a variety of sulci (folds), fissures (large folds) and gyri (rounded protrusions between folds) that are subdivided into four main lobes: frontal lobe, parietal lobe, occipital lobe and temporal lobe as illustrated in Fig. 1.1.
/central sulcus
-...."..---
, Parietal lobeOccipital lobe
Temporal lobe ...:::...:~~,-- - - Cerebellum
Brainstem
Spinal cord
1.2 THE HUMAN BRAIN 3
1.2.5 Cerebral Cortex
Of particular interest is the cerebral cortex, which is the surface layer of the convoluted structure of the cerebrum. The cerebral cortex is only 2-3 mm thick and can be distin-guished as the gray matter from the rest of the cerebrum. It contains predominantly cell bodies and dendrites of the neurons whereas the white matter is mainly made up of long axons [Nolte 1981].
1.2.6 Pyramidal Cells
The cerebral cortex can be subdivided into six layers (labelled I to VI) each containing characteristic neurons. The largest neurons are the pyramidal cells which can grow as large as 100/hm in diameter and occupy layers III and V of the cortex (Fig. 1.2). Pyramidal cells are characterized by a series of basal dendrites that extend horizontally from their base, a large vertical apical dendrite attached to the top, and a long axon.
95% of the pyramidal cells send ou,t a major axon running into the subcortical white matter that provides a link to a distant cortical area while only 5% make short range intracortical connections [Nunez 1981].
Apical Dendrite
I
I
Axon
/Soma
Dendrites
Figure 1.2 Pyramidal cell with soma, axon, basal dendrites and large apical dendrite.
1.2.7 Localization of Function
4 CHAPTER 1 BRAIN AND ELECTROENCEPHALOGRAM
ell the function is actually localized in a particular area,
110 one area performs one crucial step in the function, or
" the area faciliates the activity of one or more other structures [Nolte 1981].
The cortex can be divided into primary sensory areas, a primary motor area and association areas. The location of the primary sensory and motor areas is well known and not disputed (Fig. 1.3). For some areas, such as the visual cortex, many details have
Motor cortex
I
_-...._~_/ / Somatosensory cortex
Broca's area
- - - Wernicke's area
\
\
Auditory cortex \
\
\ Visual cortex
Figure 1.3 Different types of cortex.
been discovered regarding the internal organization and temporal coding of associated signals [Hubel and Wiesel 1977, Eckhorn et al. 1988, Herculano Houzel et al. 1999]. Only two areas representing higher cognitive functions are well established: Broca's area and Wernicke's area, which relate to the production and comprehension of spoken language. Both areas have been studied in relation to aphasia (loss of speech) induced by lesions. Broca's area is involved in speech production while Wernicke's area can be linked to the comprehension and production of language (Fig. 1.3).
A comprehensive collection of studies covering various modalities such as x-ray com-puted tomography (CT), positron emission tomography (PET), functional magnetic reso-nance imaging (fMRl), electroencephalography (EEG), magnetoencephalography (MEG), in investigations of the localization of brain function has recently been published by Toga and Mazziotta [2000].
1.3 THE ELECTROENCEPHALOGRAM
1.3.1 Origin
1.3 THE ELECTROENCEPHALOGRAM 5
EEG. The peak amplitude of the EEG is in the range of 5p,V to 100p,V, but it is mostly below 50 p,V [Duffy et al. 1989]. The activity of the pyramidal cells with their large apical dendrites is believed to be the major contributor to the generation of the EEG. Only the gross spatial mean of electrical activity of the cells can be recorded on the scalp. Binnie [1993] suggested the following analogy: someone listening outside a rugby stadium may hear but cannot understand the confused shouts of the crowd for most of the time. However, the general applause when the home team scores a try and the universal gasp when one is missed are easily recognized. That is, EEG recordings primarily reflect only that neuronal activity which is synchronous over a large number of neurons.
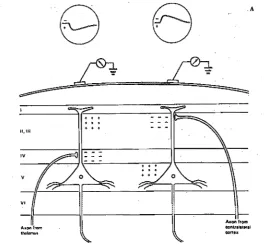
A complete model of the physiological basis of the EEG, linking the microscopic level of neurons and both their local and global interconnection properties with the resulting potentials at a macroscopic level was proposed by Nunez [1981]. The basic mechanism generating surface potentials is illustrated in 1.4 [Nunez 1995].
9
a
.AAxQtlfrom-contrll'fll',1
[image:21.569.168.433.345.597.2]cart . .
Figure 1.4 The six cortical layers (I-IV) with two pyramidal cells in layer V. Postsynaptic potentials generate surface positivity if the synaptic terminals are located in layer IV. Surface negativity results from synaptic terminals in layer II [Nunez 1995].
1.3+1.1 Rhythmic Activity
The most common rhythmic electrical brain activity is found near 10 Hz. It is known as the alpha rhythm and was reported by Berger [1929].
6 CHAPTER 1 BRAIN AND ELECTROENCEPHALOGRAM
cerebral structure above the brainstem, has a putative role as a pacemaker for the alpha rhythm. Besides its presence in the EEG, the rhythm can be recorded with microelectrodes in the thalamus. After removal of the thalamocortical connections the alpha rhythm was found in the thalamus only [Andersen and Andersson 1968].
Lippold [1973] suggested that alpha waves were generated by the tremor in the extra-ocular muscles rather than the brain. However, his suggestion was rejected by the majority of scientists.
Nunez [1981] reported that the phase relationships between thalamic and cortical alpha waves were far less consistent than those between distant cortical areas. He suggested a model for the intracortical generation of the alpha rhythm which is based on the wave equations used in physics to describe properties of standing and moving waves. The interaction between thalamic and cortical alpha waves may be more complex than suggested by Andersen and Andersson [1968].
1.3.2 Recording System
[image:22.569.144.427.463.730.2]Electric potentials on the scalp are commonly picked up by 20 or so electrodes. In routine clinical recordings, electrodes are placed at well defined locations according to the international 10-20 system proposed by Jasper [1958]. Four fixed landmarks serve as a references: nasion, inion, and the two preauricular points (Fig. 1.5). The 10-20
1.3 THE ELECTROENCEPHALOGRAM 7
system divides the perimeter of the head into sectors of 10 and 20% (e.g. perimeter through nasion-Fp1-F3-C3-P3-01-inion). Potentials are measured either with respect to a single reference electrode (referential recording) or with respect to an adjacent electrode (bipolar recording).
The manner in which electrodes are mapped to channels is called the montage and may be changed several times within a recording session. Recordings are preferably
made within an electrically shielded room. The EEG signals in each channel are ampli-fied and band-pass filtered (commonly 1-70 Hz). Traditionally, recordings of 8, 16 or 21 channels were instantly written by a bank of galvanometers on a lengthy paper chart but this ha..'3 largely been replaced by paperless recording systems in which EEGs are digitized, stored, reviewed and archived by computer-based systems. Digital EEG has several fundamental advantages including the ease of changing the filter and montage of an actual recording. Montages used in the CUl'l'ent work are listed in Fig. 6.1.
1.3.3 Features of Brain Waves
A variety of rhythms and transient waveforms make up the normal background or ongoing EEG. Features of the background EEG are mainly influenced by the age of the subject and the state of sleep or wakefulness. Features of normal and abnormal EEG patterns are described in more detail in Duffy et ai. [1989] and Fisch [1991].
1.3.3.1 Alpha Activity
The most prominent normal feature from the adult human cortex are alpha waves 01' alpha spindles which are characterized by a regular series of waves at about 10 Hz. Alpha
1s
Figure 1.6 Alpha spindles.
waves between 8.5 and 12 Hz are considered normal for adults. Alpha activity mayorig-inate from all regions but is more characteristic of the occipital areas [Ogilvie 1949].
It is most obvious while subjects are resting with eyes closed and diminishes dramati-cally when eyes are opened. It may show a waxing and waning pattern over time. An example of alpha waves is given in Fig. 1.6 and in A.ll on p. 166 in Appendix A.
8 CHAPTER 1 BRAIN AND ELECTROENCEPHALOGRAM
1.3.3.2 Beta Activity
The beta rhythm is of lower amplitude than alpha activity and lies within the frequency band 18 to 32 Hz. It is more dominant in the anterior regions of the head and may be present simultaneously with alpha activity. An illustration of beta activity is shown in Fig. 1.7 and in Fig. A.3 on p. 158 in Appendix A.
1 s
Figure 1. 7 Beta activity.
1.3.3.3 Theta Activity
Theta waves lie within the frequency band of 4-7 Hz and occur during light sleep in normal adults. Theta waves found in young children during wakefulness may represent alpha activity of low frequency which can only be distinguished by recording periods with eyes open and eyes closed [Kellaway 1979].
Figure 1.8 Theta waves.
1.3.3.4 Delta Activity
Delta activity comprises slow waves of 1-4 Hz and are only found in sleep stage IV of normal subjects. J!lx:ce!lS delta activity is also a strong indicator of structural lesions in the brain such as tumors or haemorrhage.
~
1 s1.3 THE ELECTROENCEPHALOGRAM 9
1.3.3.5 Gamma Activity
Cortical oscillations between 35 and 55 Hz are known as gamma activity. These waves are usually of extremely small amplitude and are often not seen at all [Ogilvie 1949]. Coherent stimulus-evoked resonances between 35 and 75 Hz have been reported from the visual cortex during the presentation of a simple visual stimulus [Eckhorn
et
al. 1988]. Tallon-Baudryet
al. [1996] present less coherent visually evoked gamma-band responses in the EEG.1.3.4
ilrtifacts
There are frequently other rhythms and transient waveforms in the EEG which are of non-cortical origin. In some cases, considerable experience is required to tell artifacts from cortical activity.
1.3.4.1 Muscle Activity
Artifactualmuscle activity is often seen in EEG with jaw movements or contraction of facial muscles. It may be continuously present if the subject is unable to relax. The electrical potentials resulting from muscle contractions appear as fast spiky waves at a rate of about 30 to 60Hz [Ogilvie 1949].
1.3.4.2 Sweating
When the subject perspires, the baseline of the tracing may rise and fall, at a rate of 1 Hz or less. The movements are more prominent in the frontal leads and are thought to be caused by the activity of the sweat glands [Ogilvie 1949].
1.3.4.3 Drift Artifacts
Perspiration and other electrochemical processes at the skin-electrode interface may cause a continuous quasi-linear channel-specific drift. The drift is only observed in DC-recordings which are commonly made to explore slow event-related activation patterns. It can be removed by linear regression [Hennighausen
et
al. 1993].1.3.4.4 Electrode Artifact
10 CHAPTER 1 BRAIN AND ELECTROENCEPHALOGRAM
1.3.4.5 EOG Artifact
A series of isolated waves occurring at a rate of one to two per second may be caused by the QRS component of the electrocardiogram (ECG). The artifact is mainly found in referential channels. ECG artifacts are illustrated in Fig. A.17 on p. 172 in Appendix
A.
1.3.4.6 Eye Blinks and Eye Movements
A constant potential exists in the retina such that eye movements cause strong potential changes on the scalp around the eye called the electrooculogram (EOG). The EOG can be recorded with bipolar channels near the eye. Eye blinks cause large scale positive transient deflections in the frontal channels of the EEG. A series of eye-blinks in the EEG can be seen on p. 174 in Appendix A. Artifacts caused by eye-blinks are usually symmetric on the two sides of the head and show decreasing amplitude from the frontal to the rear channels. However, the spatial distribution may change with the direction of gaze of the subject. Horizontal and vertical eye movements may also cause small low frequency transients in frontal channels. Fast eye blinks are especially problematic in the detection of epileptiform transients, since they exhibit some similarity.
1.3.4.7 Electric Appliance Artifact
The ring of a telephone in the EEG laboratory may sometimes cause a series of 18-25 Hz waves in the EEG [Ogilvie 1949]. It may be a difficult and time-consuming task to identify the source of any enviromental electric disturbance.
1.3.4.8 Mains Interference
A steady 50 or 60 Hz artifact may be induced from the mains alternating current. Many EEG systems are equipped with a notch :filter that strongly attenuates the respective frequency. Mains interference may be caused by loops in the ground wiring.
1.4 SUMMARY
Chapter 2
EPILEPSY AND THE SPIKE DETECTION PROBLEM
2.1
INTRODUCTION
Important aspects of epilepsy and the EEG as a diagnostic tool are presented. Changes in the EEG during and in between seizures are described.
Various approaches to the autOJ;natic detection of interictal epileptiform activity in the EEG are presented. Approaches are based on mimetic features, statistical (autore-gressive) models or transforms such as the wavelet transform.
2.2 EPILEPSY
Epilepsy is a reasonably common neurological disorder. It is estimated that about 1
%
of the world's population has epilepsy and, despite medication, about 10% of patients have seizures more than once a month. As epilepsy is a symptom complex and not a disease as such, a presentation of epilepsy requires reference to three levels: the aetiology (cause), the seizure type, and the epileptic syndrome [Porter 1993].
The various classifications of epileptic seizures and epileptic syndromes are still evolving, but two standards have been approved by the International League Against Epilepsy: the 1981 Classification of Epileptic Seizures and the 1989 Classification of Epileptic Syndromes [Comm. ILAE 1981 and 1989]. Epilepsy can be caused by virtu-ally any major category of serious disease or disorder in humans. It can result from congenital malformations, infections, tumours, vascular diseases, degenerative diseases, or injury. If the cause can be identified, the epileptic syndrome is labelled 'symp-tomatic', otherwise - or until the cause has been identified it is labelled 'cryptogenic' [Porter 1993].
2.2.1 Epileptic Seizures
12 CHAPTER 2 EPILEPSY AND THE SPIKE DETECTION PROBLEM
EEG recording may be needed to provide documentation of seizures that occur rarely. If no clinical observation can be obtained the description given by eye witnesses may be needed, particularly for those types of seizures that involve loss of consciousness.
Epileptic seizures are classified as partial seizures or generalized seizures. Partial seizures are those in which the first clinical and EEG changes indicate initial activation of a system of neurons in one cerebral hemisphere. If both hemispheres are involved in the initial neuronal activation, the seizure is labelled 'generalized'. Simple partial seizures do not impair consciousness, complex partial seizures do impair consciousness and secondarily generalized partial seizures evolve to generalized seizures. Types of partial and generalized seizures and associated clinical signs are listed in Table 2.1.
Seizures may last from seconds to several minutes. Seizures lasting for more than 30 minutes or occurring at such frequency that the patient is unable to recover to a normal level of functioning between seizures are called status epilepticus [Treiman 1993]. For the diagnosis of an epileptic syndrome, additional factors such as case history, family history, age, age at onset, gender, neurological examination, ictaljinterictal (see below), psychological evaluation, aetiology of epilepsy, angiogram, MRI scan, CT scan, or the examination of the cerebrospinal fluid may play an important role beside the
type of seizure observed [Porter 1993].
2.2.2
Changes in the EEG
2.2.3 Ictal Changes
The EEG recorded during a seizure is called ictal EEG, while the EEG between seizures is referred to as interictal EEG. Most seizures produce clear signs in the ictal EEG that are valuable indicators for the diagnosis. For example, the characteristic pattern found in ictal EEG of patients having absence seizures are 2-4 Hz spike-and-wave complexes as shown in Fig. A.1 on p. 156 in Appendix A.
2.2.4 Interictal Changes
In the interictal characteristic patterns for epilepsy may be less obvious. Interictal epileptiform patterns may include spikes, spike-and-wave complexes, and sharp waves. Fast abnormal transients such as the epileptiform patterns are called paroxysmal activity.
Chatrian et al. [1977] defined epileptiform transients (ETs) on behalf of the Interna-tional Federation of Societies for Electroencephalography and Clinical Neurophysiology (IFSECN) as 'transient, clearly distinguished from background activity, with pointed peak at conventional paper speeds and a duration from 20 to under 70 msec, that is, 1j50th to 1j13th of a second approximately'.
2.2 EPILEPSY 13
Table 2.1 Major seizure types and associated changes in the EEG. Up to six sub-categories with individual clinical symptoms may exist for each clinical seizure type [Commission on Classification and Terminology of the International League Against Epilepsy 1981].
Clinical seizure type EEG seizure type Interictal EEG Partial Seizures
Simple partial seizures Local contralateral discharge Local contralateral discharge (consciousness not starting over the corresponding
impaired) area of cortical representation (not always recorded on the scalp)
Complex partial seizures Unilateral or, frequently bilateral Unilateral or bilateral generally (with impairment of con- discharge, diffuse or focal in tem- asynchronous focus; usually in the sciousnessj may some- poral or frontotemporal regions temporal or frontal regions times begin with simple
symptomatology)
Partial evolving to sec- Above discharges become
secon-ondarily genemlized darily and rapidly generalized
seizures
(This may be general-ized tonic-clonic, tonic, or clonic)
Generalized Seizures
Absence or 'petit mal' Usually regular and symmetrical 3 Background activity usually
nor-seizures Hz but may be 2-4 Hz spike and mal although paroxysmal
activ-slow-wave complexes. Abnormali- ity (such as spikes or spike and ties are bilateral slow-wave complexes) may occur. This activity is usually regular and symmetrical
Atypical absence EEG more heterogeneous; may Background usually abnormal;
include irregular spike and slow- paroxysmal activity (such as wave complexes, fast activity or spikes or spike and slow-wave other paroxsymal activity. Abnor- complexes) frequently irregular malities are bilateral but often and asymmetrical
irregular and asvmmetrical
Myoclonic seizures Polyspike and wave, or sometimes Same as ictal Myoclonic jerks spike and wave or sharp and slow
(single or mUltiple) waves
Clonic seizures Fast activity (10
cis
or more) and Spike and wave or polyspike-and-slow waveSj occasional spike and wave dischargeswave patterns
Tonic seizures Low voltage, fast activity or More or less rhythmic discharges
a fast rhythm of 0-10
cis
or of sharp and slow waves, some-more decreasing in frequency and times unsymmetricaL Back-increasing in amplitude ground is often abnormal for ageTonic-clonic seizures Rhythm at 0-10 or more
cis
Polyspike and waves or spike and decreasing in frequency and wave, or, sometimes sharp and increasing in amplitude during slow wave dischargestonic phase, interrupted by slow waves during clonic phase
Atonic seizures Polyspikes and wave or flattening Polyspike and slow wave or low-voltage fast activitv
14 CHAPTER 2 EPILEPSY AND THE SPIKE DETECTION PROBLEM
sharp waves. Waves of longer duration than 120 ms and of sharp appearance may also represent epileptiform activity. Discrete spikes and sharp waves are usually followed by a slower wave and, if this is prominent, the two together are described as spike and wave complex. Focal spikes are often polyphasic, but the most prominent component is usually surface negative' (see below).
2.2.5 Focal and Non-focal Epileptiform Discharges
An epileptiform event causes a number of coincident transients such as spikes, sharp waves, or spike-and-wave complexes in several EEG channels. Events on single channels are deemed to be ETs while the set of all EEG multichannel transients related to a single event is called an epileptiform discharge (ED).
EDs emerging from a well localized region of cerebral irritation such as that caused by tumours or injuries are called focal EDs. If several foci are found in a single recording, the recording is said to contain multifocal epileptiform activity.
A focal ED shows several peaks in adjacent bipolar channels. The specific property of a surface negative focal ED is that the polarity of the peaks changes such that peaks on one pair of adjacent channels point at each other. This phenomenon is known as
phase reversal. In some cases the pair of channels that show the phase reversal may be separated by a channel not showing any unusual activity, a null-channel. A surface negative focal ED without null-channel is shown in Fig. A.20 on p. 175. Several focal EDs from multiple foci are illustrated in Fig. A.6 on p. 161.
Other EDs that do not emerge from a well localized area of the cerebrum are called
generalized EDs.
The EEG samples in Appendix A show a variety of interictal epileptiform patterns as described in the captions.
2.2.6 Diagnostic limitations of the interictat EEG
2.2.6.1 EEG Spikes in Healthy Subjects
Binnie [1993] has listed several examples of spike-and-wave complexes found in the EEG of people who do not suffer from epilepsy.
One of the examples refers to rhythmic spiky discharges at 6 and 14 Hz found in drowsiness and light sleep of young adults. Spikes were surface-positive as opposed to epileptic spikes. About 20% of cases studied showed this feature.
2.3 AUTOMATIC DETECTION OF INTERlCTAL SPIKES IN THE EEG 15
A similar phenomenon, sub-clinical rhythmic discharges of adults (SREDA), occurs further posteriorly and is virtually confined to adults of more than 50 years of age. It
appears to have no clinical significance either. Chadwick [1993] expressed the function and limits of the diagnostic value of the EEG in the following way:
((The EEG provides valuable information that may:
(a) add weight to the clinical diagnosis;
(b) aid the classification of epilepsy, and
(c) show changes that may increase the suspicion of a structural lesion.
Routine interictal EEG recording is one of the most abused investigations
in clinical medicine and is unquestionably responsible for great human
suf-fering. The diagnostic value of an interictal EEG is widely misunderstood.
EEGs are often requested either to exclude or to prove a diagnosis of epilepsy
something that can seldom, if ever, be done. Erroneous interpretation of
the EEG is probably the commonest reason for non-epileptic events being
diagnosed as seizures."
2.2.6.2 Epileptic Patients without EEG Spikes
Conversely, in a study by Binnie et al. [1986], 50% of 100 patients with known epilepsy showed no signed of inter ictal epileptiform activity in the initial clinical EEG recording. When followed by sleep EEGs, 80% showed interictal activity. In 8 of 100 epileptic patients no signs of interictal epileptiform activity could be found in repeated wake and sleep recordings [Binnie et ai. 1986].
2.3 AUTOMATIC DETECTION OF INTERICTAL SPIKES IN
THE EEG
MacGillivray [1977] notes that neurophysiologists are fairly efficient at detecting spikes in the EEG within their own terms of reference and that repeatability for a single reader is high. However, inter-rater agreement can be surprisingly low. The precise definition of the sequence of operations by which marking is done in all circumstances, as is required for computer emulation, is a very difficult task and can only be achieved approximately.
Glover et al. [1986] summarize the advantages automated methods of may have over visual methods:
scoring
(a) They can ease the work-load of the EEGer by providing off-line, faster
than real-time analysis of lengthy records
16 CHAPTER 2 EPILEPSY AND THE SPIKE DETECTION PROBLEM
(c) They can offer a tool for detailed quantification of the epileptiform activ-ity, which could be used to study the effect of drug treatment
(d) They could eventually lead to a comprehensive definition of an epilepti-form, and thus contribute to the standardization of epileptiform detection.
Two primary areas of application were identified by Dingle et aI. [1993]: firstly, long-term EEG monitoring, where automated detection of epileptiform transients acts as a data reduction process, and, secondly, in routine clinical recordings where the objective is to minimize the visual inspection required.
2.3.1 The Spike Detection Problem
Various approaches have been taken to automatically identify epileptiform spikes. EDs, background features and artifacts come in a large variety. Furthermore, background features can change rapidly over time. All patterns found in the EEG have individual durations. Thus, an. appropriate amount of temporal context is needed to identify them. The spatial context may provide an important clue as EDs lead to a pool of surface negativity. Patterns may be of short duration but recurrent such that their detection can only be verified by comparing distant epochs in a recording or, in other
words, wide-sense temporal context [Dingle et al. 1993, Black et al. 2000].
A number of approaches to the spike detection problem are presented in the fol-lowing subsections. The performance of some of these systems is presented in Chapter 8.
2.3.2 Second Derivative Techniques
Carrie [1972b] calculated the second derivative ofEEG waves on an analogue computer.
When the magnitude of the second derivative exceeded a threshold, a transient was considered to be detected. No further classification of the transient was made. The threshold was dynamically updated with respect to a predefined number of previous waves. Waves were delimited by zero crossings of the EEG signal. Only a single EEG channel was processed and no performance evaluation was made [Carrie 1972b, Carrie 1972a].
2.3.3 Zero Crossing Techniques
2.3 AUTOMATIC DETECTION OF INTERICTAL SPIKES IN THE EEG 17
kind of ET was detected by the system. Multichannel context was not used and the performance of the system was not evaluated.
2.3.4 Mimetic Approaches
Mimetic approaches try to mimic the way EEG readers evaluate individual waves. Firstly, the single channel EEG is broken down into a series of waves and half-waves. Subsequently, several characteristic attributes are assigned to each wave.
Kooi [1966] evaluated the amplitude, duration, velocity and the angle sub tended by the rising and falling slope of various ETs. He suggested using these features to define objective criteria of ETs in paper recordings before the first spike detection systems were built. The angle definition he used is illustrated in Fig. 2.1 (left) with an actual ET. The respective ED can be found in channel 16 in Fig.
A.6
on p. 161. Gotman and200
100
o
-100
,...
. I •
~\f ~
V
-200~--~--~--~----~--~
20 40 60 80 100
200
-200~--~--~--~----~--~
20 40 60 80 100
Figure 2.1 Sample ET (100 samples, 0.5 s from E8219). Left: linear regression of rising and falling slopes of the spike. The angle between the two lines was proposed as a feature by Kooi [1966]. Right: periods of rising and falling potential between local extrema. Periods were joined to longer sequences in subsequent processing [Gotman et al. 1976]
Gloor [1976] split EEG signals into rising and falling segments as illustrated in Fig. 2.1 (right). Segments were subsequently joined to larger elements they called 'sequences' and 'waves'. Several basic attributes were assigned to each wave:
• relative amplitude: amplitude of waves normalized by the average of the pre-ceding five seconds,
" duration of half-waves: duration between minimum and maximum,
• pseudo-duration of half-waves: duration with non-linear correction (see below),
• relative sharpness: second derivative of the apex normalized by preceding five seconds, and
18 CHAPTER 2 EPILEPSY AND THE
spn{E
DETECTION PROBLEM200 200
100 100
\~
0
~'-'.---
0 /)..
~~)(--
...
V
-100 -100
-200 -200
20 40 60 20 40 60
Figure 2.2 Close up of sample ET in previous figure showing the three major half-waves of the spike (60 samples only). For the second and third half-waves amplitude and duration are indicated by vertical and horizontal lines, respectively. Circles mark the potential at half the duration. Crosses (x) mark pseudo-duration as suggested by Gotman et al. [1976]. Two cases are illustrated: (left) the pseudo-duration equals the duration, and (right) the pseudo-duration is smaller than the duration.
The. amplitude, duration and pseudo-dur<;ttion of half-waves, as defined by Gotman and Gloor [1976], are illustrated in 2.2. Subsequent processing rejected muscle spikes, eye-blinks and alpha activity. Inter-channel relationships were analyzed with respect to phase reversal patterns in bipolar chains of channels to confirm surface negativity. Similar mimetic approaches were used by Gotman [1985], Glover et al. [1986], Glover et al. [1989]' and Davey et al. [1989]. Dingle et al. [1993] measured the amplitude of a wave with respect to a 75 ms floating mean centered around the peak. They used the sum of the magnitudes of the half-waves' slopes as a measure of sharpness [Dingle et ai. 1993]. Performance of the system was tested in a clinical study with 521 EEGs including 50 epileptiform EEGs [Jones et al. 1996]. For the classification of entire EEGs a sensitivity of 95% and a selectivity of 72% were reported. There were only 0.29 false detections per hour.
2.3.5 Parametric Approaches
Da Silva et al. [1975] applied an autoregressive model to the N oll-stationarities such as epileptiform spikes were identified by a large prediction error of the model. They assumed a chi-square distribution for the prediction error and derived detection thresholds for confidence levels of 0.5% and 0.1%. Birkemeier et al. [1978] used the second derivative of the EEG and the second derivative of the prediction error of an autoregressive model as transient indicators.
2.3.6 Syntactic Approach
2.3 AUTOMATIC DETECTION OF INTERlCTAL SPIKES IN THE EEG 19
corresponding sequence of symbols they called 'spike string'. A finite-state grammar was automatically inferred from a set of training strings. The finite-state grammar represented a class of strings larger than the training set with properties of ETs.
2.3.7 Approaches based on Artificial Neural Networks
Eberhart et al. [1989] trained an artificial neural network (ANN) with 240-ms windows (60 samples) ofETs and non-ETs from a single-channel EEG recording. They examined several possible neural network architectures.
Webber et al. [1994] developed a spike detection system based on a 3-layer feed-forward ANN. The system was trained with the error-backpropagation method. The sensitivity at equal specificity of the system was increased from 46% to 73% by using mimetic features of ETs rather than 'raw' EEG data (refer to Chapter 5 for definitions of sensitivity and specificity). A 3-layer feed-forward ANN was also used by Gabor and Seyal [1992].
Kalayci and Ozdamar [1995] trained an ANN with features derived from wavelet analysis. Their approach is detailed in section 2.3.9.
James [1997] used mimetic feature extraction and a self-organizing feature map (SOFM) for single channel analysis. The spatial context was subsequently evaluated by a fuzzy logic stage [James 1997, James et al. 1996a, James et al. 1996b, James et al. 1999]. After training with 35 epileptiform EEGs, a sensitivity of 55% and a selectivity of 82% were achieved in a blind test with 7 epileptiform and one normal recordings. James et al. [1997] also applied multireference adaptive noise cancelling (MRANC) to the raw EEG which they proposed as a spatial pre-processing stage to improve the sensitivity of any spike detection system.
Tarassenko et al. [1998] compared the performance of two sets of features, mimetic features and coefficients derived from an autoregressive model (prediction error and partial correlations), in the training of an ANN. Superior performance was reported for the autoregressive model coefficients. However) a combination of all features further improved the cla..'lsification to a mean of 93% sensitivity and 91% specificity in a blind cross-validation of recordings from four patients.
Ko and Chung [2000] trained an ANN with 6 hidden layers with 'raw' ETs and non-ETs. They reported a sensitivity of 87% at equal specificity.
2.3.8 Rule-based Systems
20 CHAPTER 2 EPILEPSY AND THE SPIKE DETECTION PROBLEM
in logic') support the representation of knowledge [Charniak and McDermott 1985]. Other than common procedural programming languages, Prolog can deduce new facts from given knowledge and automatically find strategies to verify or falsify a fact in ques~ tion. Ramabhadran et
at.
[1999] improved the original system of Glover etat.
[1989] and achieved a sensitivity of 95.7 % and a selectivity of 88.9%1 with rule-based classification of mimetic features.2.3.9 Wavelet-Based Approaches
In order to locate ETs in an EEG signal it is reasonable to use a filter that approximates a single spike like a template. If the filter is chosen such that it also features zero mean and good localization in the frequency domain it can be considered to be a wavelet filter. Wavelet-based approaches make use of either the continuous wavelet transform
(CWT) or the discrete wavelet transform (DWT).
Approaches presented in this section are based on wavelet methods introduced in the following chapter.
The Mexican hat wavelet (Fig. 2.3(a)) was used by Schiff et al. [1994b] to analyze
0.3 0.3
0.2 0.2
0.1 0.1
-0.1 -0.1
-5 -2.5 2.5 5 -5
(a) (b) (c)
Figure 2.3 (a) Mexican hat wavelet used by Schiff et al [1994a], (b) cubic spline approximation of Mexican hat wavelet used by Schiff et al [1994b] and (c) wavelet by Senhadji et al [1995J. Dotted line shows imaginary part.
data from patients with implanted subdural electrodes. Several spikes and the onset of a seizure could be seen in a series of transforms they calculated using dyadic scales and translations. The same events could not be identified in Fourier spectrograms using various window lengths. A reasonable approximation to the Mexican hat function was acquired by cubic spline interpolation of three points (maximum and both minima of the original wavelet '!/J(t), Fig. 2.3(b)). This interpolation allowed the application of a faster algorithm while achieving the same results. Processing time went down from 3 days on a Sun workstation to 3-25 s on a Macintosh. They used a 'random surrogate data set' which had the same power spectrum as the original signal in order to define
2.3 AUTOMATIC DETECTION OF INTERICTAL SPIKES IN THE EEG 21
the threshold for non-random events in each scale at 1.96 standard deviations (ca. 95% confidence level, assuming a Gaussian distribution) above the average.
Schiff et al. [1994a] also used a two-dimensional variation of the Mexican hat wavelet as a spatial filter to localize the area of seizure onset. Since subdural electrodes were arranged in a regular 5 by 5 grid, the 2D Mexican hat wavelet could be employed as a spatial centre-surround filter on that grid, a procedure similar to estimation the radial current source density (CSD) with the surface Laplacian [Perrin et al. 1987] (see Chapter 6 for more details of the spatial analysis). Both methods give a more localized measure of brain activity than the original potential recordings. In contrast to the CSD, the wavelet method allows the observation of different scales. Three scales of the 2D Mexican hat wavelet were suggested and the smallest scale was finally applied. The electrodes that corresponded to the onset of a clinical seizure were readily identified with this method.
Mehta et al. [1994] examined the variances of wavelet coefficients of three data sets corresponding to normal activity, seizure onset and ongoing seizure. During normal activity a scale-invariant property of the variances was observed indicating an lmder-lying 1/
f
or 1/r"-
process. This feature disappeared during seizure activity. They proposed monitoring variations in the variance structure of the wavelet coefficients to detect the onset of seizure activity.Kalayci and Ozdamar [1995] used the DWT of clinical EEG recordings containing spike and slow wave complexes to reduce the input size of an ANN within a multistage system for spike detection. Transient waveforms were classified by to two EEGers. The Daubechies-4 and Daubechies-20 wavelets were used in the DWT of a 512 sample (5.12 s) window centered around the transients [Daubechies 1988]. Eight wavelet coef-ficients of single scales and combinations of scales were used for training (1200 data sets) and testing (2414 data sets) the ANN. They interpreted their results as a 'drastic decrease of the input size of the ANN, without much compromise in its performance'. The best (not the average) resulting sensitivities and selectivities are listed and com-pared to the performance achieved with 20 (or 30) raw samples used for training the ANN. The results appear, however, to depend rather on the input size itself than on the application of the wavelet preprocessing proposed [Kalayci et al. 1994, Kalayci and ()zdamar 1995].
Senhadji et al. [1995] applied the CWT to detect EDs in EEG recordings and proposed the wavelet 'lj;(t) (1
+
cos(21f fot)) . ei27rkjot withIt I :::;
and integerk =1= {-1,0,1}. Fig. 2.3(c) shows this wavelet for k = 2, the smallest positive value
and scaling factor fo 1. They compare a weighted sum of the squared coefficients obtained by the CWT for a predefined set of scales to a threshold Al to detect transients in all channels:
n
22 CHAPTER 2 EPILEPSY AND THE SPIKE DETECTION PROBLEM
0.3,---~~~~-~-,
0.2~
0.1 f
01
-0.1
-0.2
~L-_~2--_~1~--~~~
(a) (b)
Figure 2.4 (a) Morlet's wavelet (wo 5) used by Clarencon et al. [1996] and (b) Polynomial wavelet used by D'Attelis et al. [1997].
with weight factors ai and wavelet coefficients Da,n' 862 out of982 EDs (88%) in several clinical EEG recordings were detected by this method together with 206 artifacts and 46 'pathological events' (events not relevant to epilepsy). A second stage of their system dropped 147 (68%) of the artifacts and ~2 (2.5%) of the EDs. EDs were mapped on a 3D model of the patient's head. A series of maps and an animated map was used to display the evolution of potentials [Senhadji
et
al. 1994, Senhadjiet
al. 1995].Clarencon
et
al. [1996] presented a real-time implementation of the CWT of 8-channel EEG using a digital signal processor (DSP). They applied Morlet's wavelet('ljJ(t) = eiwot . e-t2/2 with Wo = 5, Fig. 2.4(a)) in dyadic scales and added three scales
linearly between the dyadic ones (a total of 25 scales). Examples of spikes and seizures in animal EEG show broad energy distributions of a conical shape in the correspond-ing scalograms. The presence of an epileptic spike was characterized by an energy concentration between 10 and 15 Hz in the scalogram.
D' Attelis
et
al. [1997] applied a polynomial spline wavelet (Fig. 2.4(b)) for the DWT of EDs found in depth recordings of patients candidate to surgical treatment. For each scale they defined a detection threshold D =as
+
(J with the averageas
and the standard deviation a of the energy of the wavelet coefficients in an 8 s period. Spikes appear in the scale level j = -3 which corresponds to a frequency range of 16 - 32 Hz. Waves following the spikes are represented by the scale level j -5 with a frequency range of 4 - 8 Hz.Sartoretto and Ermani [1999] used only a single scale of the DWT with the Daubechies-3 wavelet (16-Daubechies-32 Hz bandpass) to analyze 79 min of bipolar 8-channel EEG. The back-ground activity was estimated from a 5 s epoch. Less than 5% of the recording time were marked by the system while 96% of EDs were detected.
![Figure 1.5 System for electrode placement proposed by [1958].](https://thumb-us.123doks.com/thumbv2/123dok_us/9958139.497064/22.569.144.427.463.730/figure-electrode-placement-proposed.webp)


![Figure 3.15 filters: Mexican Relative bandwidth Q over time-frequency bandwidth product (47rUWf)2 of wavelet hat [H], Morlet [MJ, modulated B-spline [B] and binomial kernel [K]](https://thumb-us.123doks.com/thumbv2/123dok_us/9958139.497064/55.569.199.386.103.274/figure-mexican-relative-bandwidth-frequency-bandwidth-modulated-binomial.webp)


