(EMU ) that is typically manually programmed using an engine dynamometer to obtain desired levels of power, emissions and e ciency. Closed-loop control of an engine dynamometer and EMU, com-bined with an overall engine tuning algorithm, is used to automate the tuning of the engine map for a four-cylinder engine. The tuning algorithm determines the air-to-fuel ratio necessary for each region of engine speed and throttle position to obtain the desired performance, automatically moving to each operating region in the map. Preliminary automated tuning results produce power output curves comparable with those delivered using the original manufacturer tuned EMU. At lower engine speeds data ltering is required and results in power outputs slightly lower than the factory-tuned engine. At higher speeds small improvements in engine e ciency, for equivalent performance, can be found. The research presented clearly demonstrates that engine tuning to a very high standard, equivalent to original equipment manufacturer engine performance, can he successfully automated, saving time and adding consistency to the engine tuning process.
Keywords: control, automation, engine tuning, dynamometer, engine management, engine map
1 INTRODUCTION increased emissions of hydrocarbons and CO. Too little
fuel can result in engine damage such as burnt exhaust valves. The amount of fuel supplied is controlled by the Engine management units (EMUs) are digital processors
EMU, which controls the frequency and pulse width of that actively control fuel ow and ignition timing to
the fuel injectors. At steady state, constant engine speed ensure optimal engine operation and are employed in
the pulse width is calculated from a combination of three most modern fuel injected engines. Engine tuning plays
inputs: ambient air temperature, the inlet manifold air a vital part in ensuring that the EMU is programmed so
pressure (MAP) and user-de ned volumetric e ciency that the engine performs well under a variety of
con-correction factors ( VECFs). ditions. The manufacturer-developed EMU parameters
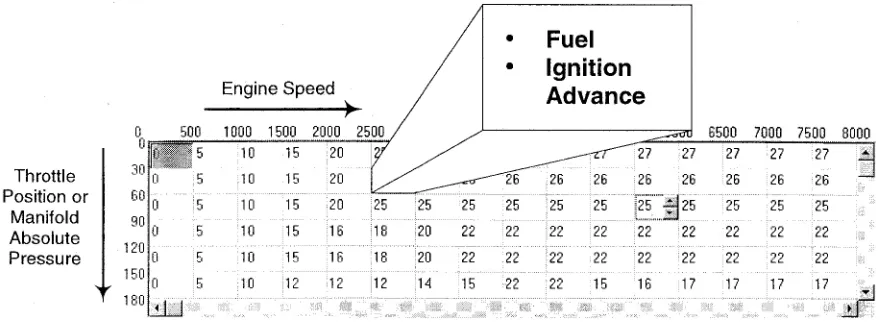
A typical engine has a two-dimensional plane of are typically developed to meet design compromises
steady state operating points with engine speed along between performance, market and legislative speci
ca-the horizontal axis and throttle position or MAP along tions, particularly with regard to emissions.
After-the vertical axis, as shown in Fig. 1. Each of After-these points market EMUs are available to replace a damaged unit,
has di ering requirements for fuel and ignition timing. to achieve speci cations di erent to those used by the
Most EMUs divide this plane up into nite rectangular manufacturer, to enhance the operation of an engine
elements, commonly referred to as ‘zones’, that make up intended for use both on land and in a marine
environ-an ‘engine map’ environ-and where each zone has environ-an associated ment or to enable the tuning and enhanced performance
user-de ned VECF. The engine map acts as a look-up of a modi ed engine.
table for operating parameters used by the EMU to con-The air–fuel (A/F) ratio is important in the
combus-trol engine operation. tion and tuning processes. If there is too much fuel, not
Currently, engine tuning is typically performed by a all the fuel is burnt, causing high fuel consumption and
skilled technician who manually adjusts the operating parameters for each zone of the engine map on a dyna-The MS was received on 3 January 2002 and was accepted after revision
for publication on 6 August 2002. mometer or while driving. The engine is tuned to the * Corresponding author: Department of Mechanical Engineering,
desired speci cation for each zone in which the engine University of Canterbury, Private Bag 4800, Christchurch, New Zealand.
Fig. 1 Structure of the engine map
time consuming, creating the potential for signi cant mation to enhance engine performance, rather than automating EMU controller design. Engine tuning to time savings, additional repeatability and more accurate
results via automation. meet speci c performance criteria is typically performed largely by hand via a combination of experience, science The primary goal of this research is the automation
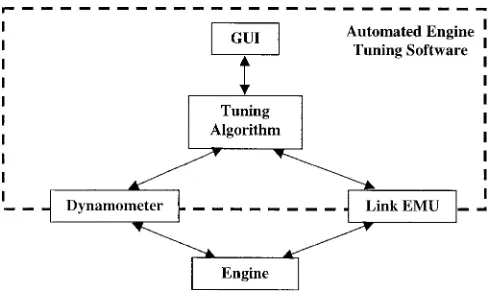
of the engine tuning process via engine tuning software and art. No references were found speci cally addressing automation of the engine tuning process, although there that communicates with both the dynamometer
control-ler and the EMU to create a closed-loop engine tuning is some prior research that generally references the possibility of performing this task [5].
system. The engine tuning algorithm that governs the
process is designed to optimize automatically the engine The following sections address the test system and software developed to enable the automated tuning of control parameters for each operating zone, to achieve
performance in accordance with user-de ned speci ca- an EMU using an engine dynamometer and the basic tuning algorithms developed. Subsequent sections test tions. In addition, the software ensures that potentially
damaging situations are detected and responds by plac- one of these tuning methods, compare the performance obtained with that provided by the manufacturer’s EMU ing the engine in a non-damaging state, sounding an
alarm and pausing the process until the problem can be and summarize the results and conclusions. corrected. This second requirement ensures that the
pro-cess can be run largely unsupervised. Finally, the
auto-2 AUTOMATED ENGINE TUNING TEST mation process, and the speci c software developed,
SYSTEM AND SOFTWARE adds both speed and consistency to the engine tuning
process.
The after-market EMU employed is developed by The experimental automated engine tuning system is tested on a 1992 Toyota 3S-GE engine from a Toyota Link Electro-Systems of Christchurch, New Zealand.
This EMU along with the PCLink control and communi- MR2. This four-cylinder engine has two overhead cam-shafts, displaces 1998 cm3and generates manufacturer-cation software is used to control the engine. A
servo-controlled Froude-Consine hydraulic dynamometer is listed peak outputs of 121 kW at 6800 r/min and 191 N m at 4800 r/min. Load is applied to the engine via employed for the tuning process. The automated tuning
algorithm comprises software designed to interface with, a servo-controlled Froude-Consine hydraulic dyna-mometer that is controlled by a Test Automation and control, these two units for the end purpose of
tuning the Link EMU parameters for every usable zone TA2000 controller interfaced with a PC-based data acquisition system utilizing an Advantech PCL-818 ana-of engine map.
Engine tuning is a well-known art documented in a logue-to-digital converter (ADC ) card. The test bed is set up so that either the original Toyota EMU or the variety of texts on the topic of internal combustion
engine performance [1]. Prior research in the area of Link EMU can control the engine. The dynamometer and Link EMU are independently controlled via a PC automated engine tuning is scarce with most research in
the area of automated engine tuning focusing on mod- program to close the loop on the engine tuning process. Speci cally, the engine dynamometer and controller ifying speci c engine functions, such as spark ignition,
to enhance performance while the vehicle is in operation set and deliver values for engine speed, torque and throttle position. The Link EMU can deliver values for [2,3]. Other works focus on systems to adaptively
[image:2.564.63.503.53.217.2]auto-information about the engine operation, displaying par- values of l slightly greater than 1.0 tend to increase ameters such as desired engine speed, actual engine e ciency, up to a point, as the engine runs leaner. speed, torque, power, fuel owrate and ignition advance. Ignition timing was initially tuned in the base map and The software is developed using Borland C++ not considered in this tuning process. Since changes to Builder version 4.0. The overall closed-loop system this variable are easily added as a second step, it was architecture and communication links created are illus- not considered until an understanding of the e ect of trated in Fig. 2, where the broken line encloses the automation on tuning lwas performed.
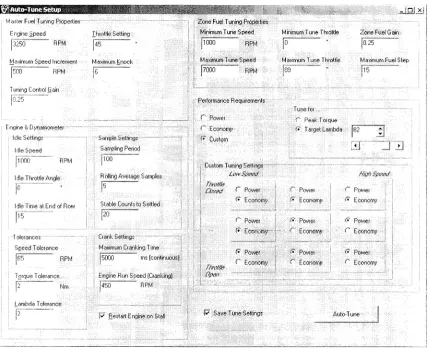
software communication links created to close the loop Several algorithms for engine tuning to meet speci ed on the tuning process. Figures 3 and 4 show the status performance requirements can be developed, imple-window and tuning set-up imple-window for the user interface. mented and tested using performance speci cations The speci c software structure consists of three pri- developed by any method. Two basic approaches tune mary C++ classes. Two classes handle commands for for either maximum torque or a speci c target stoichio-the EMU and dynamometer. A third class of low-level metricl sensor reading (air–fuel ratio), enabling tuning control functions enables closed-loop engine tuning, for performance or economy, as desired.
facilitating control of the separate dynamometer and There are two primary steps for each of the automated EMU systems by a single global entity on the PC. More tuning algorithms:
speci cally, these functions enable ‘get’ and ‘set’
com-1. Tune the master fuel setting. mands for quantities including fuel, master level, throttle
2. Tune the fuel setting for each of the zones that can position, torque, power, ignition advance, l sensor,
be tested. knock sensor, temperature, dynamometer engine speed,
EMU sensed engine speed and the active zone. Further The master fuel setting is a global multiplier for every fuel setting in the engine map. The higher the master commands and functions are used to determine whether
the system is running, whether engine speed has stabil- fuel value, the higher the fuel input for every zone. This value is tuned to move every zone in the engine map ized in a zone and communication of these values to and
from the global tuning function. collectively to a region close to the desired performance. Once the master fuel value is set, the engine map is ne In order to allow the engine to start and run, the Link
EMU is programmed prior to installation with a basic tuned by individually tuning each zone. The master fuel is automatically set by the automated tuning software fuel and ignition con guration, referred to as the base
while running the engine at approximately 50 per cent of maximum engine speed and 50 per cent throttle, before speci c automated tuning of each zone. Hence, the tuning algorithms all have two essential steps, an initial approximation using the master fuel setting and speci c tuning of each operating zone in the engine map. The engine is commanded to operate in the centre of the zone, for each zone tuned. Since each zone in the Link EMU is 500 r/min wide and 30°of throttle position high, the engine is operated from 250 r/min at 15° throttle in 500 r/min and 30°steps. Note that these steps are xed by the Link EMU; however, zone size in general is a trade-o between engine map size and complexity, and the resolution required. It is important to note that
[image:3.564.31.276.568.715.2]Fig. 3 Automated engine tuning status window
Fig. 4 Automated engine tuning set-up window
operate at 250 or 10 000 r/min, for example. The auto- In the tuning process the engine is rst incremented in speed over the entire row for a given throttle position. mated system tunes the engine for each zone that is
[image:4.564.123.444.51.273.2] [image:4.564.69.498.304.653.2]fuel supplied to the engine and logs the resulting torque ition, the system times out, automatically skips the zone
output, while leaving ignition advance unchanged from and moves to the next row of throttle positions.
the base map for this study. For example, when the fuel supply is increased, torque comes to a peak and then drops o , and the upper limit for fuel supply can be 3.1 Tuning for target air–fuel ratio
determined for that zone. This limit makes fuel sampling This tuning method uses the factorylsensor to monitor iterative, as the fuel value associated with the peak the amount of oxygen present in the exhaust gases and torque value must be found by rst passing over the hence the air–fuel ratio. The goal is to tune the EMU peak and then locating it via a simple peak detection for peak torque while holding a constant l value to a routine with a tolerance of 1 per cent, or approximately small range around 1.0. The algorithm illustrated in 1.5 N m at peak torque.
Fig. 5 implements a simple proportional control system Simple data smoothing is also performed so that spuri-on both the master fuel setting and each of the zspuri-one fuel ous samples do not signi cantly a ect the results. The settings to perform this task. The control gain, K, end results are passed back to the overall controller and controls the rate at which the actual air–fuel ratio put into the engine map and the tuning algorithm is approaches the speci ed level. incremented to the next zone where the process is This simple linear proportional control system is repeated. The automated software controlling the pro-extremely e ective in terms of its settling time and the cess handles moving from zone to zone. These basic steady state error. In testing, the most appropriate gain process steps are essentially the same as those for the for this system was found to be 0.25; however, the system targetlmethod.
can be easily modi ed to nd the best value adaptively. Any positive value less than 1.0 should lead to steady
convergence. The controller implemented has a slight 3.3 Data ltering non-linearity owing to a limiter placed on the change in
controller output, to limit the amount the fuel can be The Test Automation TA2000 unit employs a simple controller to o er throttle position, constant speed and changed in any given step of the algorithm. Figure 6
shows the basic steps taken in this tuning process. constant torque control modes. This controller should normally control the dynamometer to within 10 r/min; During testing of this algorithm a tolerance of±2 per
cent on the target l sensor measurement is employed. however, during the tests it only held engine speed to within 30–60 r/min. The inability to hold engine speed Higher tolerances produce signi cant deviations from
the target performance and lower tolerances make con- tightly leads to sizeable speed uctuations, particularly at low speed; however, it also presents a worst-case test vergence di cult. Tolerances can be modi ed via the
user interface for any system hardware. situation for automated engine tuning.
[image:5.564.89.475.632.713.2]Fig. 6 Basic process steps for targetlcontroller
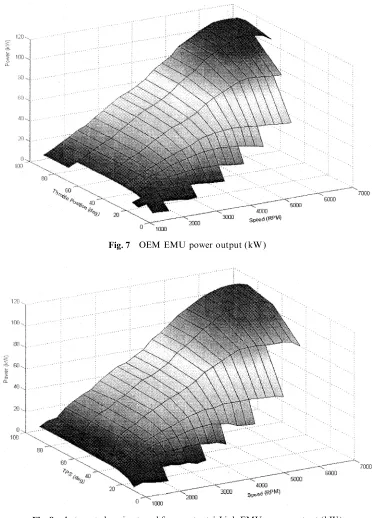
To address these issues, simple digital low pass lters results. The automated engine tune experiences a slight are applied to smooth large variations in the data stream. tapering o in power soon after the peak output, while The dynamometer is sampled by the ADC at 3 kHz and the factory EMU retained peak power for a more is set up to average the data in lots of 50–100 samples. extended period. The maximum power was between 110 To increase the smoothness further, a rolling average is and 115 kW for each map, approximately 7 per cent performed using ve ltered samples at a time. This l- lower than the manufacturer-listed value of 121 kW, tering is applied to the engine torque, engine speed and perhaps owing to age and wear.
oxygen sensor outputs. This approach low pass lters At lower engine speeds, variations of ±5 kW occur the data ranging from 0 to 12–60 Hz, depending on the owing to speed control issues with the dynamometer. exact ltering employed. Hence, interactions with dyna- When the dynamometer cannot hold the speed tightly, mometer dynamics in the 30 Hz range are possible small changes in fuel input result in larger variations in although no indications were noted as the implemented l, presenting a more di cult control problem. At higher ltering keeps data bandwidth under 30 Hz. speeds, theltuning procedure resulted in equivalent or slightly greater power output values. Overall, the auto-mated engine tune using constantlresults in very similar
4 TESTING, RESULTS AND DISCUSSION torque and power performance to that of the OEM
EMU. The OEM EMU is probably tuned for l=1.0, except at high speeds where fuelling may be increased to The user interface code was modi ed so that, each time
something approachingl=0.9 to improve top end per-the status screen is updated, per-the information displayed
formance. In contrast, the automated l tune method is also logged to a le. It was not possible to obtain the
tunes this value to be within±2 per cent ofl=1.0 for same level of information from the OEM EMU as from
all zones. However, the torque and power results are the Link EMU, making some comparisons di cult. To
very similar to the OEM graphs and it is possible, with illustrate and prove the concept of automated engine
some added complexity, to tune each zone for a di erent tuning, the engine is tuned for a constantlvalue using
target l value to mimic, more exactly, the basic OEM the Link EMU, and the resulting performance compared
tuning process. with the OEM EMU for torque and power.
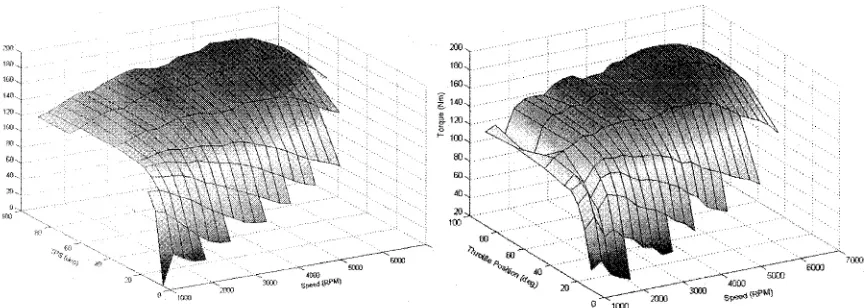
The torque surfaces in Fig. 9 show the relatively at Figures 7 and 8 show the resulting performance for
torque curve associated with this engine for both the the Toyota EMU and the automated engine tune
respect-automated engine tune and manufacturer’s EMU test ively. These gures show the engine map in the
hori-results. Maximum torque output was approximately zontal plane with power on the vertical axis. The
180 N m at 5500 r/min for the OEM map using the exact maximum power for thisl-tuned engine map is
consist-data, with the automatically tuned results within 2 per ently achieved around 6750 r/min, matching the
[image:6.564.119.445.50.293.2]Fig. 7 OEM EMU power output (kW )
Fig. 8 Automated engine tuned for constantlLink EMU power output (kW )
automated engine tuning achieved the smoothest result of this 1992 engine. The overall result is that the auto-mated engine tuning concept is very close, at a rst trial, was in the top half of the engine speed range around the
maximum torque values, where the dynamometer holds to the OEM tune in terms of peak torque, meeting the aims of this project and proving the basic concept. the engine speed more tightly. This result is due to the
dynamometer controller delivering steady motion with As expected, the manufacturer’s EMU is programmed to achieve a high level of performance from the engine. tight speed control more rapidly at higher speeds. At
lower engine speeds the impact of variation in speed The automated engine tune results in essentially equival-ent performance to the manufacturer-listed speci ca-control, as a percentage of the total, and the size of the
engine map zones are evident in the less smooth result tions. Greater engine speed resolution of the engine map at lower engine speeds and throttle settings would limit for the automated engine tune. The peak torque values
[image:7.564.95.470.50.568.2]Fig. 9 OEM torque output (N m, left) and automated constantltuned EMU torque output (N m right)
increments and steps of this size at engine speeds around resulting performance of a high standard is illustrated. 1500 r/min represent signi cant changes in engine Automation eliminates the requirement for full-time operating condition. However, greater engine speed reso- oversight by skilled technicians and engineers. While the lution of the engine map would enable a smoother auto- tuning routines developed are simple, results from auto-matically tuned result. Greater engine speed resolution mated tuning of the Link EMU have reached a standard would also enable a potentially smoother, more optimal approaching that of the factory EMU for a much lower map to be obtained for this region and a potentially investment of time. Power and torque output data illus-better overall result. trate how the engine map can be tuned from a very The automated target l algorithm required approxi- rough base map to a polished result that enables smooth mately 30 min to complete. During this time, the centre operation over the entire engine operating range. Power of each Link EMU engine map zone was tuned for all and torque results for the automated engine tune are zones in the 500–7000 r/min range and in the 0°–90° reasonably similar to those obtained from the original throttle range, where the rst zone would be tuned at manufacturer EMU with some roughness at lower 750 r/min and 15°. Of all 48 operating zones available engine speeds. The entire tune took approximately in this region of the engine map, only 36 were attainable 30 min to deliver results and faster times could be by the test engine and the rest represented operating achieved with better dynamometer controller settings. conditions that the engine could not reach (e.g. These times are signi cantly faster than comparable 6750 r/min and 15° throttle). Here again, higher reso- hand-controlled tests at the same facility illustrating lution in the engine map may provide better results and the potentially large time saving available through greater exibility, particularly at lower engine speeds. automating these tests.
At Canterbury, an equivalent manual test, tuning These automated results are achieved through the 50–100 zones for greater resolution, would take approxi- development of independent software interfaces between mately 4 h. A very experienced technician could tune the a PC an engine dynamometer and an after-market EMU. equivalent 36 zones in as short a time as 1 h with a well- Further software encapsulates a global tuning algorithm known engine. Given better dynamometer controller using closed-loop feedback to command the system to tuning to hold engine speed to a far tighter tolerance, desired states and to tune the engine map. A graphical the engine tuning tests presented here would take user interface enables user input of tuning speci cations approximately 8–10 min, and an equivalent 50–100 zone for the entire map, each individual zone or larger regions test would take approximately 25–35 min. The increased of the engine map. There are also a variety of safety speed of the automated tune would result directly from shut-o s and automatic restarts included to minimize the ability to nd and hold the steady state engine speed the need for human intervention.
required, far more quickly than with the controller In summary, automated torque and target l engine tuned. In either case, automation of this process o ers tuning procedures are developed and theltune is tested. signi cant time savings. The system has the exibility to allow for further advancement in automated engine tuning. Areas where further work will have signi cant impact include the
5 CONCLUSIONS development of more sophisticated tuning algorithms
that include emissions control, thermal e ciency, ignition timing and exhaust systems. Other areas of The development of a closed-loop, automated engine
future research include tuning for dynamic conditions tuning system is demonstrated and the potential to
[image:8.564.69.501.51.205.2]