Abstract—This paper discusses the various Geofencing constructs and concepts. Constructs are concepts, models, or schematic ideas: In our case they are the theoretical constructs of the Geofence used as a Security Strategy Model. Our concept considers Location Based Services and RFID as central to the security of wireless network security. Therefore Location Based Service and RFID Technology emerge as key constructs. Using the Geofencing application framework an organisation can turn from less secure when it uses a wireless network to highly secure. The Geofencing application framework was developed with the projection that applying the concepts of statistical process control to wireless network security will encourage wireless network usage as a secure method of communication by organisations prone to war driving and hacking. This paper is divided into two parts. The first part is experimental work, in which field measurement trials were conducted in order to observe and collect Positioning Technology data - taking into account the different noises in the Test Bed environment and the measurement scenarios. The second part of this paper presents the experiment setup, components and positioning methodology with a brief description of future work for researchers and industry practitioners
Index Terms—Geofencing Security Engineering, Location Based Services, Mobile Device, Wireless Fidelity, Radio Frequency Infrastructure
I. INTRODUCTION
In this paper, we present a Wi-Fi network environment compliant with the IEEE protocol using the 802.11b. We organised this system using a client-server, access points, antennas and a laptop as client devices. We gathered position data using a control monitoring system and server in order to analyze and coordinate the various tasks. It was necessary to
Manuscript received (January 1, 2010). This work was supported in part by a grant from the Worshipful Company of Haberdashers UK and the free use of a Location Based Service Laboratory owned by AireTrak Ltd based At Huntingdon in the UK
A .C. Ijeh was with RSM Tennon, LLP, UK. He is now an Information Security Researcher with the University of East London, 4 – 6 University Way, London, E16 2RD, UK (Corresponding authors phone: +44(0)208-223-7778; e-mail: [email protected])
D .S. Preston is with the University of East London, 4 – 6 University Way, London, E16 2RD, UK (e-mail: [email protected])
C .O. Imafidon is with the University of East London, 4 – 6 University Way, London, E16 2RD, UK (e-mail: [email protected]).
T .B. Watmon is with the University of East London, 4 – 6 University Way, London, E16 2RD, UK (e-mail: [email protected])
A .O. Uwaechie is with Zenith Bank PLC (e-mail: [email protected])
M. Cooke is with Angle Technology PLC based at Surrey UK (email: [email protected])
P. Lancaster is with the National Physical Laboratory UK (email: [email protected])
A. Widdess is with the Location Based Service Laboratory of AireTrak Ltd UK (email: [email protected])
M. Soremekun was with Wake County in Raleigh-Durham USA (email: [email protected])
profile the mobile devices location and movement by access points and antennas to raise accuracy. The Location determination method was implemented on the basis of signal strength, using various factors to raise accuracy and the triangular surveying ability. Our method utilised the profile data of our laboratories server to correct the signal strength variation which is very large according to determination environments. The main task of the experiment was to collect location data in order to examine the overall performance of the positioning model under optimum to adverse operating conditions e.g. noise and interference. Several types of location data were collected and stored in different files. The organization of the experimental testing was carefully designed taking into consideration dynamic and static user measurement scenarios in urban, rural and open space navigation environments. In order to evaluate our Geofencing Security model, a dataset of a user’s movement is required. Our experiment will focus on the movement of a wireless laptop attached to an RFID tag whose movement together with that of its user is monitored through a wireless controller system. Our experiment will probably typically be used as a service in an office therefore the ideal dataset will be that from a room with office measurements, say like that of an open floor plan were hot desking can take place. Our experiment aims to generate movement on a pre-defined line within a pre-defined parameter. The environment in which the monitoring takes place is a Wi-Fi enabled open plan office (test bed) and has the necessary components for a laptop to connect to a wireless controller system. Our Geofencing Security Trust Model was developed as a result of the challenges that wireless networks face from the leakage of radio waves which they use to transmit their data. The project used Airetrak’s Huntingdon laboratory as its test bed and proved that Geofencing can be used as a security access measure for securing wireless networks. The Geofencing Security Trust Model is the result of two years work from concept to implementation. Funds were provided for the project by the Haberdashers Fund and the Emerald Fund and the project collaborated with Airetrak (An independent Wi-Fi tracking solutions company) to obtain Proof of Concept.
II. LOCATIONBASEDSERVICEINFRASTRUCTURE
The basis behind using Location Based Service technology is that the location of mobile devices has to adhere to international regulations. So for instance in the United States of America all wireless carriers must be able to reliably identify the location of 911 calls from mobile devices, this is commonly called the E911 mandate. In Europe the European Commission made similar recommendations for a set of location enhanced regulations called E112. For the purpose of this study it useful to mention the architecture that forms LBS; Firstly the databases, Secondly the mobile devices, Thirdly
Geofencing Security Engineering
Anthony .C. Ijeh, David .S. Preston, Chris .O. Imafidon, Titus .B. Watmon, Annette .O. Uwaechie,
the Positioning system, Fourthly the Wi-Fi network and last but not least the LBS provider.
III. MOBILEDEVICESPECIFICATION
Whilst snoopers are generally used for observing signal strengths of packets transmitted by the target machine, we didn’t use any in our experiment. In our experiment we used one laptop that runs windows Vista (Sony Vaio NR11S/S Notebook). Where a normal WLAN AP will only receive packets from associated stations our customized driver allowed us to listen to all traffic on any given channel. Also upon request it was able to switch channels, measure the target stations signal strength and switches back to resume normal network operations. We used this technique to allow the central server to perform tracking and communication at the same time. For training and testing we used a Sony Vaio NR11S/S laptop. Our laptop is monitored by a Wireless Controller System which uses a java program to communicate with the access points to collect signal strength measurements on packets observed from the target machine (our laptop). The Wireless Controller System needs sufficient memory and processing power to contain the pattern of our test bed.
IV. WIRELESSFIDELITYINFRASTRUCTURE
The basis behind using Wi-Fi technology is that the location of the mobile device e.g. (laptop) can be determined by the received signal strengths (RSS) from at least one access point. These signals commonly called beacons contain information stored as packets. The method of transmission can be either through access points that receive signals within their sphere and establish the position of the mobile device (laptop) or through signals from the access points which have their ID amongst other information. For indoor Geolocation applications, the service area is restricted to inside and the close vicinity of a building, and nowadays the building floor plan is normally accessible as an electronic document. The availability of electronic building floor plans is one of the features of indoor applications that can be exploited in positioning algorithms. For example, while tracking an MT in a building, with the aid of building floor plan situations involving crossing walls or jumping through floors can easily be identified and eliminated. Another unique feature of indoor applications is that the size of the coverage area is much smaller than outdoor applications. This makes it possible to conduct comprehensive planning of the placement of sensors
V. RADIOFREQUENCYIDENTITYINFRASTRUCTURE
The basis behind using RFID technology is that the technology is low power and low cost. The ranges of the frequency vary from low (100 – 500 KHz), intermediate (10 – 15 MHz) to high (2.4 – 5 GHz). The components of the RFID technology are the reader and the tag with both being able to exchange radio signals in a two way communication route. The technology works by the RFID reader being connected to a server and being used to communicate with an Active Tag (which have their own power and can read up to tens of meters) thus the proximate position of the RFID tag to a reader can be identified. The methods that can be used to perform this technique include; firstly by storing the serial
number that identifies the mobile device on the RFID using a microchip. Secondly by locating RFID readers used by mobile devices it follows that once the RFID enabled device moves into reading range then the position of the tag can monitored by the reader and thus an approximate position can be determined
VI. EVALUATING OUR RESOURCES AND TEST BED
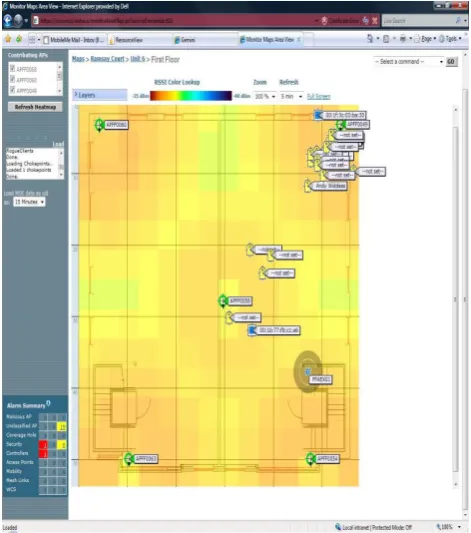
ascertained how the location of key data transmitted over the wireless network can be restricted to defined areas in order to enhance security. Figure 19 shows RFID tags all located within the predefined test bed, because of their location access can be granted to the devices which they are attached to. Also located are the icons used in our experiment which are located within the test bed (blue and red) and to which based on their location access was given to our wireless laptop.
VII. FIGURE AND TABLE DESCRIPTIONS
In this study which was an action research, the aim was to provide intervention to practical problems using a theoretical framework. Thereafter an application of the theoretical framework was implemented to test its ability to provide a practical solution using a host organisation for proof of concept. Furthermore the results are usable within organisation with similar infrastructure.
VIII. CONCLUSION
[image:3.595.315.547.49.207.2]A conclusion section is not required. Although a conclusion may review the main points of the paper, do not replicate the abstract as the conclusion. A conclusion might elaborate on the importance of the work or suggest applications and extensions.
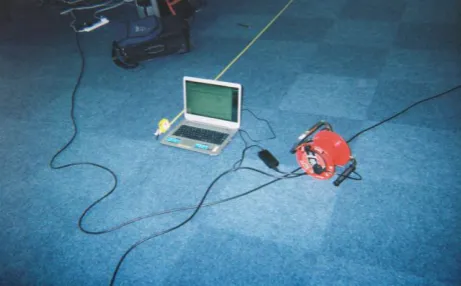
[image:3.595.319.545.233.469.2]Fig 1: Wireless Control System (WCS) for controlling and monitoring the movement of the mobile device
[image:3.595.57.291.422.568.2]Fig 2: Wireless Laptop being placed at the start of the defined track for walking by the user
[image:3.595.312.557.495.745.2]Fig 3: RFID Tag placed onto the Wireless Laptop
Fig 4: User walking along the defined track
Fig 5: Security Strategy Model Questionnaires being prepared for posting (1000) were sent out to businesses that
[image:3.595.57.288.608.751.2]Fig 6: Geofencing Security Strategy Trust Model Schema design.
[image:4.595.60.286.98.434.2]Fig 7: Electronic plan of test bed
Fig 8: Electronic plan showing RFID tag and Mobile device successfully taking the path of the defined walking
[image:4.595.315.548.331.438.2]track.
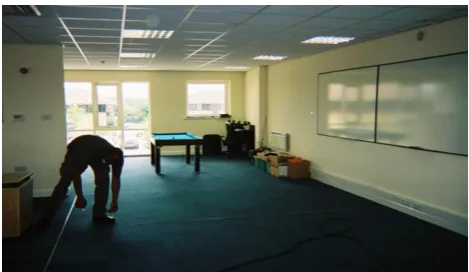
Fig 9: The volume of the Test bed on view
Fig 10: The Author marking the walking track
[image:4.595.314.549.464.600.2] [image:4.595.69.278.481.768.2] [image:4.595.318.546.626.765.2]Fig 12: A temperature thermometer on display
[image:5.595.65.284.213.326.2]Fig 13: A Team member of the project holding an RFID tag.
Fig 14: Project members collating data for analysis
Fig 15: Access Points shown by the Wireless Controller System
[image:5.595.319.545.214.320.2]Fig 16: RFID shown by the Wireless Control System
[image:5.595.321.545.348.469.2]Fig 17: Testing the RFID tags and mobile device.
Fig 18: Testing the WCS and Access Points
Fig 19: Identifying possible interference from other RFID tags
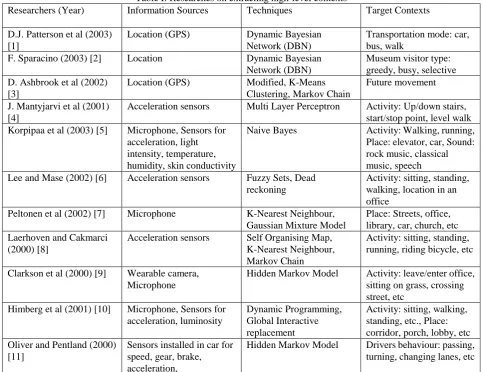
[image:5.595.62.285.363.470.2] [image:5.595.318.544.488.774.2] [image:5.595.56.292.494.761.2] [image:5.595.321.544.496.639.2]Table I: Researches on extracting high-level contexts
Researchers (Year) Information Sources Techniques Target Contexts
D.J. Patterson et al (2003) [1]
Location (GPS) Dynamic Bayesian Network (DBN)
Transportation mode: car, bus, walk
F. Sparacino (2003) [2] Location Dynamic Bayesian Network (DBN)
Museum visitor type: greedy, busy, selective D. Ashbrook et al (2002)
[3]
Location (GPS) Modified, K-Means Clustering, Markov Chain
Future movement J. Mantyjarvi et al (2001)
[4]
Acceleration sensors Multi Layer Perceptron Activity: Up/down stairs, start/stop point, level walk Korpipaa et al (2003) [5] Microphone, Sensors for
acceleration, light intensity, temperature, humidity, skin conductivity
Naive Bayes Activity: Walking, running, Place: elevator, car, Sound: rock music, classical music, speech Lee and Mase (2002) [6] Acceleration sensors Fuzzy Sets, Dead
reckoning
Activity: sitting, standing, walking, location in an office
Peltonen et al (2002) [7] Microphone K-Nearest Neighbour, Gaussian Mixture Model
Place: Streets, office, library, car, church, etc Laerhoven and Cakmarci
(2000) [8]
Acceleration sensors Self Organising Map, K-Nearest Neighbour, Markov Chain
Activity: sitting, standing, running, riding bicycle, etc Clarkson et al (2000) [9] Wearable camera,
Microphone
Hidden Markov Model Activity: leave/enter office, sitting on grass, crossing street, etc
Himberg et al (2001) [10] Microphone, Sensors for acceleration, luminosity
Dynamic Programming, Global Interactive replacement
Activity: sitting, walking, standing, etc., Place: corridor, porch, lobby, etc Oliver and Pentland (2000)
[11]
Sensors installed in car for speed, gear, brake, acceleration,
Hidden Markov Model Drivers behaviour: passing, turning, changing lanes, etc
REFERENCES
[1] Patterson, C.A., Muntz, R.R., and Pancake, C.M., (2003) ―Challenges in Location aware Computing,‖ IEEE Pervasive Computing, vol. 2, no. 2, pp. 80-89, [2] Sparacino, F., (2003) ―Sto(ry)chastics: a Bayesian
Network Architecture for User Modelling and Computational Storytelling for Interactive Spaces,‖ Proceedings of the Fifth International Conference on Ubiquitous Computing, pp. 54-72, Seattle, WA, October 2003.
[3] Ashbrook D and Starner T (2002) ―Learning Significant Locations and Predicting User Movement with GPS‖ Proceedings of IEEE Sixth International Symposium on Wearable Computing, Seattle, WA October 2002. [4] Mantyjarvi, J., Himberg, J., and Seppanen, T., (2001)
―Recognizing Human Motion with Multiple Acceleration Sensors,‖
[5] Korpipaa, P., Koskinen, M., Peltola, J., Satu-Marja M., and Seppanen, T., (2003) ―Bayesian Approach to Sensor-based Context Awareness,‖ Personal and Ubiquitous Computing, vol. 7, pp. 113-124,
[6] Lee, S.-W and Mase, K., (2002) ―Activity and Location Recognition Using Wearable Sensors,‖ Pervasive Computing
[7] Peltonen, V., Tuomi, J., Klapuri, A., Huopaniemi, J., and Sorsa, T., (2002) ―Computational Auditory Scene Recognition,‖ Proceedings of International Conference on Acoustics Speech and Signal Processing
[8] Laerhoven, K.V. and Cakmarci, O., (2000) ―What Shall We Teach Our Pants‖
[9] Clarkson B, Mase and K, Petland, A, (2000) ―Recognizing User Context via Wearable Sensors‖ [10]Himberg, J, Korpiaho, K, Mannila, H, and Tikanmaki, J,
(2001) ―Time Series Segmentation for Context Recognition in Mobile Devices‖