Learning Where to Look: Modeling Eye Movements in Reading
Mattias Nilsson
Department of Linguistics and Philology Uppsala University
Joakim Nivre
Department of Linguistics and Philology Uppsala University
Abstract
We propose a novel machine learning task that consists in learning to predict which words in a text are fixated by a reader. In a first pilot experiment, we show that it is possible to out-perform a majority baseline using a transition-based model with a logistic regression classi-fier and a very limited set of features. We also show that the model is capable of capturing frequency effects on eye movements observed in human readers.
1 Introduction
Any person engaged in normal skilled reading pro-duces an alternating series of rapid eye movements and brief fixations that forms a rich and detailed be-havioral record of the reading process. In the last few decades a great deal of experimental evidence has accumulated to suggest that the eye movements of readers are reflective of ongoing language pro-cessing and thus provide a useful source of infor-mation for making inferences about the linguistic processes involved in reading (Clifton et al., 2007). In psycholinguistic research, eye movement data is now commonly used to study how experimental ma-nipulations of linguistic stimuli manifest themselves in the eye movement record.
Another related strand of research primarily at-tempts to understand what determines when and where the eyes move during reading. This line of research has led to mathematically well specified ac-counts of eye movement control in reading being instantiated as computational models (Legge et al., 1997; Reichle et al., 1998; Salvucci, 2001; Engbert
et al., 2002; McDonald et al., 2005; Feng, 2006; Reilly and Radach, 2006; Yang, 2006). (For a re-cent overview, see (Reichle, 2006).) These models receive text as input and produce predictions for the location and duration of eye fixations, in approxima-tion to human reading behavior. Although there are substantial differences between the various models, they typically combine both mechanisms of visuo-motor control and linguistic processing. Two impor-tant points of divergence concern the extent to which language processing influences eye movements and whether readers process information from more than one word at a time (Starr and Rayner, 2001). More generally, the models that have emerged to date are based on different sets of assumptions about the un-derlying perceptual and cognitive mechanisms that control eye movements. The most influential model so far, the E-Z Reader model (Reichle et al., 1998; Reichle et al., 2003; Pollatsek et al., 2006), rests on the assumptions that cognitive / lexical processing is the engine that drives the eyes through the text and that words are identified serially, one at a time.
Although eye movement models typically have parameters that are fitted to empirical data sets, they are not based on machine learning in the standard sense and their predictions are hardly ever tested on unseen data. Moreover, their predictions are nor-mally averaged over a whole group of readers or words belonging to a given frequency class. In this study, however, we investigate whether saccadic eye movements during reading can be modeled using machine learning. The task we propose is to learn to predict the eye movements of an individual reader reading a specific text, using as training data the eye
movements recorded for the same person reading other texts.
Predicting the eye movements of an individual reader on new texts is arguably a hard problem, and we therefore restrict the task to predicting word-based fixations (but not the duration of these fixa-tions) and focus on a first pilot experiment inves-tigating whether we can outperform a reasonable baseline on this task. More precisely, we present ex-perimental results for a transition-based model, us-ing a log-linear classifier, and show that the model significantly outperforms the baseline of always pre-dicting the most frequent saccade. In addition, we show that even this simple model is able to capture frequency effects on eye movements observed in hu-man readers.
We want to emphasize that the motivation for this modeling experiment is not to advance the state of the art in computational modeling of eye movements during reading. For this our model is far too crude and limited in scope. The goal is rather to propose a novel approach to the construction and evaluation of such models, based on machine learning and model assessment on unseen data. In doing this, we want to establish a reasonable baseline for future research by evaluating a simple model with a restricted set of features. In future studies, we intend to inves-tigate how results can be improved by introducing more complex models as well as a richer feature space. More generally, the machine learning ap-proach explored here places emphasis on modeling eye movement behavior with few a priori assump-tions about underlying cognitive and physiological mechanisms.
The rest of the paper is structured as follows. Sec-tion 2 provides a brief background on basic charac-teristics of eye movements in reading. The emphasis is on saccadic eye movements rather than on tempo-ral aspects of fixations. Section 3 defines the novel task of learning to predict fixations during reading and discusses different evaluation metrics for this task. Section 4 presents a transition-based model for solving this task, using a log-linear classifier to predict the most probable transition after each fixa-tion. Section 5 presents experimental results for the model using data from the Dundee corpus (Kennedy and Pynte, 2005), and Section 6 contains conclu-sions and suggestions for future research.
2 Eye Movements in Reading
Perhaps contrary to intuition, the eyes of readers do not move smoothly across a line or page of text. It is a salient fact in reading research that the eyes make a series of very rapid ballistic movements (called saccades) from one location to another. In between saccades, the eyes remain relatively stationary for brief periods of time (fixations). Most fixations last about 200-300 ms but there is considerable variabil-ity, both between and within readers. Thus, some fixations last under 100 ms while others last over 500 ms (Rayner, 1998). Much of the variability in fixation durations appears associated to processing ease or difficulty.
The number of characters that is within the re-gion of effective vision on any fixation is known as the perceptual span. For English readers, the per-ceptual span extends approximately four characters to the left and fifteen characters to the right of the fixation. Although readers fixate most words in a text, many words are also skipped. Approximately 85% of the content words are fixated and 35% of the function words (Carpenter and Just, 1983). Vari-ables known to influence the likelihood of skipping a word are word length, frequency and predictabil-ity. Thus, more frequent words in the language are skipped more often than less frequent words. This is true also when word length is controlled for. Simi-larly, words that occur in constrained contexts (and are thus more predictable) are skipped more often than words in less constrained contexts.
3 The Learning Task
We define a text T as a sequence of word tokens
(w1, . . . , wn), and we define a fixation sequence
F for T as a sequence of token positions in T
(i1, . . . , im) (1 < ik < n). Thefixation set S(F) corresponding toF is the set of token positions that
occur inF. For example, the text Mary had a lit-tle lambis represented byT = (Mary,had,a,little,
lamb); a reading of this text where the sequence of fixations is Mary – little – Mary – lamb is repre-sented by F = (1,4,1,5); and the corresponding
fixation set isS(F) ={1,4,5}.
The task we now want to consider is the one of predicting the fixation sequence F for a
spe-cific reading event E involving person P reading
text T. The training data consist of fixation
se-quencesF1, . . . , Fkfor reading events distinct from
E involving the same person P but different texts T1, . . . , Tk. The performance of a modelM is eval-uated by comparing the predicted fixation sequence
FM to the fixation sequenceFOobserved in a read-ing experiment involvread-ingP andT. Here are some
of the conceivable metrics for this evaluation: 1. Fixation sequence similarity: How similar
are the sequencesFM andFO, as measured, for example, by some string similarity metric?
2. Fixation accuracy: How large is the agree-ment between the sets S(FM) andS(FO), as measured by 0-1-loss over the entire text, i.e., how large is the proportion of positions that are either in both S(FM) and S(FO) (fixated to-kens) or in neither (skipped toto-kens). This can also be broken down into precision and recall for fixated and skipped tokens, respectively.
3. Fixation distributions: Does the model pre-dict the correct proportion of fixated and skipped tokens, as measured by the difference between|S(FM)|/|T|and|S(FO)|/|T|? This can also be broken down by frequency classes of words, to see if the model captures frequency effects reported in the literature.
These evaluation metrics are ordered by an implica-tional scale from hardest to easiest. Thus, a model that correctly predicts the exact fixation sequence also makes correct predictions with respect to the
set of words fixated and the number of words fixated (but not vice versa). In the same fashion, a model that correctly predicts which words are fixated (but not the exact sequence) also correctly predicts the number of words fixated.
In the experiments reported in Section 5, we will use variants of the latter two metrics and compare the performance of our model to the baseline of al-ways predicting the most frequent type of saccade for the reader in question. We will report results both for individual readers and mean scores over all readers in the test set. The evaluation of fixation se-quence similarity (the first type of metric) will be left for future work.
4 A Transition-Based Model
When exploring a new task, we first have to decide what kind of model to use. As stated in the introduc-tion, we regard this as a pilot experiment to establish the feasibility of the task and have therefore chosen to start with one of the simplest models possible and see whether we can beat the baseline of always pre-dicting the most frequent saccade. Since the task consists in predicting a sequence of different actions, it is very natural to use a transition-based model, with configurations representing fixation states and transitions representing saccadic movements. Given such a system, we can train a classifier to predict the next transition given the information in the current configuration. In order to derive a complete tran-sition sequence, we start in an initial configuration, representing the reader’s state before the first fixa-tion, and repeatedly apply the transition predicted by the classifier until we reach a terminal state, repre-senting the reader’s state after having read the entire text. At an abstract level, this is essentially the same idea as in transition-based dependency parsing (Ya-mada and Matsumoto, 2003; Nivre, 2006; Attardi, 2006). In the following subsections, we discuss the different components of the model in turn, including the transition system, the classifier used, the features used to represent data, and the search algorithm used to derive complete transition sequences.
4.1 Transition System
configurations. A configuration in the current sys-tem is a tripleC= (L, R, F), where
1. Lis a list of tokens representing the left
con-text, including the currently fixated token and all preceding tokens in the text.
2. Ris a list of tokens representing the right
con-text, including all tokens following the cur-rently fixated token in the text.
3. F is a list of token positions, representing the
fixation sequence so far, including the currently fixated token.
For example, if the text to be read is Mary had a little lamb, then the configuration
([Mary,had,a,little], [lamb], [1,4])
represents the state of a reader fixating the wordlittle after first having fixated the wordMary.
For any textT =w1. . . wn, we define initial and terminal configurations as follows:
1. Initial:C = ([ ],[w1, . . . , wn],[ ])
2. Terminal:C = ([w1, . . . , wn],[ ], F) (for anyF)
We then define the following transitions:1
1. Progress(n):
([λ|wi],[wi+1, . . . , wi+n|ρ],[φ|i])⇒
([λ|wi, wi+1, . . . , wi+n], ρ,[φ|i, i+n])
2. Regress(n):
([λ|wi−n, . . . , wi−1, wi], ρ,[φ|i])⇒
([λ|wi−n],[wi−n+1, . . . , wi|ρ],[φ|i, i−n])
3. Refixate:
([λ|wi], ρ,[φ|i])⇒([λ|wi], ρ,[φ|i, i])
The transition Progress(n) models progressive sac-cades of lengthn, which means that the next fixated
word isnpositions forward with respect to the
cur-rently fixated word (i.e., n−1 words are skipped). In a similar fashion, the transition Regress(n)
mod-els regressive saccades of lengthn. If the parameter
1We use the variablesλ,ρandφfor arbitrary sublists ofL, RandF, respectively, and we write theLandFlists with their tails to the right, to maintain the natural order of words.
nof either Progress(n) or Regress(n) is greater than
the number of words remaining in the relevant di-rection, then the longest possible movement is made instead, in which case Regress(n) leads to a terminal
configuration while Progress(n) leads to a
configu-ration that is similar to the initial configuconfigu-ration in that it has an emptyLlist. The transition Refixate,
finally, models refixations, that is, cases where the next word fixated is the same as the current.
To illustrate how this system works, we may con-sider the transition sequence corresponding to the reading of the textMary had a little lamb used as an example in Section 3:2
Init ⇒ ([ ], [Mary, . . . ,lamb], [ ])
P(1) ⇒ ([Mary], [had, . . . ,lamb], [1]) P(3) ⇒ ([Mary, . . . ,little], [lamb], [1,4]) R(3) ⇒ ([Mary], [had, . . . ,lamb], [1,4,1])
P(4) ⇒ ([Mary, . . . ,lamb], [ ], [1,4,1,5])
4.2 Learning Transitions
The transition system defined in the previous section specifies the set of possible saccade transitions that can be executed during the reading of a text, but it does not say anything about the probability of dif-ferent transitions in a given configuration, nor does it guarantee that a terminal configuration will ever be reached. The question is now whether we can learn to predict the most probable transition in such a way that the generated transition sequences model the behavior of a given reader. To do this we need to train a classifier that predicts the next transition for any configuration, using as training data the ob-served fixation sequences of a given reader. Before that, however, we need to decide on a feature repre-sentation for configurations.
Features used in this study are listed in Table 1. We use the notation L[i] to refer to the ith token
in the list L and similarly for R andF. The first
two features refer to properties of the currently fix-ated token. Length is simply the character length of the word, while frequency class is an index of the word’s frequency of occurrence in representative text. Word frequencies are based on occurrences in the Bristish National Corpus (BNC) and divided into
2We abbreviate Progress(n) and Regress(n) to P(n) and
Feature Description
CURRENT.LENGTH The length of the tokenL[1]
CURRENT.FREQUENCYCLASS The frequency class of the tokenL[1]
NEXT.LENGTH The length of the tokenR[1]
NEXT.FREQUENCYCLASS The frequency class of the tokenR[1]
NEXTPLUSONE.LENGTH The length of the tokenR[2]
NEXTPLUSTWO.LENGTH The length of the tokenR[3]
DISTANCE.ONETOTWO The distance, in tokens, betweenF[1]andF[2]
[image:5.612.96.516.54.179.2]DISTANCE.TWOTOTHREE The distance, in tokens, betweenF[2]andF[3]
Table 1: Features defined over fixation configurations. The notationL[i]is used to denote theith element of listL.
five classes. Frequencies were computed per million words in the ranges 1–10, 11–100, 101–1000, 1001– 10000, and more than 10000.
The next four features define features of tokens to the right of the current fixation. For the to-ken immediately to the right, both length and fre-quency are recorded whereas only length is con-sidered for the two following tokens. The last two features are defined over tokens in the fixa-tion sequence built thus far and record the history of the two most recent saccade actions. The first of these (DISTANCE.ONETOTWO) defines the sac-cade distance, in number of tokens, that led up to the token currently being fixated. The second (DISTANCE.TWOTOTHREE), defines the next most recent saccade distance, that led up to the previous fixation. For these two features the following holds. If the distance is positive, the saccade is progressive, if the distance is negative, the saccade is regressive, and if the distance amounts to zero, the saccade is a refixation.
The small set of features used in the current model were chosen to reflect experimental evidence on eye movements in reading. Thus, for example, as noted in section 2, it is a well-documented fact that short, frequent and predictable words tend to be skipped. The last two features are included in the hope of capturing some of the dynamics in eye movement behavior, for example, if regressions are more likely to occur after longer progressive saccades, or if the next word is skipped more often if the current word is refixated. Still, it is clear that this is only a tiny subset of the feature space that might be considered, and it remains an important topic for future research to further explore this space and to study the impact
of different features.
Given our feature representation, and given some training data derived from reading experiments, it is straightforward to train a classifier for predicting the most probable transition out of any configura-tion. There are many learning algorithms that could be used for this purpose, but in the pilot experiments we only make use of logistic regression.
4.3 Search Algorithm
Once we have trained a classifierf that predicts the
next transitionf(C)out of any configurationC, we
can simulate the eye movement behavior of a person reading the textT = (w1, . . . , wn)using the follow-ing simple search algorithm:
1. InitializeCto([ ],[w1, . . . , wn],[ ]).
2. WhileCis not terminal, applyf(C)toC.
3. ReturnF ofC.
It is worth noting that search will always terminate once a terminal configuration has been reached, even though there is nothing in the transition system that forbids transitions out of terminal configurations. In other words, while the model itself allows regres-sions and refixations after the last word of the text has been fixated, the search algorithm does not. This seems like a reasonable approximation for this pilot study.
5 Experiments
5.1 Experimental Setup
sec-Fixation Accuracy Fixations Skips
Reader # sentences Baseline Model Prec Rec F1 Prec Rec F1
a 136 53.3 70.0 69.9 73.8 71.8 69.0 65.8 67.4
b 156 55.7 66.5 65.2 85.8 74.1 70.3 80.4 75.0
c 151 59.9 70.9 72.5 82.8 77.3 67.4 53.1 59.4
d 162 69.0 78.9 84.7 84.8 84.7 66.0 65.8 65.9
e 182 51.7 71.8 69.1 78.4 73.5 75.3 65.2 69.9
f 157 63.5 67.9 70.9 83.7 76.8 58.7 40.2 47.7
g 129 43.3 56.6 49.9 80.8 61.7 72.2 38.1 49.9
h 143 57.6 66.9 69.4 76.3 72.7 62.8 54.3 58.2
i 196 56.4 69.1 69.6 80.3 74.6 68.2 54.7 60.7
j 166 66.1 76.3 82.2 81.9 82.0 65.0 65.4 65.2
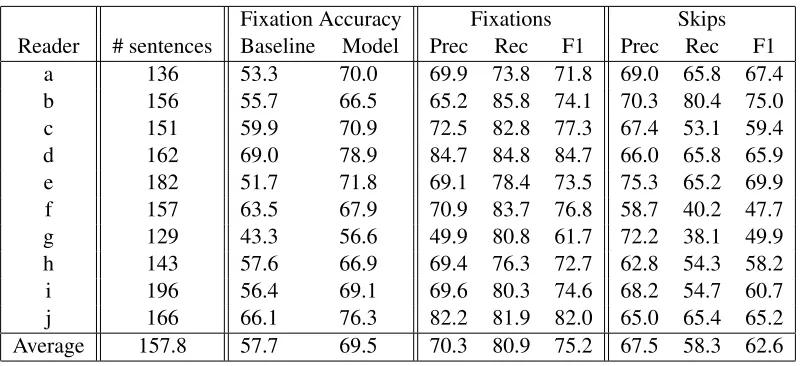
[image:6.612.107.508.52.235.2]Average 157.8 57.7 69.5 70.3 80.9 75.2 67.5 58.3 62.6
Table 2: Fixation and skipping accuracy on test data; Prec = precision, Rec = recall, F1 = balanced F measure.
tion contains the eye tracking record of ten partici-pants reading editorial texts from The Independent newspaper. The corpus contains 20 texts, each of which were read by all participants. Participants also answered a set of multiple-choice comprehension questions after having finished reading each text. The corpus consists of 2379 sentences, 56212 tokens and 9776 types. The data was recorded using a Dr. Bouis Oculometer Eyetracker, sampling the position of the right eye every millisecond (see Kennedy and Pynte, 2005, for further details).
For the experiments reported here, the corpus was divided into three data sets: texts 1-16 for training (1911 sentences), texts 17-18 for development and validation (237 sentences), and the last two texts 19-20 for testing (231 sentences).
Since we want to learn to predict the observed saccade transition for any fixation configuration, where configurations are represented as feature vec-tors, it is not possible to use the eye tracking data directly as training and test data. Instead, we simu-late the search algorithm on the corpus data of each reader in order to derive, for each sentence, the fea-ture vectors over the configurations and the tran-sitions corresponding to the observed fixation se-quence. The instances to be classified then consist of feature representations of configurations while the classes are the possible transitions.
To somewhat simplify the learning task in this first study, we removed all instances of non-local saccades prior to training. Progressions stretching
further than five words ahead of the current fixation were removed, as were regressions stretching further back than two words. Refixations were not removed. Thus we reduced the number of prediction classes to eight. Removal of the non-local saccade instances resulted in a 1.72% loss over the total number of in-stances in the training data for all readers.
We trained one classifier for each reader using lo-gistic regression, as implemented in Weka (Witten and Eibe, 2005) and default options. In addition, we trained majority baseline classifiers for all readers. These models always predict the most frequent sac-cadic eye movement for a given reader.
The classifiers were evaluated with respect to the accuracy achieved when reading previously unseen text using the search algorithm in 4.3. To ensure that test data were consistent with training data, sen-tences including any saccade outside of the local range were removed prior to test. This resulted in removal of 18.9% of the total number of sen-tences in the test data for all readers. Accuracy was measured in three different ways. First, we com-puted the fixation accuracy, that is, the proportion of words that were correctly fixated or skipped by the model, which we also broke down into precision and recall for fixations and skips separately.3
Sec-ondly, we compared the predicted fixation
distribu-3Fixation/skip precision is the proportion of tokens
tions to the observed fixation distributions, both over all words and broken down into the same five fre-quency classes that were used as features (see Sec-tion 4). The latter statistics, averaged over all read-ers, allow us to see whether the model correctly pre-dicts the frequency effect discussed in section 2.
5.2 Results and Discussion
Table 2 shows the fixation accuracy, and precision, recall and F1 for fixations and skips, for each of the ten different models and the average across all mod-els (bottom row). Fixation accuracy is compared to the baseline of always predicting the most frequent saccade type (Progress(2) for readers aand e, and
Progress(1) for the rest).
If we consider the fixation accuracy, we see that all models improve substantially on the baseline models. The mean difference between models and baselines is highly significant (p < .001, paired t -test). The relative improvement ranges from 4.4 per-centage points in the worst case (model of readerf)
to 20.1 percentage points in the best case (model of readere). The highest scoring model, the model of
readerd, has an accuracy of 78.9%. The lowest
scor-ing model, the model of readerg, has an accuracy of 56.6%. This is also the reader for whom there is the smallest number of sentences in the test data (129), which means that a large number of sentences were removed prior to testing because of the greater number of non-local saccades made by this reader. Thus, this reader has an unusually varied saccadic behaviour which is particularly hard to model.
Comparing the precision and recall for fixation and skips, we see that while precision tends to be about the same for both categories (with a few no-table exceptions), recall is consistently higher for fixations than for skips. We believe that this is due to a tendency of the model to overpredict fixations, especially for low-frequency words. This has a great impact on the F1 measure (unweighted harmonic mean of precision and recall), which is considerably higher for fixations than for skips.
Figure 1 shows the distributions of fixations grouped by reader and model. The models appear reasonably good at adapting to the empirical fixa-tion distribufixa-tion of individual readers. However, the models typically tend to look at more words than the readers, as noted above. This suggests that the
mod-els lack sufficient information to learn to skip words more often. This might be overcome by introducing features that further encourage skipping of words. In addition to word length and word frequency, that are already accounted for,n-gram probability could be
included as a measure of predictability, for example. We also note that there is a strong linear relation between the capability of fitting the empirical dis-tribution well and achieving high fixation accuracy (Pearson’sr: -0.91, as measured by taking the dif-ferences of each pair of distributions and correlating them with the fixation accuracy of the models).
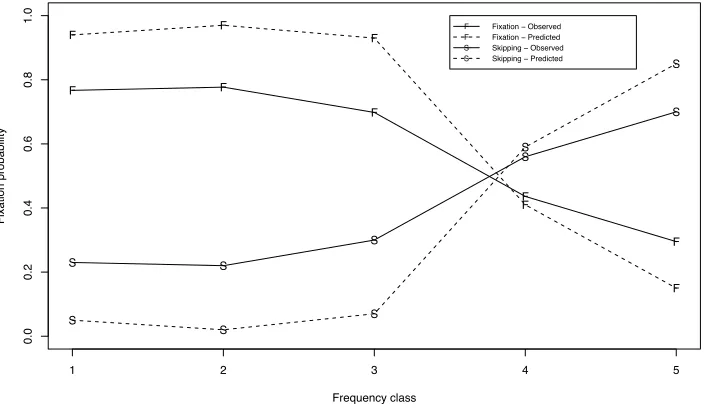
Figure 2 shows the mean observed and predicted fixation and skipping probability as a function of word frequency class, averaged over all readers. As seen here, model prediction is responsive to fre-quency class in a fashion comparable to the read-ers, although the predictions typically tend to exag-gerate the observed frequency effect. In the lower to medium classes (1–3), almost every word is fix-ated. Then there is a clear drop in fixation proba-bility for words in frequency class 4 which fits well with the observed fixation probability. Finally there is another drop in fixation probability for the most frequent words (5). The skipping probabilities for the different classes show the corresponding reverse trend.
6 Conclusion
In this paper we have defined a new machine learn-ing task where the goal is to learn the saccadic eye movement behavior of individual readers in order to predict the sequence of word fixations for novel reading events. We have discussed different evalua-tion metrics for this task, and we have established a first benchmark by training and evaluating a simple transition-based model using a log-linear classifier to predict the next transition. The evaluation shows that even this simple model, with features limited to a few relevant properties in a small context window, outperforms a majority baseline and captures some of the word frequency effects on eye movements ob-served in human readers.
algo-a b c d e f g h i j Reader Model
Proportion
0.0
0
.2
0.4
0
.6
[image:8.612.126.468.81.255.2]0.8
Figure 1: Proportion of fixated tokens grouped by reader and model
F F
F
F
F
1 2 3 4 5
0.0
0
.2
0.4
0
.6
0.8
1
.0
F F F
F
F
S S
S
S
S
S
S
S
S
S
Fixation probability
Frequency class
F F S S
Fixation ! Observed Fixation ! Predicted Skipping ! Observed Skipping ! Predicted
Figure 2: Mean observed and predicted fixation and skipping probability for five frequency classes of words
rithms. For example, given the sequential nature of the task, it seems natural to explore probabilistic sequence models such as HMMs (see for example Feng (2006)). With respect to evaluation, we need to develop metrics that are sensitive to the sequential behavior of models, such as the fixation sequence similarity measure discussed in Section 3, and in-vestigate to what extent results can be generalized
[image:8.612.126.478.330.535.2]References
Giuseppe Attardi. 2006. Experiments with a multilan-guage non-projective dependency parser. In Proceed-ings of the 10th Conference on Computational Natural Language Learning (CoNLL), pages 166–170. Patricia A. Carpenter and Marcel A. Just. 1983. What
your eyes do while your mind is reading. In Keith Rayner, editor,Eye movements in reading: Perceptual and language processes, pages 275–307. New York: Academic Press.
Charles Clifton, Adrian Staub, and Keith Rayner. 2007. Eye movements in reading words and sentences. In Roger van Gompel, editor,Eye movements: A window on mind and brain, pages 341–372. Amsterdam: Else-vier.
Ralf Engbert, André Longtin, and Reinhold Kliegl. 2002. A dynamical model of saccade generation in reading based on spatially distributed lexical processing. Vi-sion Research, 42:621–636.
Gary Feng. 2006. Eye movements as time-series random variables: A stochastic model of eye movement con-trol in reading. Cognitive Systems Research, 7:70–95. Alan Kennedy and Joël Pynte. 2005. Parafoveal-on-foveal effects in normal reading. Vision research, 45:153–168.
Gordon E. Legge, Timothy S. Klitz, and Bosco S. Tjan. 1997. Mr. Chips: An ideal-observer model of reading.
Psychological Review, 104:524–553.
Scott A. McDonald, R.H.S. Carpenter, and Richard C. Schillcock. 2005. An anatomically-constrained, stochastic model of eye movement control in reading.
Psychological Review, 112:814–840.
Joakim Nivre. 2006. Inductive Dependency Parsing. Springer.
J. Kevin O’Regan. 1979. Eye guidance in reading: Evi-dence for the linguistic control hypothesis.Perception & Psychophysics, 25:501–509.
Alexander Pollatsek, Erik Reichle, and Keith Rayner. 2006. Tests of the E-Z Reader model: Exploring the interface between cognition and eye movements. Keith Rayner. 1998. Eye movements in reading and
in-formation processing: 20 years of research. Psycho-logical Bulletin, 124:372–422.
Erik Reichle, Alexander Pollatsek, Donald Fisher, and Keith Rayner. 1998. Toward a model of eye movement control in reading. Psychological Review, 105:125–157.
Erik Reichle, Keith Rayner, and Alexander Pollatsek. 2003. The E-Z Reader model of eye-movement con-trol in reading: Comparisons to other models. Behav-ioral and Brain Sciences, 26:445–476.
Eric Reichle, editor. 2006. Cognitive Systems Research. 7:1–96. Special issue on models of eye-movement control in reading.
Ronan Reilly and Ralph Radach. 2006. Some empirical tests of an interactive activation model of eye move-ment control in reading. Cognitive Systems Research, 7:34–55.
Dario D. Salvucci. 2001. An integrated model of eye movements and visual encoding. Cognitive Systems Research, 1:201–220.
Matthew Starr and Keith Rayner. 2001. Eye movements during reading: some current controversies. Trends in Cognitive Sciences, 5:156–163.
Ian H. Witten and Frank Eibe. 2005.Data Mining: Prac-tical machine learning tools and techniques. Morgan Kaufmann.
Hiroyasu Yamada and Yuji Matsumoto. 2003. Statisti-cal dependency analysis with support vector machines. In Proceedings of the 8th International Workshop on Parsing Technologies (IWPT), pages 195–206. Shun-nan Yang. 2006. A oculomotor-based model of
![Table 1: Features defined over fixation configurations. The notation L [ i ] is used to denote the i th element of list L .](https://thumb-us.123doks.com/thumbv2/123dok_us/1304841.660297/5.612.96.516.54.179/table-features-dened-xation-congurations-notation-denote-element.webp)