Abstract—Medicine is composed by several components. The quality characteristic of medicine usually depends on the proportions of its components. The research studied the component proportions of medicine SIBELIUM capsule without considering its mixture amount and other process factors. Design points of symmetric-simplex design and design points generated by XVERT Algorithm are both discussed in the research. There are two quality characteristics of the medicine being considered. After collecting the data of the two designs and searched for their corresponding prediction equations, the two quality characteristics are optimized using desirability function. The research found the optimal component proportions of the two designs are pretty close and the optimal values of the two quality characteristics are almost the same.
Index Terms—Mixture Experiments, Desirability Function, Symmetric-Simplex Design, XVERT Algorithm.
I. INTRODUCTION
Pharmaceutical Industry is highly relied on the research and development of its products. The reduction of R&D cost and its R&D time can be very competitive for the company. Medicines are mixtures which can cure the disease and relief pain of the patients. The research of medicine has to consider both its process physics and its chemistry of human acceptability. The multiple quality characteristics of medicines and cost efficiency are major issues of medicine research.
Medicines are mixtures of multiple components. The component proportions are critical to the effectiveness of the medicine. Thus the quality characteristic of medicine depends on the proportions of components. The mixture experiments are especially useful for solving the problem of searching the optimal proportions of the components [2]. The research studied the component proportions of medicine SIBELIUM capsule using deigns of mixture experiments. Two quality characteristics were considered and collected data were analyzed by response methodology to find the prediction equations for each quality characteristic. Finally
Manuscriptreceived January 12, 2010. This work was supported by the National Scientific Foundation of Taiwan under Grant NSC 98-2221-E-218-026
P. W. Author is with the Southern Taiwan University of Technology., Tainan, 710, Taiwan. (e-mail:[email protected])
J. F. Author is with the Southern Taiwan University of Technology., Tainan, 710, Taiwan. (phone: 886-6-2533131 ext 4136; e-mail:
the optimal component proportions were found through desirability function. The research only studied the component proportions for two quality characteristics. Both the mixture amount and process factors are fixed in all experiments.
SIBELIUM ® 5mg capsules were developed by Janssen-Cilag company in 1980. Each capsule contains 5.9mg of Flunarizine. It is used to cure headache and dizziness. It is widely spread in several countries around the world.
II. MODELSOFMIXTUREEXPERIMENTS Any experiments relate to the component proportions of the mixture are called mixture experiments. Scheffe[11] defined the mixture problem. Suppose a mixture is composed of q components and the ith component contain
x
iof it. Eachcomponent proportion can’t be negative and the sum of all component proportions must be equal to 1. That is
, 0
≥
i
x i=1, 2, …, q
and
∑
= 1+ 2+...+ q =1q i
i x x x
x (1)
The factor space of any mixture experiment is reduced by one dimension due to the restriction of equation (1) which is different from that of a factorial experiment. For a q-factor factorial experiment, its feasible factor space is a q-dimensional space called q-cuboid. However for a q-component mixture experiment, its feasible region is a (q-1) dimensional space called (q-1) simplex.
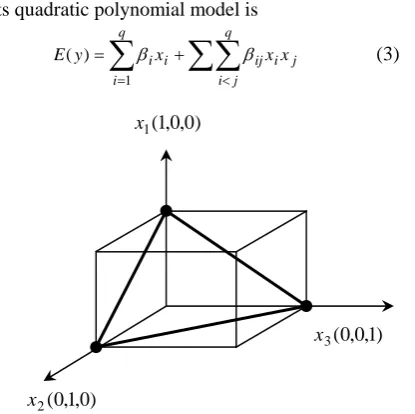
For a mixture experiment with three components in it, its feasible region will be an equal lateral simplex due to the restriction of equation (1). The feasible region is showed in Figure 1.
The purpose of a mixture experiment is to study the effect of each component on the quality characteristics interested. One will usually try to find the optimal proportion of each component such that the response values will be optimal. Scheffe[11] derived the polynomial regression models for the mixture experiments. For an experiment with three components, the linear model for it will be [5]
i q i
ix
y
E
∑
= =
1
)
( β (2)
The Optimization of Medicine Formulation
Using Mixture Experiments
) 0 , 0 , 1 (
1 x
) 0 , 1 , 0 (
2 x
) 1 , 0 , 0 (
3 x
1
1= x
1
3= x 1
2 = x
1
3= x 1
2 = x
1
1= x Its quadratic polynomial model is
j i q
j i
ij i
q i
ix xx
y
E
∑
∑∑
< =
+
= β β
1
)
[image:2.595.52.260.52.259.2]( (3)
Figure 1. The Factor Space for a Mixture Experiment with Three Components in It.
Its full cubic model is
k j i k
j i
ijk j i j i q
j i
ij
j i q
j i
ij i
q i
i
x x x
x x x x
x x x
y E
∑ ∑∑
∑∑
∑∑
∑
< <
<
< =
+ −
+ +
=
β δ
β β
) (
) (
1
(4)
The special cubic model is
k j i k
j i
ijk
j i q
j i
ij i
q i
i
x x x
x x x
y E
∑ ∑∑
∑∑
∑
< <
< =
+ +
=
β β β
) (
1 (5)
The appropriate model for a mixture experiment will be selected through the method of analysis of variance.
To accomplish a mixture experiment, one will follow the steps as
(1) Select the design points of the mixture experiment according to the restriction of components among them.
(2) Select the appropriate model among response variables and components by the method of analysis of variance.
(3) Execute the confirmation run to verify the fitted model. (4) Find the optimal component proportions to get the best result of responses.
III. DESIGNSOFMIXTUREEXPERIMENTS For a q-component mixture experiment without upper and lower bounds on its components, either {q, m} simplex-lattice design or a simplex-centroid design will be a good choice.
[image:2.595.315.513.58.164.2]For a three component mixture experiment, the factor spaces of the {3, m} simplex-lattice design and the simplex-centroid design are shown as Figure 2 and Figure 3 respectively.
[image:2.595.48.260.320.517.2]Figure 2. Design Points of a {3, 2} Simplex Lattice Design
Figure 3. Design Points of a {3, 2} Simplex Centroid Design
For a q-component mixture experiment with lower bound restrictions on its components, one will convert the component proportions xj into pseudo-components through linear transformation. Assume Li is the lower bound of xi, that is
i i x
L ≤ ≤
0 ,i = 1, 2, …, q (6)
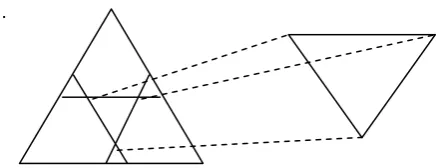
Equation (6) causes the feasible region is an inner simplex within a simplex as shown in Figure 4. The linear transformation of original component xi into pseudo-components
x
i*isL L x xi i− i
− =
1
* ,
i = 1, 2, …, q (7)
where
∑
=
=
qi i
L
L
1
[image:2.595.302.538.430.673.2]which is less than 1.
Figure 4. Experimental Region of a Three Component Mixture Experiment with Lower Bound Restrictions.
For a q-component mixture experiment with upper bound restrictions on its components0≤xi ≤Ui, assuming Ui is the
1
− − =
U x U
ui i i , i=1, 2, …, q (8)
where
∑
= > =
q i
i
U U
1
1.
The upper bound restrictions result the feasible experimental region could lie entirely inside the original simplex which is an inverted simplex if and only if
min 1
1
≤ −
∑
=
U U
q i
i (9)
Where Umin is the minimum of the q upper bounds. In this case the experimental region is called U-simplex which is shown in Figure 5.
[image:3.595.46.268.246.330.2].
Figure 5. The U-Simplex Experimental Region for Three Component Mixture Experiment with Upper Bound Restrictions.
For a q-component mixture experiment with both upper and lower bound restrictions on its components, the restriction on component xi is
1
0
≤
L
i≤
x
i≤
U
i≤
, i =1, 2, …, q (10)where 1
1 =
∑
=
q i
i
x .
The feasible region is a subset within a simplex. The subset is a convex set inside the original simplex. Before conducting the mixture experiment, one has to check any hidden restrictions among the original bound restrictions and check consistency among these restrictions. There are several possible designs for mixture experiments with lower and upper bound restrictions. They are:
(1) Extreme Vertices Design : McLean and Anderson[4] proposed the design which generates a design containing
) 1 2 ( −
× q
q design points.
(2) XVERT Algorithm : Snee and Marquardt[12] developed the algorithm which can searched for design points quickly. The more intense the design points distributed inside the experimental region, the smaller the variance of the first order estimated parameters in the model. If second order model is fitted, one needs to add more design points such as the midpoints of the vertices points to increase the precision of the estimated parameters in the second order model. All the design points can be generated by CONVRT computer program.
(3) XVERT1 Algorithm: Nigam, Gupta and Gupta[7] proposed the method which contains
2
q−1deign points.(4) Distance-Based Design: Notz W[8] proposed the method to search for its design points. The method first selects vertices points as its initial points. Then it selects points with maximum distance from the initial points. One of the advantages of the design is one can select any number of design points as one wishes.
(5) Symmetric-Simplex Design: Murty and Das[6] developed the design which made the design points distributed more uniformly inside the feasible experimental region constructed by the restrictions. Saxena and Nigam [10] found the design points of symmetric-simplex design through the transformation of its restrictions. The linear transformation is
ui i i ui uz
x =λ + ,
i
=1, 2, …,n
and u=1, 2, …,N
whereB B
B U B Li i
i −
− =
' '
λ ,
B B
L U ui i i
− − =
' (11) B’is the maximum values of zi’s and B is the minimum
values of zi’s.
(6) Computer-Aided Design [1,5] : For the computer-aided design, the designer must first decide the order of the response surface he would like to predict. Then he selected the design points with certain property related to the precision of the estimated parameters in the model. D-optimality design is most popular used by designers.
The research adopted symmetric-simplex design and XVERT design for the mixture experiments. We also added center point in each design to make each design more uniformly distributed inside each experimental region. Three more design points are added to each design for confirmation of each model.
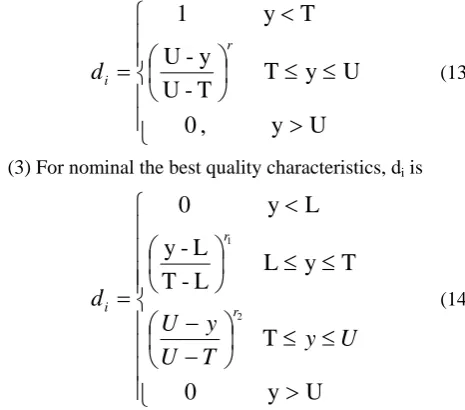
IV. OPTIMIZATIONOFMULTIPLEQUALITY CHARACTERISTICS(DESIRABILITYFUNCTION) Derringer and Suich[2] developed the optimization method using desirability function for multiple quality characteristics. The transformation of yi into individual desirability function di could be three possible ways where di is between 0 and 1. If response value equals to target, the value of di is 1. If the value of yi is not acceptable, the value of di is 0. For the case of multiple quality characteristics, one will select the di values with maximal D value where
m m
d d d D
1
2
1 ... )
( ⋅ ⋅ ⋅
= and m is the number of response
variables. For quality characteristics with various specifications, the transformation of yi into di could be three possible ways.
(1) For lager the better quality characteristics, di is
⎪
⎪
⎩
⎪
⎪
⎨
⎧
>
≤
≤
⎟
⎠
⎞
⎜
⎝
⎛
<
=
T
y
,
1
T
y
L
L
-T
L
-y
L
y
0
r i
d
(12)⎪
⎪
⎩
⎪
⎪
⎨
⎧
>
≤
≤
⎟
⎠
⎞
⎜
⎝
⎛
<
=
U
y
,
0
U
y
T
T
-U
y
-U
T
y
1
r i
d
(13)(3) For nominal the best quality characteristics, di is
⎪
⎪
⎪
⎪
⎩
⎪⎪
⎪
⎪
⎨
⎧
>
≤
≤
⎟
⎠
⎞
⎜
⎝
⎛
−
−
≤
≤
⎟
⎠
⎞
⎜
⎝
⎛
<
=
U
y
0
T
T
y
L
L
-T
L
-y
L
y
0
2 1
U
y
T
U
y
U
d
r r
i (14)
where T is target value of y, U is upper specification limit of y, L is the lower specification limit of y, and ri is the weight of individual di value.
V. MIXTUREEXPERIMENTONSIBELIUMCAPSULE SIBELIUM capsule contains one major component and three components called excipients to shape the capsule. The major component is not changeable and only three excipients are studied. Angle of repose and bulk density are the two quality characteristics being measured. Bad angle of repose will cause bad fluidity of medicine powder and large bulk density results difficulty in filling medicine powder into capsules. The mixture amount and the values of process variables are set fixed through all experiments. The four components of SIBELIUM capsule are shown in Table 1 and its original restrictions are shown as Table 2. The specifications of the two quality characteristics are shown in Table 3.
Table 1. The Four Components of SIBELIUM Capsule Components Weight of Each
Capsule (mg) Flunarizine 2HCl 5.9
Lactose x1 Aerosil x2 Sodium Stearyl
Fumarate x3
Total 120 mg
The steps of the mixture experiment are as the followings: (1) Check any hidden restrictions among component variables and the consistency of the restrictions [9]. They are shown in Table 4. The research used the software of Design-Expert to accomplish it.
Table 2. The Original Restrictions of the Three Components of SIBELIUM Capsule Components % By Total Weight
Aerosil 1.00-10.00% w/w
Sodium Stearyl
[image:4.595.53.286.53.258.2]Fumarate 0.25-2.50% w/w
Table 3. The Specifications of the two Quality Characteristics of SIBELIUM Capsule Quality
Characteristics Bulk Density
Angle of Repose Specification 0.59 ± 0.10
g/ml <45°
Table 4. Constraints with Consistency
Components Constraints Lactose 0.86854≦X1≦0.98685 Aerosil 0.01052≦X2≦0.10517 Sodium Stearyl
fumarate 0.00263≦X3≦0.02629
(2) Choose appropriate design of the mixture experiment. The experiment is a case with both upper and lower restrictions on components. The factor space will be a convex. We adopted symmetric-simplex design and the design generated by XVERT algorithm to complete the experiment. Each design contains three points for confirmation run. The design points of symmetric-simplex design are shown in Table 5 and Figure 6. The design points generated by XVERT algorithm are shown in Table 6.
(3) Collect experiment data and analyze the data. Data are collected based on the two designs. For each run we collected six data. That is the number of replications is six.
Table 5. The Design Points of Symmetric Simplex Design Design
Points
Proportions of Components
X1 X2 X3
1 0.97896 0.01841 0.00263
2 0.88826 0.10517 0.00657
3 0.91783 0.05588 0.02629
4 0.93558 0.06179 0.00263
5 0.95531 0.01840 0.02629
6 0.88431 0.08940 0.02629
Figure 6. The Design Points of the Symmetric-Simplex Design for Mixture Experiment on SIBELIUM Capsule.
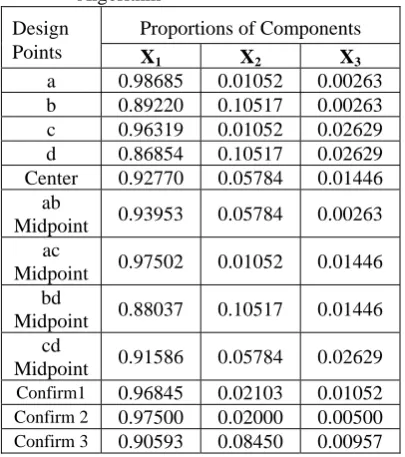
Table 6. The Design Points Generated by XVERT Algorithm
Design Points
Proportions of Components
X1 X2 X3
a 0.98685 0.01052 0.00263 b 0.89220 0.10517 0.00263 c 0.96319 0.01052 0.02629 d 0.86854 0.10517 0.02629 Center 0.92770 0.05784 0.01446
ab
Midpoint 0.93953 0.05784 0.00263 ac
Midpoint 0.97502 0.01052 0.01446 bd
Midpoint 0.88037 0.10517 0.01446 cd
Midpoint 0.91586 0.05784 0.02629 Confirm1 0.96845 0.02103 0.01052 Confirm 2 0.97500 0.02000 0.00500 Confirm 3 0.90593 0.08450 0.00957 For the quality characteristics of angle of repose in symmetric-simplex design, we selected special cubic model for it. The
R
A2 equals 0.5287 which is not sufficient to explain the angle of repose. The value ofR
A2is not largeenough since the gage to measure the angle of repose is not accurate to distinguish the difference among the collected samples. The prediction equation for angle of repose (Y1) is
Y1= 3 2 1 3 2 3 1 2 1 3 2 1 42 . 59 25 . 102 23 . 82 02 . 5 42 . 105 97 . 38 37 . 37 X X X X X X X X X X X X + − − − + +
The confirmation runs were executed and their average values are all within its 95% confidence interval and each individual value is within 95% prediction interval which verified the selected model is appropriate.
For the quality characteristics of bulk density in symmetric-simplex design, we selected special cubic model for it. The
R
2A equals 0.9982 which indicates the model cansufficiently explain the variance among the data. The prediction equation for bulk density (Y2) is
Y2 = 3 2 1 3 2 3 1 2 1 3 2 1 51 . 0 42 . 0 51 . 0 23 . 0 063 . 0 29 . 0 62 . 0 X X X X X X X X X X X X + + + − + +
For the quality characteristics of angle of repose in XVERT algorithm, we select special cubic model for it. The
2
A
R
equals 0.4616 and the prediction equation for angle of repose (Y3) isY3 = 3 2 1 3 2 3 1 2 1 3 2 1 93 . 76 84 . 141 82 . 136 89 . 1 3 . 71 93 . 35 92 . 36 X X X X X X X X X X X X − + + + + − +
For the quality characteristics of bulk density in XVERT algorithm, we selected special cubic model for it. The
R
A2equals 0.9975 and the prediction equation for bulk density (Y4) is Y4 = 3 2 1 3 2 3 1 2 1 3 2 1 34 . 0 32 . 0 27 . 0 18 . 0 74 . 0 28 . 0 62 . 0 X X X X X X X X X X X X + − − − + +
[image:5.595.79.261.50.265.2](4) Optimize the quality characteristics by the method of desirability function. Design-Expert is used to get the optimal quality characteristics based on the specifications of the two quality characteristics and the method of desirability function. The angle of repose is with smallest the better property while bulk density is with nominal the best property. The optimal proportions for each design are shown in Table 7 and the optimal predicted values for the two quality characteristic are shown in Table 8.
Table 7. The Optimal Proportions for Each Design Lactos
e
Aerosi
l Sodium Symmetric-Simple
Design 0.9484 0.0332 0.0184 XVERT Algorithm 0.9417 0.0505 0.0078
Table 8. The Optimal Predicted values for Each Quality Characteristics Angle of Repose Bulk Density Desirability Function (D) Symmetric Simplex Design
36.7443 0.5799 0.931 XVERT
[image:5.595.68.271.359.588.2]VI. CONCLUSION
The research showed how to apply mixture experiments on the development of medicines. The research studied the component proportions of medicine SIBELIUM capsule without considering its mixture amount and other process factors. Design points of symmetric-simplex design and design points generated by the XVERT algorithm are both studied in the research. There are two quality characteristics of the medicine being considered. After collecting the data of the two designs and analyzed for their corresponding prediction equations, it showed the optimal values of the two quality characteristics by symmetric-simplex design and XVERT algorithm both met their specification with high values of desirability function.
The research demonstrates mixture experiments are very suitable for the optimization of medicine formulation.
REFERENCES
[1] Cornell, J. A., “Experiments with Mixture”, 3rd Edition, John Wiley &
Sons, Inc. 2002.
[2] Derrineger, G and Suich, R., “Simultaneous Optimization of Several Response Variables”, Technoloty, 12(4), 1980, pp.214-219.
[3] Design-Expert 6.0. Stat-Ease, lnc., Minneapolis, MN, USA.
[4] Mclean, R. A. and Anderaon, V. L. “Extreme Verticea Design of Mixture Experiments, Technometrics, 8(3), pp.447-454, 1966 [5] Montgomery, D. C., “Design and Analysis of Experiments”,
7thEdition, John Wiley & Sons, Inc. 2009.
[6] Murty, J. S. and M. N. Das., “Design and Analysis of Experiments with Mixture”, Annals of Math, Statistics, 39, 1968, pp. 1517-1539. [7] Nigam, A. K., Gupta, S. C. and Cupta, S., “A New Alorithm for
Extreme Vertices Designs for Linear Mixture Models”, 25, , 1983, pp. 367-371.
[8] Notz, W. (1982), “Minimal point second order Design,” Journal of Statistical planning and Inference, Vol. 6, pp. 47-58.
[9] Piepel, Gregory F. “Constraint Regions in Mixture Experiments”, Technomerics, 25, 1983, pp.97-101.
[10] Saxena, S. K. and Nigam, A. K., “Restricted Exploration of Mixtures by Symmetric-Simplex Design”, Technometrics, 19, 1977, pp.47-52. [11] Scheffe, Henry, “Experiments with Mixture”, J. R. Statist Soc., B20,
1958, pp. 344-360.