Original Article
Identification of potential PDZ-domain
proteins downstream of ephrinB2 reverse signaling
during osteoclast differentiation of RAW264.7 cells
Yingjie Mao1, Xu Huang2, Juan Zhao1
1The Affiliated Hospital of Stomatology, Medical College of Zhejiang University, Hangzhou, China; 2The First Affili
-ated Hospital of Medical College of Zhejiang University, Hangzhou, China
Received May 22, 2017; Accepted December 13, 2017; Epub January 15, 2018; Published January 30, 2018
Abstract: Par3 and RGS3 have been reported to bind to ephrinB ligands. In this research, it was studied whether they were the potential PDZ-domain proteins involved in the downstream of ephrinB2 during the osteoclast
differ-entiation in vitro. Western blot analysis and immunofluorescence staining revealed that Par3 and RGS3 were promi -nently expressed during RANKL-induced osteoclast differentiation of RAW264.7 cells. In order to study the effects of reverse signaling on the expression levels of PDZ-domain proteins, soluble EphB4-Fc protein was used to stimulate ephrinB2. Western blot analysis and real-time RT-PCR results showed that the protein and mRNA expression level of Par3 in the EphB4-Fc treated group was higher than that in the Fc treated group. However, the protein and mRNA expression level of RGS3 in the EphB4-Fc treated group was lower. Although the expression levels of ephrinB2 and RGS3 were consistent with the expression change of c-Jun/c-Fos/Nfatc1 complex, co-immunoprecipitation results showed that there were no direct interactions between ephrinB2 and endogenously expressed Par3 and RGS3 in the RANKL-induced osteoclasts of RAW264.7 cells in vitro. In summary, we demonstrated that both Par3 and RGS3 were expressed during RANKL-induced osteoclast differentiation of RAW264.7 cells, and ephrinB2 reverse signaling regulated the expression levels of Par3 and RGS3 diversely.
Keywords: EphrinB2, PDZ domain, Par3, RGS3, RAW264.7 cells
Introduction
Since the cloning of the first Eph gene more than 20 years ago and the identification of ligands for Eph receptors (ephrins) a few years later, these molecules are increasingly under-stood to play important roles in disease and development. The Eph receptors make up the largest subgroup of the receptor tyrosine kinase family and interact with their ephrin ligands. Fourteen Eph receptors (EphA1-A8, EphA10 and EphB1-B4, EphB6) and eight eph-rin ligands (epheph-rinA1-A5 and epheph-rinB1-B3) have been identified to date [1, 2]. An important characteristic of interactions between Eph receptors and ephrin ligands is the bidirection-al signbidirection-aling, due to activation of signbidirection-aling path-ways in both the receptor-expressing and the ligand-expressing cells [3, 4]. Activation of the EphB receptors by the ephrinB ligands is desig-nated as “forward signaling”. Conversely, acti-vation of the ephrinB ligands by the EphB
receptors is referred to “reverse signaling”. The intracellular domain of ephrinB ligands, particu-larly the last 33 C-terminal amino acids, is high-ly conserved and contains multiple tyrosine residues, and the C-terminal YKV motif is a binding site for PDZ (postsynaptic density pro-tein, disks large, zona occludens) domain-con-taining proteins [5].
showed that the reverse inhibitory effect in osteoclasts was dependent on the cytoplasmic domain of ephrinB2, while the C-terminal YKV motif was critical for signal transduction, indi-cating that downstream PDZ-domain proteins were involved [5]. Our previous study results demonstrated that both syntenin and Pick1 (PDZ-domain proteins) are expressed during RANKL-induced osteoclast differentiation of RAW264.7 cells, and EphB4/ephrinB2 reverse signaling regulates the expression levels of syn-tenin and Pick1 in the different patterns [11]. These data help to preliminarily explore the potential PDZ-domain proteins involved in the downstream of ephrinB2 during the osteoclast differentiation of RAW264.7 cells in vitro. Recently, Par3 [12, 13] and RGS3 [14] (PDZ-domain proteins) have been reported to bind to ephrinB ligands. However, there are no data relating to whether ephrinB ligands, located on the membrane of osteoclasts, regulate the molecular biology change of Par3 and RGS3, following activation by EphB receptors.
This pilot study was designed to confirm Par3 and RGS3 were expressed by western blot analysis and immunofluorescence staining dur-ing RANKL-induced osteoclast differentiation of RAW264.7 cells, used as osteoclast precur-sors. Preclustered soluble EphB4-Fc protein as reverse signaling activated factors was used to stimulate ephrinB2, in order to study the effects of reverse signaling on the expression levels of Par3 and RGS3 proteins by western blot analy-sis, real-time RT-PCR and co-immunoprecipita-tion. These data was furtherly used to explore the potential PDZ-domain proteins involved in the downstream of ephrinB2 during the osteo-clast differentiation in vitro.
Material and methods
Materials
All medium components were purchased from GIBCO (Invitrogen Corp., Carlsbad, CA). The RNA extraction reagent TRIZOL was from Invitrogen Life Technologies (Carlsbad, CA). The leukocyte acid phosphatase kit was No.387 from Sigma Chemical Co. (St. Louis, MO). The goat anti-human IgG-Fcg fragment-specific antibody and the human IgG-Fc fragment were from Jackson ImmunoResearch Laboratories, Inc. (West Grove, PA). Recombinant murine sRANKL and recombinant murine EphB4-Fc chimera were obtained from R&D Systems, Inc. (Minneapolis, MN). Goat polyclonal antibodies
against ephrinB2 (H-83), goat polyclonal anti-bodies against RGS3 (H-300) and rabbit poly-clonal antibody against beta-actin were from Santa Cruz Biotechnology (Santa Cruz, CA). Rabbit polyclonal antibodies against Par3 (07-330) were from Upstate Biotech, Inc. (Charlottesville, VA). TRITC-conjugated rabbit goat and goat rabbit IgG (H+L) anti-bodies were from Pepro Tech, Inc. (Rocky Hill, NJ). The PrimeScript™ RT reagent kit and SYBR® Premix Ex Taq™ kit were from TaKaRa Biotechnology Co., Ltd. (Dalian, China). Protein A+G agarose was from Beyotime Biotech (Haimen, China).
Cell cultures
The RAW264.7 mouse monocyte/macrophage cell line was purchased from American Type Culture Collection (ATCC: TIB-71). RAW264.7 cells were maintained in Dulbecco’s modified Eagle’s medium (DMEM) containing 10% heat-inactivated fetal bovine serum (FBS). All media were supplemented with 2 mM glutamine, 100 IU/ml penicillin, and 100 µg/ml streptomycin (Sigma). Incubations were performed at 37°C with 5% CO2 in humidified air. During the re- search of RANKL-induced osteoclast differenti-ation, RAW264.7 cells groups were divided into RANKL+ group seeded in the media with 10% FBS and 25 ng/ml RANKL, and RANKL- group seeded in the media without RANKL.
TRAP staining
RAW264.7 cells were seeded at a concentra-tion of 0.5, 1.0, 1.5 and 2.0×10⁴ cells/well into a 24-well culture plate (Corning) with pre-set sterilized slides. These media were phenol red-free α-MEM supplemented with 10% FBS and 25 ng/ml RANKL and replaced every other day. After four days of culture, the cells were sub-jected to tartrate-resistant acid phosphatase (TRAP) staining by a leukocyte acid phospha-tase kit according to the manufacturer’s instructions. After the TRAP reaction, the slides were evaluated microscopically under a ×4 objective magnitude on an Olympus IX71 Inverted Research Microscope.
Quantitative real-time RT-PCR
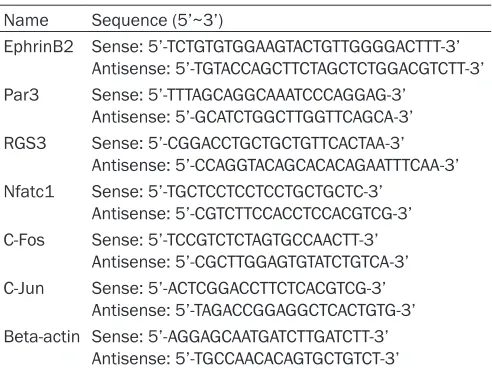
pre-clustered EphB4-Fc or Fc fragments. Before application to the cultured cells, EphB4-Fc or Fc fragments were preclustered with anti-human Fc antibody at a 1:10 molar ratio at 4°C for 1 h. The media were replaced every other day. After four days of culture, total RNA was extracted using TRIZOL according to the manu-facturer’s instructions. Isolated total RNA was eluted in RNase-free water and stored at -80°C until use. cDNA reverse transcription was per-formed using the PrimeScript™ RT reagent kit and quantitative real-time RT-PCR was per-formed using the SYBR Premix Ex Taq™ kit according to the manufacturer’s instructions. The following primers were used (Table 1). The PCR was performed with a 4-min initial denaturation at 95°C, followed by 40 cycles of 30 s of denaturation at 95°C, 30 s of annealing at 60°C, and 1 min of extension at 72°C by the Bio-Rad CFX96 system. Beta-actin was used as an internal control to normalize the expression of target genes. The data obtained from three independent experiments were used to analyze the relative gene expression by the 2-ΔΔCt
method.
Immunofluorescence staining
RAW264.7 cells cultured on coverslips under the described conditions were fixed with meth-anol for 30 min, washed in PBS, permeabilized with 0.2% Triton X-100 in PBS for 5 min, washed in PBS, and blocked with 5% bovine serum albumin (BSA) in PBS for 1-2 h at room temper-ature. After blocking, the cells were incubated
fluoride, 1 mM phenylmethane sulfonyl fluoride (PMSF)). Following centrifugation at 12000 g/m for 5 min at 4°C, the supernatants were collected, and the protein concentrations were measured by a BCA kit (Pierce). Equal amounts of proteins (30 mg/lane) were run on 8-12% SDS-PAGE gels and electrophoretically trans-ferred onto PVDF membrane (Sigma). After blocking, the proteins of interest on the mem-branes were probed with specific primary anti-bodies followed by the corresponding second-ary antibodies. Beta-actin was used as an internal standard for protein concentration and integrity. Bound antibodies were visualized by the enhanced chemiluminescence substrate (Beyotime). The bands of the western blots were quantitated by densitometry and normal-ized with actin using Bandscan software. Protein expression is expressed as a percent-age of the normal control.
Co-immunoprecipitation
[image:3.612.91.337.82.266.2]The cells collected from the described osteo-clastogenic cultures were lysed as described above. After centrifugation, the collected super-natants were incubated with goat polyclonal antibodies against ephrinB2 (diluted 1:50) at 4°C overnight. Next, protein A+G agarose beads were added to the mixture, and the mix-ture was incubated at 4°C for 3 h with mixing. After centrifugation at 12000 g/m for 5 min at 4°C, the beads with the bound proteins were washed five times with lysis buffer. The released proteins were resuspended in 1× electrophore-sis sample buffer and were analyzed by west-ern blot analysis as described above.
Table 1. Primer for real-time RT-PCR
Name Sequence (5’~3’)
EphrinB2 Sense: 5’-TCTGTGTGGAAGTACTGTTGGGGACTTT-3’ Antisense: 5’-TGTACCAGCTTCTAGCTCTGGACGTCTT-3’ Par3 Sense: 5’-TTTAGCAGGCAAATCCCAGGAG-3’
Antisense: 5’-GCATCTGGCTTGGTTCAGCA-3’ RGS3 Sense: 5’-CGGACCTGCTGCTGTTCACTAA-3’
Antisense: 5’-CCAGGTACAGCACACAGAATTTCAA-3’ Nfatc1 Sense: 5’-TGCTCCTCCTCCTGCTGCTC-3’
Antisense: 5’-CGTCTTCCACCTCCACGTCG-3’ C-Fos Sense: 5’-TCCGTCTCTAGTGCCAACTT-3’
Antisense: 5’-CGCTTGGAGTGTATCTGTCA-3’ C-Jun Sense: 5’-ACTCGGACCTTCTCACGTCG-3’
Antisense: 5’-TAGACCGGAGGCTCACTGTG-3’ Beta-actin Sense: 5’-AGGAGCAATGATCTTGATCTT-3’
Antisense: 5’-TGCCAACACAGTGCTGTCT-3’
overnight at 4°C with the specific pri-mary antibodies at a 1:50 dilution in a 1% BSA solution. Staining was complet-ed with the corresponding secondary antibodies at 1:200 dilutions in a 1% BSA solution. Then, the coverslips were mounted on slides and examined under a Nikon Eclipse 80i fluorescence microscope.
Western blot analysis
Statistical analysis
The results are expressed as means ± SDs from triplicate independent experiments. Data were statistically analyzed using one-way analy-sis of variance followed by Turkey’s post hoc test or un-paired Student’s t-tests, and statisti-cal significance was set at P values less than 0.05.
Results
The proliferation and differentiation effects of the seeding cell density on the RANKL-induced osteoclast differentiation of RAW264.7 cells
It has been shown that the number of cells seeded into the wells at the beginning of the culture (the seeding cell density) is an impor-tant factor determining the number of osteo-clasts that develop from osteoclast precursor cells. At lower densities osteoclastogenesis is probably limited by the low numbers of precur-sors, but higher cell densities appear to active-
The protein and mRNA expressions of Par3 and RGS3 during RANKL-induced osteoclast differentiation of RAW264.7 cells
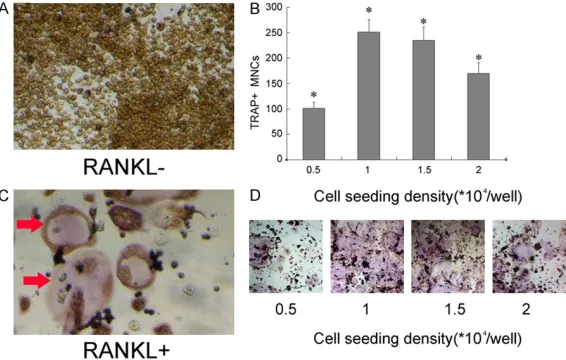
[image:4.612.92.375.72.252.2]The protein and mRNA expression of Par3 and RGS3 have been investigated in a number of cell lines and tissues. However, there are no data demonstrating the expression of them on the undifferentiated or differentiated osteo-clasts. Western blot analysis and immunofluo-rescence staining were used to investigate whether Par3 and RGS3 were prominently expressed during RANKL-induced osteoclast differentiation. RAW264.7 cells cultured in the presence of RANKL for four days were desig-nated as the RANKL+ group (marked in the fig-ures), while the cells cultured in the absence of RANKL were designated as the RANKL- group. Fortunately, both of Par3 and RGS3 were detect in the RANKL+ group. Western blot analysis showed that the band for Par3 and RGS3 in the RANKL+ group was stronger than that in the RANKL- group (Figures 2A, 3A), in accordance Figure 1. The effect of the seeding cell density on the RANKL-induced
os-teoclast differentiation of RAW264.7 cells. A. TRAP staining of undifferen-tiated osteoclasts derived from RANKL-stimulated RAW264.7 cells,
magni-fied by 100×. B. TRAP staining of differentiated osteoclasts derived from RANKL-stimulated RAW264.7 cells, magnified by 100×. Red arrows added
were used to point out where the differentiated osteoclasts located in. C. RAW264.7 cells were seeded at a concentration of 0.5, 1.0, 1.5 and 2.0×10⁴
cells/well into 24-well culture plates. After four days of conditional culture,
the number of TRAP-positive MNCs was significantly higher in the group of
1.0×10⁴ cells/well than the other groups. Bars represent means ± SDs. All
data are representative of three independent experiments. 1.0×10⁴ cells/
well group versus 0.5 and 2.0×10⁴ cells/well groups (*P<0.01). D. TRAP
staining of differentiated osteoclasts after four days of conditional culture at a concentration of 0.5, 1.0, 1.5 and 2.0×10⁴ RAW264.7 cells/well into
24-well culture plates.
with the immunofluorescence staining results (Figures 2B, 3B). These data demonstrated that Par3 and RGS3 were prominently expressed during RANKL-induced osteoclast differentiation of RAW264.7 cells.
The protein and mRNA expression of ephrinB2 during RANKL-induced osteoclast differentia -tion of RAW264.7 cells
EphrinB2 can be induced during osteoclast dif-ferentiation through the c-Fos-NFATc1 tran-scriptional cascade in wild-type cells. To
inves-group was higher than that in the Fc treated group (Figure 5A, 5B). However, the protein and mRNA expression level of RGS3 in the EphB4-Fc treated group was lower than that in the EphB4-Fc treated group (Figure 6A, 6B).
EphrinB2 signaling suppresses the expression of c-Fos, c-Jun and Nfatc1 in RANKL-stimulated RAW264.7 cells
The c-Jun/c-Fos and Nfatc1, downstream of the RANKL/RANK system, have been identified as the most strongly induced transcription factor Figure 2. The expression of Par3 during RANKL-induced osteoclast
differ-entiation of RAW264.7 cells. A. Immunoblot analysis of Par3 protein after osteoclast differentiation of RAW264.7 cells in the presence or absence of
RANKL for four days. Actin served as a loading control. B. Immunofluores -cence of Par3 in RAW264.7 cells in the presence or absence of RANKL for
[image:5.612.92.376.74.132.2]four days, magnified by 100×.
Figure 3. The expression of RGS3 during RANKL-induced osteoclast differ-entiation of RAW264.7 cells. A. Analysis of RGS3 protein after osteoclast differentiation of RAW264.7 cells in the presence or absence of RANKL for
four days. Actin served as a loading control. B. Immunofluorescence of RGS3
in RAW264.7 cells in the presence or absence of RANKL for four days,
mag-nified by 100×.
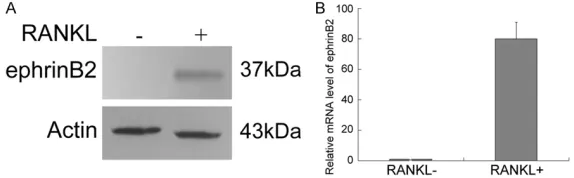
Figure 4. The expression of ephrinB2 was prominently elevated after osteo-clast differentiation of RAW264.7 cells in the presence of RANKL for four days, compared with undifferentiated RAW264.7 cells cultured in the ab-sence of RANKL. A. Immunoblot analysis of ephrinB2 protein. Actin served as a loading control. B. Real-time RT-PCR analysis of ephrinB2 gene expression. Beta-actin was used as an internal control to normalize the expression of the target genes. Bars represent means ± SDs. All data are representative of three different experiments. RANKL+ group versus RANKL- group (P<0.01).
tigate whether ephrinB2 was prominently expressed in RA- NKL-induced osteoclast differ-entiation of RAW264.7 cells, western blot analysis and real-time RT-PCR were used to examine the protein and mRNA expression of ephrinB2. The results showed that the protein expression of eph-rinB2 was detected in the RANKL+ group (Figure 4A) and the mRNA expression level of ephrinB2 was significantly hig- her in the RANKL+ group com-pared with the RANKL- group (Figure 4B).
EphrinB2 reverse signaling regulates the expression levels of Par3 and RGS3 in RANKL-stimulated RAW264.7 cells
[image:5.612.89.377.223.283.2] [image:5.612.89.376.373.462.2]gene for osteoclast differentiation. In this study, we used real-time RT-PCR to examine whether ephrinB2 reverse signaling modulates these critical transcription factors at the mRNA level in RANKL-induced RAW264.7 cells. The results showed that the mRNA level of these
transcrip-lar biology change of PDZ-domain proteins dur-ing osteoclast differentiation. In this study, we demonstrate that both Par3 and RGS3 are expressed during RANKL-induced osteoclast differentiation of RAW264.7 cells, and eph-rinB2 reverse signaling regulates the expres-Figure 5. The effect of ephrinB2 reverse signaling on the expressions of Par3
in RANKL-stimulated RAW264.7 cells. A. Immunoblot analysis of Par3 pro-teins in the EphB4-Fc treated group compared with the Fc treated or the un-treated blank control groups. Actin protein expression served as an internal control and was used to normalize the protein band intensity. The bar repre-sents the relative Par3 protein level(percent of control group). EphB4 group versus Fc group (*P>0.05). B. Real-time RT-PCR analysis of Par3 mRNA ex-pression in the EphB4-Fc treated group compared with the Fc treated or the untreated blank control group. Beta-actin was used as an internal control to normalize the expression of target genes. Bars represent means ± SDs. All data are representative of three independent experiments. EphB4 group vs Fc group and control group (*P<0.01).
Figure 6. The effect of EphB4/ephrinB2 reverse signaling on the expres-sions of RGS3 in RANKL-stimulated RAW264.7 cells. A. Immunoblot analysis of RGS3 proteins in the EphB4-Fc treated group compared with the Fc treat-ed or the untreattreat-ed blank control groups. Actin protein expression servtreat-ed as an internal control and was used to normalize the protein band intensity. The bar represents the relative RGS3 protein levels (percent of control group). EphB4 group versus Fc group and control group (*P<0.01). B. Real-time RT-PCR analysis of RGS3 mRNA expression in the EphB4-Fc treated group com-pared with the Fc treated or the untreated blank control group. Beta-actin was used as an internal control to normalize the expression of target genes. Bars represent means ± SDs. All data are representative of three indepen-dent experiments. EphB4 group vs Fc group and control group (*P<0.01).
tion factors was reduced in the EphB4-Fc treated group compared with the Fc treated group (Figure 7).
Par3 and RGS3 have not
been proved to be the poten
-tial binding partners for the
PDZ binding site of ephrinB2
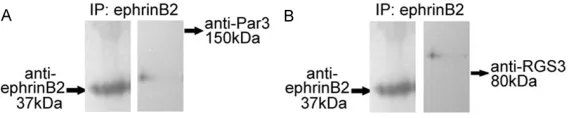
To investigate whether eph-rinB2 ligands associate with Par3 and RGS3, we immuno-precipitated ephrinB2 pro-teins from the cell lysis buffer with a goat polyclonal anti-body, and the precipitate was assayed by immunoblotting. As shown in Figure 8, both Par3 and RGS3 did not show the expected size coprecipi-tated with ephrinB2. These data indicated there were no direct interactions between ephrinB2 and endogenously expressed Par3 and RGS3 in the RANKL-induced osteo- clasts.
Discussion
[image:6.612.90.373.71.207.2] [image:6.612.90.368.360.499.2]molecu-sion levels of Par3 and RGS3 in different patterns.
[image:7.612.88.373.74.169.2] [image:7.612.91.375.312.371.2]PDZ domains are well-characterized protein-protein interaction modules, and can be found in most organisms from bacteria to vertebrates. The important function of PDZ domains is to regulate subcellular targeting of proteins, espe-cially membrane proteins, and also to serve as protein scaffolds for assembly of multimeric protein complexes. Par3 [15, 16] and RGS3 [14, 17, 18] (with PDZ domains that are linked to a functional unit) have been reported to bind to ephrinB ligands, were chose representatively for investigation. Par proteins are among the first set of proteins that were identified to play critical roles in cell polarity. Among the Par pro-teins, Par3 is the PDZ domain-containing scaf-fold protein [19], which is the key component of evolutionary conservative Par3/Par-6/αPKC complex, responsible for the control of
epithe-involved in the binding with ephrinB2 during the RANKL-induced osteoclast differentiation of RAW264.7 cells in vitro.
The first step of our study was to prove that Par3 and RGS3 were expressed during osteo-clast differentiation. In order to get standard experimental reagents and ensure reproduc-ible and reliable results, RAW264.7 macro-phage cell line was used as osteoclast precur-sors because they can be induced to stably differentiate into osteoclast-like cells by using RANKL with or without M-CSF, and RAW264.7 cell-derived osteoclasts perform similarly to pri-mary osteoclasts isolated from bones in con-ventional assays for osteoclast function [26]. Fortunately, both of Par3 and RGS3 were detect in the RANKL+ group. Western blot analysis showed that the bands for Par3 and RGS3 were stronger in the RANKL+ group, in accordance with the immunofluorescence staining results Figure 7. Effect of ephrinB reverse signaling on the expression of c-Fos, c-Jun
and Nfatc1 during RANKL-induced osteoclast differentiation of RAW264.7 cells. A. Real-time RT-PCR analysis of c-Fos and Nfatc1 gene expression. Beta-actin was used as an internal control to normalize the expression of tar-get genes. Bars represent means ± SDs. All data are representative of three independent experiments. EphB4 group versus Fc group and control group (*P<0.01, **P<0.01). B. Real-time RT-PCR analysis of c-Jun and Nfatc1 gene expression. Beta-actin was used as an internal control to normalize the expression of target genes. Bars represent means ± SDs. All data are representative of three independent experiments. EphB4 group versus Fc group and control group (*P<0.01, **P<0.01).
Figure 8. Identification of potential PDZ-domain proteins as binding part -ners for the PDZ binding site of ephrinB2. We immunoprecipitated ephrinB2 protein from the cell lysis buffer with a goat polyclonal antibody against eph-rinB2 (1:50) and assayed for coimmunoprecipitated PDZ-domain proteins by immunoblotting. A. Par3 (150 kDa) did not show the expected size co-precipitated with ephrinB2. B. RGS (80 kDa) did not show the expected size coprecipitated with ephrinB2.
(Figures 2, 3). These data demonstrate that Par3 and RGS3 are prominently expressed dur-ing RANKL-induced osteoclast differentiation of RAW264.7 cells. We suggest that Par3 and RGS3 may play some important roles in the process of the osteoclast differentiation. Secondly, ephrinB2 was also observed to be prominently expressed in RANKL-induced osteoclast differentiation of RAW264.7 cells (Figure 4). Given the C-terminal YKV motif in the intracellular domain of ephrinB ligands, it was predicted by Zhao et al. that EphB4/ephrinB2 intracellular reverse inhibitory signal mediated via interaction with PDZ domain proteins but not by tyrosine phosphorylation [5, 27]. In order to investigate the effects of reverse signaling on the molecular biology change of PDZ-domain proteins, soluble EphB4-Fc was used to stimu-late ephrinB2 because EphB4 exclusively inter-acts with ephrinB2 [28, 29]. Western blot anal-ysis and real-time RT-PCR results showed that the protein and mRNA expression level of Par3 in the EphB4-Fc treated group was higher than that in the Fc treated group (Figure 5). However, the protein and mRNA expression level of RGS3 in the EphB4-Fc treated group was lower (Figure 6). This indicated that after binding of EphB4, the downstream signal of ephrinB2 reg-ulated the expression level of Par3 and RGS3 in the different ways. However, we need to explain why ephrinB2 reverse signaling leads to the opposite expression results of the intracel-lular Par3 and RGS3? Lee et al. claimed that loss of ephrinB1 likely resulted in tight junction disruption due to increased availability of Par-6, which then forms non-functional tight junction complexes, similar to over-expression of Par-6 [16, 30]. Daar et al. furtherly analysed why loss of ephrinB1 resulted in more accessible Par-6, leading to disrupt tight junction formation [31]. What’s more, in the Par complex, Par3 was found to associate with the Par6/αPKC hetero-dimer via the PDZ-PDZ domain interaction and ephrinB1 associates with the Par polarity com-plex (Par3/Par6/αPKC) protein. Because eph-rinB1 and ephrinB2 share a high degree of identity [32, 33], our results suggested that an in vitro interaction and negative feedback exist-ed between ephrinB2 and the Par3 protein indi-rectly. However, positive feedback existed between ephrinB2 and RGS3 protein. The results showed that expression level of RGS3 was significantly higher in the RANKL+ group compared with the RANKL- group, and
down-regulated after soluble EphB4-Fc added to the culture, which was in accordance with the expression change of ephrinB2 and TRAP, cathepsin K, and calcitonin receptor, well-known markers of osteoclast differentiation [34]. RGS proteins are thought to participate in the development of skeletal system, including Wnt, parathyroid hormone (PTH), and calcium-sensing receptor (CaSR) pathways and Ca2+ signaling, which are also important in the cou-pling between osteoblasts and osteoclasts [35]. Thus, we suggested that RGS3 was more likely to be involved in the downstream of eph-rinB2 during RANKL-induced osteoclast differ-entiation of the RAW264.7 cell line.
Next question would be whether there was any potential relationship between the ephrinB2/ Par3 (or RGS3) complex and the c-Jun/c-Fos/ Nfatc1 complex, which is downstream of the RANKL/RANK system crucial for osteoclast dif-ferentiation. The Nfatc1 gene has been identi-fied as the most strongly induced transcription factor gene after RANKL-induced osteoclast differentiation in RAW264.7 cells [10, 36]. Ikeda and Matsuo et al. proposed that the part-nership between c-Jun/c-Fos and the NFAT fam-ily was crucial for osteoclast differentiation [37, 38]. Regarding of the importance of these tran-scription factors in the downstream pathways of RANKL-RANK signaling, we investigated whether the ephrinB2/Par3 (or RGS3) complex had any effect on the c-Jun/c-Fos/Nfatc1 com-plex. Interestingly, the mRNA levels of c-Jun, c-Fos and Nfatc1 were inhibited in the EphB4-Fc treated group during RANKL-induced osteo-clast differentiation of RAW264.7 cells com-pared with the Fc treated group (Figure 7). These results were consistent with the expres-sion change of RGS3, but the opposite of Par3, during the RANKL-induced osteoclast differen-tiation of RAW264.7 cells by the ephrinB2 reverse signaling mentioned above.
especially for the RGS3 protein [39-41], because of different tissues and cell lines. Par3 was more likely to be recruited to the PDZ bind-ing site of ephrinB2 indirectly while activated by EphB4 in the RANKL-induced osteoclastogene-sis of RAW264.7 cells [16, 30, 31].
In summary, we demonstrated that both Par3 and RGS3 were expressed during RANKL-induced osteoclast differentiation of RAW264.7 cells. Since ephrinB2 was prominently ex- pressed during RANKL-induced osteoclast dif-ferentiation, we chose clustered EphB4-Fc receptor as reverse signaling activated factors. After binding of EphB4, the downstream signal of ephrinB2 inhibited RANKL-induced osteo-clast differentiation of RAW264.7 cells and regulated the expression level of Par3 and RGS3 in the different ways. It should be noted that this study has provided only biochemical proof for the interaction of RGS3 and ephrinB2, but Par3 may be more likely to be involved in the cell-cell tight junctions, not in the down-stream of ephrinB2 reverse signaling during the osteoclast differentiation. However, we will per-form gain-of-function and loss-of-function experiments to reveal the biological signifi-cance and the molecular mechanisms of RGS3 in ephrinB2 reverse signaling. These data help to furtherly explore the potential PDZ-domain proteins involved in the downstream of eph-rinB2 during the osteoclast differentiation of RAW264.7 cells in vitro, and present an option-al drug target for the oroption-al bone diseases.
Acknowledgements
This work was supported by the grants from Zhejiang medical and health science and tech-nology program (2015KYB228, 2015KYB227, 2014KYA065) and Zhejiang Provincial Natural Science Foundation (LY17H140006).
Disclosure of conflict of interest
None.
Address correspondence to: Dr. Juan Zhao, The
Affiliated Hospital of Stomatology, Medical College
of Zhejiang University, #395 Yan’an St, Hangzhou 310006, China. Tel: +86 13588721219; Fax: 0571-87217433; E-mail: [email protected]
Reference
[1] Kullander K and Klein R. Mechanisms and functions of Eph and ephrin signalling. Nat Rev Mol Cell Biol 2002; 3: 475-486.
[2] Taylor H, Campbell J and Nobes CD. Ephs and ephrins. Curr Biol 2017; 27: R90-R95.
[3] Pasquale EB. Eph receptor signalling casts a wide net on cell behaviour. Nat Rev Mol Cell Biol 2005; 6: 462-475.
[4] Matsuo K and Otaki N. Bone cell interactions
through Eph/ephrin Bone modeling, remodel-ing and associated diseases. Cell Adh Migr 2012; 6: 148-156.
[5] Zhao C, Irie N, Takada Y, Shimoda K, Miyamoto T, Nishiwaki T, Suda T and Matsuo K. Bidirec-tional ephrinB2-EphB4 signaling controls bone homeostasis. Cell Metab 2006; 4: 111-121.
[6] Palmer A and Klein R. Multiple roles of ephrins in morphogenesis, neuronal networking, and brain function. Genes Dev 2003; 17: 1429-1450.
[7] Manolagas SC. Birth and death of bone cells: basic regulatory mechanisms and implications for the pathogenesis and treatment of osteo-porosis. Endocr Rev 2000; 21: 115-137.
[8] Boyle WJ, Simonet WS and Lacey DL. Osteo -clast differentiation and activation. Nature 2003; 423: 337-342.
[9] Karsenty G and Wagner EF. Reaching a genetic and molecular understanding of skeletal de-velopment. Dev Cell 2002; 2: 389-406.
[10] Wada T, Nakashima T, Hiroshi N and Penninger JM. RANKL-RANK signaling in osteoclastogen-esis and bone disease. Trends Mol Med 2006; 12: 17-25.
[11] Mao YJ, Huang X, Zhao J, Shi YH and Gu ZY. EphB4/ephrinB2 reverse signaling regulates expression levels of PDZ-domain proteins dur-ing osteoclast differentiation of RAW264.7 cells. Progress in Biochemistry and Biophysics 2011; 38: 464-472.
[12] Lin D, Gish GD, Songyang Z and Pawson T. The carboxyl terminus of B class ephrins consti-tutes a PDZ domain binding motif. J Biol Chem 1999; 274: 3726-3733.
[13] Nakayama M, Nakayama A, van Lessen M, Ya-mamoto H, Hoffmann S, Drexler HC, Itoh N, Hirose T, Breier G, Vestweber D, Cooper JA,
Ohno S, Kaibuchi K and Adams RH. Spatial
regulation of VEGF receptor endocytosis in an-giogenesis. Nat Cell Biol 2013; 15: 249-260.
[14] Lu Q, Sun EE, Klein RS and Flanagan JG. Eph-rin-B reverse signaling is mediated by a novel PDZ-RGS protein and selectively inhibits G protein-coupled chemoattraction. Cell 2001; 105: 69-79.
[15] Wu H, Feng W, Chen J, Chan LN, Huang SY and Zhang MJ. PDZ domains of Par-3 as potential phosphoinositide signaling integrators. Molec-ular Cell 2007; 28: 886-898.
[16] Lee HS, Nishanian TG, Mood K, Bong YS and
Daar IO. EphrinB1 controls cell-cell junctions
[17] Su Z, Xu P and Ni F. Single phosphorylation of Tyr304 in the cytoplasmic tail of ephrin B2
con-fers high-affinity and bifunctional binding to
both the SH2 domain of Grb4 and the PDZ do-main of the PDZ-RGS3 protein. Eur J Biochem 2004; 271: 1725-1736.
[18] Guan KL, Rao Y. Signalling mechanisms medi-ating neuronal responses to guidance cues. Nat Rev Neurosci 2003; 4: 941-956.
[19] Kohjima M, Noda Y, Takeya R, Saito N, Takeu-chi K and Sumimoto H. PAR3 beta, a novel ho-mologue of the cell polarity protein PAR3, local-izes to tight junctions. Biochem Biophys Res Commun 2002; 299: 641-646.
[20] Suzuki A and Ohno S. The PAR-aPKC system:
lessons in polarity. J Cell Sci 2006; 119: 979-987.
[21] Goldstein B and Macara IG. The PAR proteins: fundamental players in animal cell polariza-tion. Dev Cell 2007; 13: 609-622.
[22] Chen J and Zhang M. The Par3/Par6/aPKC complex and epithelial cell polarity. Exp Cell Res 2013; 319: 1357-1364.
[23] Jules J, Yang SY, Chen W and Li YP. Role of regulators of G protein signaling proteins in bone physiology and pathophysiology. Prog Mol Biol Transl Sci 2015; 133: 47-75.
[24] Iwai K, Koike M, Ohshima S, Miyatake K, Uchi -yama Y, Saeki Y and Ishii M. RGS18 acts as a negative regulator of osteoclastogenesis by
modulating the acid-sensing OGR1/NFAT sig -naling pathway. J Bone Miner Res 2007; 22: 1612-1620.
[25] Yu Y, Liu M, Ng TT, Huang F, Nie YY, Wang R, Yao ZP, Li ZG and Xia J. PDZ-reactive peptide activates Ephrin-B reverse signaling and inhib-its neuronal chemotaxis. ACS Chem Biol 2016; 11: 149-158.
[26] Sanchez-Fernandez MA, Gallois A, Riedl T,
Jurdic P and Hoflack B. Osteoclasts control os -teoblast chemotaxis via PDGF-BB/PDGF
re-ceptor Beta signaling. PLoS One 2008; 3:
e3537.
[27] Mundy GR and Elefteriou F. Boning up on eph-rin signaling. Cell 2006; 126: 441-443.
[28] Gale NW and Yancopoulos GD. Growth factors
acting via endothelial cell-specific receptor ty -rosine kinases: VEGFs, angiopoietins, and eph-rins in vascular development. Genes Dev 1999; 13: 1055-1066.
[29] Myshkin E and Wang B. Chemometrical
classi-fication of ephrin ligands and Eph kinases us -ing GRID/CPCA approach. J Chem Inf Comput Sci 2003; 43: 1004-1010.
[30] Lee HS and Daar IO. EphrinB reverse signaling
in cell-cell adhesion Is it just par for the course? Cell Adh Migr 2009; 3: 250-255.
[31] Daar IO. Non-SH2/PDZ reverse signaling by
ephrins. Semin Cell Dev Biol 2012; 23: 65-74.
[32] Zhao C, Irie N, Takada Y, Shimoda K, Miyamoto T, Nishiwaki T, Suda T and Matsuo K. Bidirec-tional ephrinB2-EphB4 signaling controls bone homeostasis. Cell Metab 2006; 4: 111-121.
[33] Davy A and Soriano P. Ephrin-B2 forward sig-naling regulates somite patterning and neural crest cell development. Dev Biol 2007; 304: 182-193.
[34] Mao Y, Huang X, Zhao J and Gu Z. Preliminary
identification of potential PDZ-domain proteins
downstream of ephrin B2 during osteoclast differentiation of RAW264.7 cells. Int J Mol Med 2011; 27: 669-677.
[35] Yuan X, Cao J, Liu T, Li YP, Scannapieco F, He X,
Oursler MJ, Zhang X, Vacher J, Li C, Olson D
and Yang S. Regulators of G protein signaling 12 promotes osteoclastogenesis in bone re-modeling and pathological bone loss. Cell Death Differ 2015; 22: 2046-2057.
[36] Takayanagi H, Kim S, Koga T, Nishina H, Isshiki M, Yoshida H, Saiura A, Isobe M, Yokochi T, In-oue J, Wagner EF, Mak TW, Kodama T and Tani-guchi T. Induction and activation of the tran-scription factor NFATc1 (NFAT2) integrate RANKL signaling in terminal differentiation of osteoclasts. Dev Cell 2002; 3: 889-901.
[37] Ikeda F, Nishimura R, Matsubara T, Tanaka S, Inoue J, Reddy SV, Hata K, Yamashita K, Hiraga T, Watanabe T, Kukita T, Yoshioka K, Rao A and Yoneda T. Critical roles of c-Jun signaling in regulation of NFAT family and RANKL-regulated osteoclast differentiation. J Clin Invest 2004; 114: 475-484.
[38] Matsuo K, Galson DL, Zhao C, Peng L, Laplace C, Wang KZ, Bachler MA, Amano H, Aburatani H, Ishikawa H and Wagner EF. Nuclear factor of activated T-cells (NFAT) rescues osteoclasto-genesis in precursors lacking c-Fos. J Biol Chem 2004; 279: 26475-26480.
[39] Su Z, Xu P and Ni F. Single phosphorylation of Tyr304 in the cytoplasmic tail of ephrin B2
con-fers high-affinity and bifunctional binding to
both the SH2 domain of Grb4 and the PDZ do-main of the PDZ-RGS3 protein. Eur J Biochem 2004; 13: 148-149.
[40] Qiu RX, Wang J, Tsark W and Lu QA. Essential role of PDZ-RGS3 in the maintenance of neural progenitor cells. Stem Cells 2010; 28: 1602-1610.