Abstract— Real time analysis of tissue properties by noninvasive methods finds wide variety of applications particularly in disease diagnosis and to measure tissue metabolic states. Also, it is used to estimate the depth of penetration of light radiation to determine the dosimetry in photodynamic therapy. We present here a technique for examining human normal and diseased skin conditions by retrieving their optical properties based on the in vivo measurement of diffuse reflectance spectra in the visible and near infrared regions of the electromagnetic spectrum.
Reflectance spectra are obtained by setting up a simple diffuse reflectance spectroscopic system based on fiber optic. Light from a white light source is incident onto the tissue site through the reflectance probe and the backscattered light is collected by the same and impinged on a spectrometer which generates a spectrograph which is acquired in the system. The data collected from the normal and diseased sites are fitted into the spectral model proposed based on diffusion theory. The model coefficients determined by non-linear least square optimization method are used to determine the optical properties of the tissue.
Index Terms— Diffuse reflectance, spectroscopy, spectral
model, non-linear least square optimization, optical properties.
I. INTRODUCTION
The measurement of optical properties, namely, absorption coefficient μ and reduced scattering coefficient
μ′ of biological tissues remains a central problem in the field of biomedical optics. Knowledge of these parameters is important in both therapeutic and diagnostic applications of light in medicine. Methods to accurately determine optical properties can lead to optical diagnostics tools [1], improvements in laser surgery [2], quantitative determination of chromophore [3] and fluorophore [4] concentrations, drug pharmacokinetics and improvements on Photodynamic Therapy (PDT) dosimetry [5].
Experimental determination of tissue optical properties has been proposed using different methodologies.
Manuscript received March 17, 2010. This research work is being funded and supported by All India Council for Technical Education (AICTE), Government of India, New Delhi under the scheme of Career
Award for Young Teacher (CAYT).
Shanthi Prince is with the Department of Electronics and Communication Engineering, SRM University, Kattankulathur 603203, INDIA. (Phone: 91-9444962179; fax:91(44)27452343; email: [email protected]).
S. Malarvizhi is with the Department of Electronics and Communication Engineering, SRM University, Kattankulathur 603203, INDIA. ([email protected]).
Integrating sphere [6], frequency domain diffuse reflectance [7], time domain diffuse reflectance [8] and spatially resolved steady-state diffuse reflectance [9] are among the most widely used. Each technique has its own advantages and disadvantages. In this work, based on the steady-state diffuse reflectance method the diffuse reflectance spectra are used for the determination of the optical properties. The method relies on the spectral characteristics of the tissue chromophores (water, blood and melanin) to determine the absorption coefficient and on a simple wavelength dependent expression for the determination of the reduced scattering coefficient. Advantages of using this method are the inexpensive equipment involved and the simplicity of the measurements.
II. INSTRUMENTATION
Light reflected from a surface consists of specularly reflected and diffusely reflected components. The intensity of the specular component is largely determined by the surface properties of the sample. The intensity of the diffuse component, which includes the contributions from the absorbance and the scattering of light by the specimen and the substrate, can be used to determine the concentration of the indicator species [10].
The spectral reflectance of the tissue conveys information about the metabolites which constitute the tissue. The change in the amount of chromophores in the tissue can be predicted by means of modified Beer Lambert Law [11]. The quantification of chromophores has the potential to provide beneficial information for diagnostic and therapeutic decision making.
Basically, a spectrophotometric measurement is to be done so that, the obtained spectra can be related to the molecular composition and structure of biochemical species in the sample of interest. The schematic diagram of the visible/near-infrared (VIS - NIR) spectroscopy system is shown in Fig.1. It consists of tungsten halogen light source (LS-1, Ocean Optics, Inc) [12] which is a versatile white-light source optimized for the VIS-NIR (360-2500nm) wavelength range, fiber optic reflectance probe (R400, Ocean Optics, Inc) [12], spectrometer (USB4000, Ocean Optics, Inc) [12] with CCD device, and a computer with an acquisition software (Spectra Suite, Ocean Optics, Inc) [12]. The USB4000 is responsive from 200 to 1100 nm, with an optical resolution of ~0.3nm (FWHM). It consists of 3648 element detector with shutter, high speed electronics and interface capabilities. The reflectance probe (R400) consists
Estimation of Optical Properties of Normal
and Diseased Tissue based on Diffuse
Reflectance Spectral Model
of bundle of seven optical fibers. Six illumination fibers and one read fiber – each of which is 400µm in diameter. The fiber ends are coupled in such a manner that the 6-fiber leg (the illumination leg) is connected to the light source and the single fiber leg is connected to the spectrometer. The details of this diffuse reflectance spectroscopic system and data acquisition are elaborated elsewhere [13, 14].
Also, the instrument is subjected to gauge repeatability and reproducibility test, the results of which states that its reproducibility and repeatability is well with the acceptable range.
III. ACQUISITION OF SPECTRA
Acquisition of visible/near-infrared data is straightforward. White light from a tungsten halogen lamp is brought to the skin via the reflectance probe. The light penetrates through the skin, and water, hemoglobin species, cytochromes, lipids and proteins absorb this light at specific frequencies. The remaining light is scattered by the skin, with some light being scattered back to the fiber optic probe. The collector fiber in the reflectance probe collects the diffused light from the skin, and directs it to the spectrometer that generates the reflectance spectra with the spectral range of 400 -1100 nm, which is then acquired on the computer
.
[image:2.595.316.516.55.390.2]
Fig.1. Schematic diagram of diffuse reflectance spectroscopic system
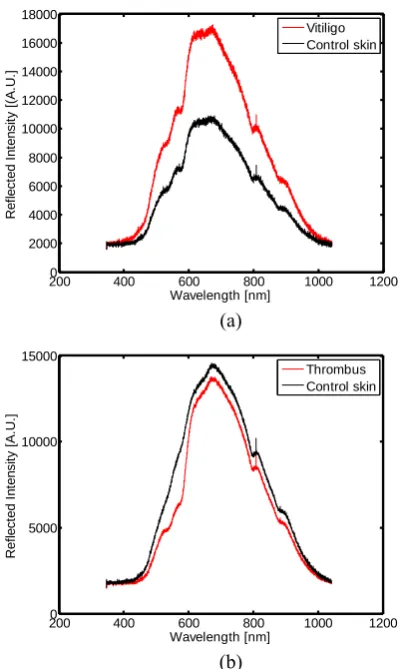
For the present study, zero melanin condition vitiligo and thrombus due to injury is chosen. In vivo diffuse reflectance intensity spectra for vitiligo and thrombus are shown in Fig.2 a &b along with the normal (control) spectra for each case using the experimental set up described here.
Prior to data acquisition, a reference spectrum is measured on a BaSO4 diffuse reflectance standard and all skin spectra were subsequently divided by this reference spectrum to ensure proper data normalization. Through the acquisition software each spectrum obtained is averaged. Before obtaining the readings, the subject's skin and the end of the probe are cleansed with 70% alcohol.
(a)
[image:2.595.58.282.383.538.2](b)
Fig 2 Diffuse reflectance intensity spectra for (a) vitiligo skin and (b) thrombus in comparison with control skin
IV. MODELING OF TISSUE REFLECTANCE WITH SPECTRAL
MODEL
In order to model the diffusely reflected light from the skin tissue, a number of analytical expressions have been proposed [15]. In the model considered, the deeper dermis layer is assumed to be infinitely thick, implicitly assuming subcutaneous tissue, such as fat and muscle to be of negligible influence on the diffuse reflectance spectrum. This is a fair assumption for most visible and NIR wavelengths. In this work the Farrell model for pencil beam irradiance [9] is considered.
The fraction of transport T collected by fiber at a radial distance r from the source is given by
T μ , μ′ 1
4π Ζ μ
1 r
e μ . r
Ζ 2Ζ μ 1
r e μ .
r
(1) where Z 1 μ⁄ μ′ , Z 2AD , diffusion constant
D Z ⁄ 3, the effective transport coefficient μ
D μ⁄ , r Z r ,
r Z 2Z r and A 1 r ⁄ 1 r . The term r is the internal specular reflection parameter due to the refractive index mismatch at the surface given by
r 0.668 0.0636n . . , n is the refractive index of the tissue.
Reflectance measurements on tissues R λ are
2000 400 600 800 1000 1200
2000 4000 6000 8000 10000 12000 14000 16000 18000
Wavelength [nm]
R
e
fl
e
c
te
d
In
te
n
s
ity
[(
A
.U
.]
Vitiligo Control skin
2000 400 600 800 1000 1200
5000 10000 15000
Wavelength [nm]
R
e
fl
e
c
te
d
In
te
n
s
ity
[A
.U
.]
Thrombus Control skin
Tungsten Halogen Lamp
Spectrometer
Power Supply
PC
Reflectance Probe
normalized by the reflectance from barium sulphate (BaSO4) standard R λ . The final spectrum is the normalized spectrum Rnorm given as
R λ ,
, (2)
where S λ is the light source power, D λ is the detector sensitivity, T λ is the optical transport into the sample medium and returning to the sample surface at the collection fiber, T λ is the optical transport into the standard medium and returning to the sample surface at the collection fiber, η , λ is the optical fiber collection efficiency for the sample and η, λ is the optical fiber collection efficiency for the standard.
The terms S (the source spectral response) and D (the detector spectral response) are the same for samples and standard measurements and does not vary within a measurement procedure and thus cancel in Eq. 2. The normalized measurement, R λ can be written as
R λ ,
, (3)
R λ K ∗ T λ (4) the factor K ,
, in Eq.(4) is the constant.
To model the tissue reflectance and retrieve the wavelength dependent reduced scattering coefficients and absorption coefficients that are related to blood volume fraction f , hemoglobin oxygen saturation S, volume fraction of water f and volume fraction of melanosomes f should be determined.
The scattering behaviour is dominated by Rayleigh scattering μ′ λ at short wavelengths below 650 nm from collagen fibril fine structure, small membranes, and other ultra structure on the 10-100 nm scale [16]. The Mie scattering μ′ λ is dominating for wavelengths above 650 nm from larger tissues structures such as collagen fiber bundles, mitochondria, nuclei and cells. Therefore, the visible to near-infrared spectral region is significantly affected by both scattering, that is given by
μ′ λ a μ′ λ μ′ λ (5) where ‘a’ [dimensionless] is the factor that characterizes magnitude of scattering, μ′ λ and μ′ λ [17]. The scattering properties are specified by fitting for scattering factor ‘a’.
Tissue absorption is modelled as a linear combination of absorption coefficient of water (μ ) with a volume fraction of f , a background spectrum for skin i.e.
absorption coefficient of melaninless hemoglobin-water free tissue (μ _ ), volume fraction of melanosomes ( f ) and a variable blood volume fraction (f of oxygenated and deoxygenated whole blood (μ _ - the absorption coefficient of oxy-hemoglobin , μ _ - the absorption
coefficient of deoxy-hemoglobin) at an oxygen saturation
(S). The water content is fixed as 75%. In principle, the water content could be fitted, but the system is not sufficiently sensitive in the 900-1000nm spectral region, where water strongly influences the spectra. In the framework of this model, the absorption coefficients of dermal layers taking into account the spatial distribution of melanosomes, blood and water content within the skin is written as:
μ λ f S. μ 1 S μ f . μ
1 f ∗ 1 f ∗ 1 f
∗ μ _ h
(6)
where μ _ cm the absorption coefficient of
melaninless hemoglobin-water free tissue given by
μ _ 7.84 x 10 x λ . cm [17] and μ
[cm ] is the absorption coefficient of water. The absorption coefficient of water is obtained from the extinction spectra of water by Hale and Querry[18]. For oxyhemoglobin and deoxyhemoglobin it is obtained from their extinction spectra according to the Takatani and Graham [19].
For the case of skin studies the light transport in epidermis is modeled as
T e _ (7)
where μ _ [cm ] is the absorption coefficient of
melanin defined as μ [17], L , equals twice the epidermal thickness. The volume fraction of melanin f in typical 60μm thick epidermis is specified by fitting Eq.7.
The model coefficient values of a, S, f , and f are determined by non-linear least square optimization method. The optical properties of the tissue determined using Eqns. 5 and 6 are substituted in Eqn. 1 to obtain the predicted reflectance R by fitting in the model as
R G ∗ T μ , μ′ (8) The proportionality factor G in Eq.8, contains factors like the fiber diameter, numerical aperture, and the ratio between the optical fiber probe collection efficiency for the sample and the standard.
V. RESULTS AND DISCUSSION
Once the model coefficients are estimated, then using Eq.5 and Eq.6, we calculate the absorption coefficient
μ λ and the reduced scattering coefficient μ′ λ of the different diseased tissue under study.
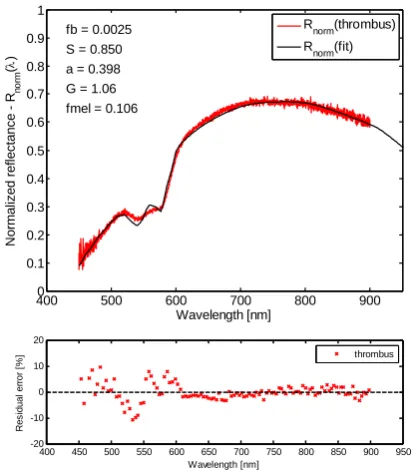
Figures 3a and 3b show the normalized reflectance spectra for vitiligo and thrombus in comparison to the predicted values determined using the fitted parameters a, S, G f and f . The model coefficient values of a, S, G f
bottom of each graph. The residual error is less than 5% for spectral region from 650 to 850nm. Disagreement is noticeable in the fitting of spectra below 600nm, as expected since diffusion theory fails when the reduced mean free path (1 μ⁄ μ′ ) is comparable with the source-detector separation and when μ is comparable to μ′.
Fig. 3.a – Normalized reflectance spectra for vitiligo in comparison with the predicted values determined using the fitted parameters a, S, G, f and f . Bottom plot shows the
percentage residual errors
[image:4.595.315.553.313.455.2][(predicted-measured)/measured x 100%]
Fig. 3.b - Normalized reflectance spectra for thrombus in comparison with the predicted values determined using the fitted parameters a, S, G, f and f . Bottom plot shows the
percentage residual errors
[(predicted-measured)/measured x 100%]
Using the model coefficient values the optical properties - absorption coefficients and reduced scattering coefficients are calculated using Eqns.5 and 6. On analyzing the values
it is observed that volume fraction of blood is little higher for thrombus in which there is a large amount of blood accumulation. Observing the oxygen saturation, the average value is around 85% as against the standard value of 90-98%. It may be due to the fact that the estimation includes both arterial and venous blood. The volume fraction of melanosomes is higher for thrombus than vitiligo, since in this type of skin condition the level of pigmentation (due to blood clot) is high. For the vitiligo skin, the volume fraction of melanosomes is less as it is the region of zero melanin.
Figures 4(a) and 4(b) shows the plot of absorption and reduced scattering coefficients of vitiligo skin and thrombus in comparison with the control skin. From the vitiligo optical properties plot it can be observed that the absorption coefficient shows changes between normal and vitiligo site in the visible wavelength range of 400 – 600 nm, with higher values for the vitiligo skin. The reduced scattering coefficient values are higher for the vitiligo throughout the spectral region under study. The knowledge of the scattering properties can reveal information about the morphology and architecture of skin [20].
Fig.4 (a)Absorption coefficients ( and reduced scattering coefficients ( ′)determined for vitiligo from the
spectral model
Fig.4 (b)Absorption coefficients ( and reduced scattering coefficients ( ′)determined for thrombus by the
spectral model
The plot of absorption and reduced scattering coefficients for the thrombus tissue in comparison with the normal tissue
400 500 600 700 800 900
0 0.1 0.2 0.3 0.4 0.5 0.6 0.7 0.8 0.9 1
Wavelength [nm]
N
o
rm
al
iz
ed ref
lec
ta
nc
e - R
no
rm
(
)
fb = 0.0006 S = 0.850 a = 0.464 G = 1.01 fmel = 0.010
Rnorm(vitiligo)
Rnorm(fit)
400 450 500 550 600 650 700 750 800 850 900 950
-20 -10 0 10 20
Wavelength [nm]
Res
idua
l error
[%
] vitiligo
400 500 600 700 800 900
0 0.1 0.2 0.3 0.4 0.5 0.6 0.7 0.8 0.9 1
Wavelength [nm]
N
o
rmal
iz
ed ref
lec
tanc
e - R
no
rm
(
)
fb = 0.0025 S = 0.850 a = 0.398 G = 1.06 fmel = 0.106
Rnorm(thrombus)
R norm(fit)
400 450 500 550 600 650 700 750 800 850 900 950
-20 -10 0 10 20
Wavelength [nm]
Res
idu
al
e
rro
r
[%
] thrombus
400 500 600 700 800 900
10-2 10-1 100 101 102
wavelength [nm] [ca
m
-1 ] an
d
' [cs
m
-1 ]
s'- control skin a - control skin s'- vitiligo a - vitiligo
400 500 600 700 800 900
10-2 10-1 100 101 102
wavelength [nm] [ca
m
-1 ] an
d
' [cs
m
-1 ]
[image:4.595.65.274.447.685.2] [image:4.595.316.554.541.700.2]is shown in fig.4 (b). Here the reduced scattering coefficient and absorption coefficient for the thrombus tissue is higher when compared to the normal tissue. Thrombus being the region of blood clot, the volume fraction of hemoglobin is higher leading to the contribution towards the higher values for optical coefficients.
Table 1Comparison of μ λ and μ λ for forearm obtained by the proposed spectral model with the results
from literature
Wavelength
λ (nm)
Results from this model
Results from other related works
Literature References
μa(cm-1) μs’(cm-1) μa(cm-1) μs’(cm-1)
633 0.14 13.0 0.17 9.08 [21]
660 0.1269 11.61 0.128 8.68 [21]
700 0.107 9.948 0.09 8.1 [21]
750 0.1018 8.349 0.03 10 [22], [23]
800 0.0823 7.133 0.23 6.8 [24]
For the validation of the model, measurements were performed on the human forearm and their optical properties estimated. The result of this work is compared with other similar works. Table 1 shows the comparison of μ and μ values for forearm obtained by this method with that of other works in literature, with the corresponding references. It is clear from the table 1 that the results obtained through this model agree well with those of Doornbos [21] as compared with others. The discrepancy in μ values may be because of the difference of individuals, including skin color and age
.
VI. CONCLUSION
We have presented an analytical model for the study of diffuse reflectance spectra from normal and diseased tissue. The model provides quantitative information for the hemoglobin and melanin contents, which are the dominant chromophores of skin in the visible range. In addition, it provides information about the light scattering and absorption properties of the skin. The technique described here is good for the analysis and evaluation of human skin in vivo, in a rapid and noninvasive way, and the information obtained is potentially useful in the assessment and diagnosis of numerous pathologic conditions. Finally, this diffuse reflectance model is based on certain assumptions that the absorption is due to only melanin, water and hemoglobin. There are other chromophores that have specific absorption spectrum in the skin that dominates during certain pathological conditions. In order to cover wide pathological study this model can be remodeled.
REFERENCES
[1] V. G. Peters, D. R. Wyman, M. S. Patterson and L. Frank, “Optical
properties of normal and diseased human breast tissues in the visible and near infrared,” Phys. Med. Biol., vol. 35, 1990, pp. 1317-1334.
[2] S. L. Jacques, "Laser-tissue interactions: photochemical,
photothermal, photomechanical," Surgical Clinics of North America, vol. 72, 1992 pp. 531-558.
[3] M. S. Patterson, E. Schwartz and B. C. Wilson, “Quantitative
reflectance spectrophotometry for the noninvasive measurement of
photosensitizer concentration in tissue during photodynamic therapy,” in Photodynamic Therapy: Mechanisms, T. J. Dougherty, Proc. SPIE, vol. 1065, 1989, pp. 115-122.
[4] C. M. Gardner, S. L. Jacques and A. J. Welch, “Fluorescence
spectroscopy of tissue: recovery of intrinsic fluorescence from measured fluorescence,” Applied Optics, vol. 35, 1996, pp. 1780-1792.
[5] S. L. Jacques, "Simple theory, measurements, and rules of thumb for
dosimetry during photodynamic therapy," in Photodynamic Therapy: Mechanisms, T. J. Dougherty, Proc. SPIE, vol. 1065, 1989, pp. 100-108.
[6] J. W. Pickering, C. J. M. Moes, H. J. C. M. Sterenborg, S. A. Prahl,
and M. J. C. van Gemert. “Two integrating spheres with an intervening scattering sample,” J. Opt. Soc. Am. A, vol. 9, 1992, pp. 621-631.
[7] S. Fantini, M. A. Francechini-Fantini, J, S, Maier, S. A. Walker, B.
Barbieri and Enrico Gratton, “Frequency-domain multichannel optical detector for noninvasive tissue spectroscopy and oximetry,” Optical Engineering, vol. 34, 1995, pp. 32-42.
[8] M. S. Patterson, B. Chance and B. C. Wilson, “Time resolved
reflectance and transmittance for the non-invasive measurements of optical properties,” Applied Optics, vol. 28, 1989, pp. 2331-2336.
[9] T. J. Farrel and M. S. Patterson, “A diffusion theory model of
spatially resolved, steady-state diffuse reflectance for the noninvasive determination of tissue optical properties in vivo,” Med. Phys., vol. 19, 1992, pp. 879-888.
[10] Tuan Vo-Dinh, “Biomedical Photonics Handbook”, (CRC Press,
2003)
[11] V. Tuchin, “Tissue Optics Light Scattering Methods and Instruments
for Medical Diagnosis”, SPIE Press, USA, 2007.
[12] www.oceanoptics.org
[13] Shanthi Prince and S. Malarvizhi, “Functional optical imaging of a
tissue based on diffuse reflectance with fibre spectrometer”, 4th European Congress for Medical and Biomedical Engineering, IFMBE Proceedings, 2008, 22, pp. 484-487,
[14] Shanthi Prince and S. Malarvizhi, “Multi wavelength Diffuse
Reflectance plots for mapping various chromophores in human skin for non-invasive diagnosis”, the 13th International Conference on Biomedical Engineering 2008, IFMBE Proceedings, Vol.23 , pp. 323-326.
[15] Kienle,A., and Patterson,M.S., “Improved solutions of the
steady-state and the time-resolved diffusion equations for reflectance from a semi-infinite turbid medium”, J. Opt. Soc. Am. A, vol. 14, No. 1, 1997, pp. 246-254.
[16] S. L. Jacques, “Modeling light transport in tissue,” in Biomedical
Optical Instrumentation and Laser-Assisted Biotechnology, A. M. Verga Scheggi et al., eds. Netherlands: Kluwer Academic Publishers, 1996, pp. 21-32.
[17] Jacques, S.L., “Skin Optics”
http://omlc.ogi.edu/news/jan98/skinoptics.
[18] G. M. Hale and M. R. Querry, "Optical constants of water in the
200nm to 200μm wavelength region," Appl. Opt., 12, 1973, pp.
555-563.
[19] S. Takatani and M. D. Graham, "Theoretical analysis of diffuse
reflectance from a two-layer tissue model," IEEE Trans. Biomed. Eng., BME-26,1987, pp. 656—664.
[20] Ferdman AG, Yannas IV, “Scattering of light from histologic section:
a new method for the analysis of connective tissue”, J Invest Dermatol., 100, 1993, pp.710-716.
[21] Doornbos, R.M.P., Lang, R., Aalders, M.C., Cross, F.W., and
Sterenborg. H.J.C.M., 1999, “The determination of In vivo Human Tissue Optical Properties and Absolute Chromophore Concentrations using Spatially resolved steady-state Diffuse Reflectance Spectroscopy,” Phys. Med. Biol., 44, pp. 967-981.
[22] Farrell, T.J., Patterson, M.S., and Essenpreis. M., 1998, “Influence of
Layered Tissue Architecture on Estimates of Tissue Optical Properties obtained from spatially Resolved Diffuse Reflectometry,” Appl. Opt., 37, pp. 1958-1972.
[23] S. Nickell, M.Hermann, M. Essenpries, T.J. Farrell, U. Kramer and
M.S. Patterson, “Anisotropy of Light propagation in Human Skin”,
Phys. Med. Biol., vol.45, 2000, pp.28773-2886.
[24] T.L. Troy, D.L. Page, and E.M. Sevick-Muraca, “Optical properties