Original Article
Antagonization of CCR4 leads to failure of activated
regulatory T-cell migration in a mice model of
head and neck squamous cell carcinoma
Wei-Jin Li1,2*, Wei Sun1*, Fan-Qin Wei1,3*, Wei-Ping Wen1
1Department of Otorhinolaryngology Head and Neck Surgery, The First Affiliated Hospital of The Sun Yat-sen
University, Guangzhou, China; 2Department of Otorhinolaryngology Head and Neck Surgery, The Third Affiliated
Hospital of The Sun Yat-sen University, Guangzhou, China; 3Department of Otorhinolaryngology Head and Neck
Surgery, The Sixth Affiliated Hospital of The Sun Yat-sen University, Guangzhou, China. *Equal contributors.
Received August 26, 2017; Accepted June 4, 2018;Epub September 15, 2018; Published September 30, 2018
Abstract: By mediating immune tolerance in head and neck squamous cell carcinomas (HNSCC), regulatory T-cells (Tregs) are not functionally heterogeneous. Animal models of HNSCC regarding CD4+CD45RA-CD25+++ Treg cells [activated Treg (aTreg) cells] have not been reported, making it difficult to target tumor-infiltrating aTregs. This present study confirmed that mice aTreg cells, with suppressive capacity, were dramatically increased in the tumor microenvironment. Moreover, C-C chemokine receptor 4 (CCR4) was specifically expressed by aTreg cells while MCP-1 (CCL2), CCL17 (TARC), CCL22 (MDC), and endogenous CCR4-binding ligands were upregulated in the tumor microenvironment. An in vitro study showed that aTreg migration was successfully blocked after use of a CCR4 antagonist. Therefore, blocking the recruitment of aTreg cells induced by CCR4 is a promising method for future studies on immunotherapy for HNSCC.
Keywords: CCR4, tumor microenvironment, activated Treg, mouse, head and neck squamous cell carcinoma, antagonist
Introduction
Head and neck squamous cell carcinoma (HNSCC) is the sixth most common type of malignancy, worldwide [1]. Survival rates for this disease have not improved for several decades, despite many efforts made regarding chemotherapy, radiotherapy, and surgery [2]. Failure of antitumor immune activities is high- ly associated with progression and recurren- ce of HNSCC [3]. Foxp3+CD25+CD4+ regulatory
T(Treg) cells play a crucial role in immune toler-ance by keeping tumor-specific T-cell respons-es from fulfilling their task [4, 5].
The frequency and prognostic value of Tregs in different cancers have long been discussed [6-9]. However, studies involving depletion of Treg cells have shown different effects regard-ing antitumor immune response [10-14], partly due to their varied function. For example, a
por-tion of CD4+CD25+ T-cells show no capability in
antitumor suppression but produce interleukin (IL)-2, which is needed for antitumor respons- es. Therefore, when targeting all CD4+CD25+
T-cells, collateral damage might be made [12]. Hence, a new approach is needed to target Treg cell accumulation in the tumor microenviron-ment instead of depleting the whole CD25+
T-cell subset.
In 2009, Miyara et al. demonstrated that Tregs can be divided into three functionally distinct subsets on the basis of CD45RA, FoxP3, and CD25 expression: resting Tregs (rTreg cells) which are CD45RA+Foxp3lowCD25++ Tregs,
acti-vated Tregs (aTreg cells) which are CD45
-Fxop3lowCDE25++ Tregs, and cytokine-secreting
non-suppressive T-cells which are CD45RA
-Foxp3lowCD25+CD4+ T-cells [15]. Previous re-
Tregs (aTreg cells), which are highly suppres-sive, while a decrease in resting Tregs (rTreg cells) was found [16, 17].
By evaluating markers of chemokine receptors on the surface of tumor-infiltrating Tregs in HNSCC patients, it was found that the C-C che-mokine receptor (CCR) 4 was exclusively highly expressed on the surface of peripheral aTre- gs, while monocyte chemoattractant protein-1 (MCP-1), an endogenous CCR4-binding ligand, was specifically upregulated in the HNSCC microenvironment [18]. However, similar divi-sion of Tregs was not reported in HNSCC mice models. Moreover, the mechanisms that medi-ate recruitment of Tregs within mouse tumor tissues remain unclear. Thus, an experiment of CCR4 antagonist was inappropriate for study, in vivo.
This present assessed frequencies of the 3 functionally distinct subsets of CD4+CD25+
Foxp3+ T-cells in mice with HNSCC. It was
con-firmed that, in a mice model, distinct subsets of Treg cells have similar variations in function as in humans. Furthermore, CCR4 expression on the 3 subsets of mouse Tregs was investigated, finding that CCR4 was exclusively highly expressed on aTreg cells, while its binding ligands MCP-1 (CCL2), TARC (CCL17), and MDC (CCL22) were upregulated in mice tumor micro-environment. This study evaluated the clinical importance of CCR4 antagonist, in vitro, and argued that an in vivo experiment on the block-ade of aTreg cell trafficking was viable and of great importance.
Materials and methods
Animals and tumor cell lines
Male C3H-HeN mice, 8 weeks old, were pur-chased from Slac Laboratory Animal Co., Ltd., (Shanghai, China). All mice used for experi-ments were housed under specific pathogen-free conditions. Procedures performed were approved by the Institutional Animal Studies Committee and conducted in accordance with the Institutional Animal Care and Use Com- mittee (IACUC) guidelines. SCC VII cells, a cell line of mouse OSCC, were kindly provided by West China Hospital.
Antibodies and reagents
All antibodies were purchased from eBiosci-ence (Germany) unless specified otherwise.
The following antibodies were used for surfa- ce staining: anti-mouse CD3-eFluor 605NC, anti-mouse CD4-eFluor 450, anti-mouse CD- 25-APC, anti-mouse CCR4-PE, and anti-mouse CD45RA-FITC from Santa Cruz. Anti-mouse Foxp3-PE and Foxp3 fixation/permeabilization kits were obtained for intracellular staining. Soluble anti-mouse CD3e and CD28 functional grade purified were also used for activation of T-cells in vitro. Isotype controls were purchased from the same company.
Preparation of lymphocytes
Single cell suspensions of lymphocytes were prepared by enzymatic digestion [26]. After mice were sacrificed on day 21 and day 28 after tumor injections, tumors and spleens were removed and minced into small pieces with a scalpel. Samples were then immersed in 10 mL of digestion mixture of RPMI 1640 with 5% fetal bovine serum 0.5 mg/mL collagenase A, 0.2 mg/mL hyaluronidase type V, and 0.02 mg/mL DNase I (Sigma-Aldrich St. Louis, MO, USA). After 30 minutes of incubation on a plat-form at 37°C, samples were filtered through 40-nm cell strainers (BD Biosciences, San Diego, CA, USA). From single cell suspensions obtained above, lymphocytes were then further extracted using Ficoll-Hypaque (Haoyang Bio, Tianjin, China).
Surface and intracellular staining
To identify Foxp3+CD4+ T-cell subsets, surfa-
ce and intracellular staining were performed. Antibodies against surface markers CD4, CD25, CD45RA and CCR4 were added to the lymphocyte suspensions and incubated on ice for 45 minutes in the dark. After two washings, cells were fixed and permeabilized with fixa-tion/permebilization buffer for 1 hour on ice in the dark. After washing, intracellular antibodies against Foxp3 were added and incubated for 1 hour in the dark at room temperature. After two additional washings, cells were examined by multicolor flow cytometry. For each sample, proper isotype Ab controls were included. Multicolor flow cytometry
405 nm violet) Gallios Flow Cytometer (Be- ckman Coulter, Hercules, CA, USA) equipped with Gallios Software v1.0. Gating strategy was performed as described [15].
Cell culture
RPMI 1640 medium supplemented with 10% fetal bovine serum, 100 IU/mL penicillin, and 100 mg/mL streptomycin (Sigma, St. Louis, MO) was used for T-cell culturing. For tumor cell lines, DMEM medium supplemented with 10% fetal bovine serum, 100 IU/mL penicillin, and 100 mg/mL streptomycin (Sigma, St. Louis, MO) was used.
In vitro suppression assay of three distinct Treg subsets
Cells stained with antibodies against CD4, CD25 and CD45RA were adjusted to a con- centration of 1 × 10⁴ cells/μl. Using a FACS
cell sorter (BD Influx, BD Biosciences), live cells of Treg subsets were sorted out as follows: CD2525++CD45RA+ cells as FoxP3lowCD45RA+
(I), CD25+++CD45RA- cells as FoxP3highCD45-
RA- (II), and CD25++CD45RA-CD4+ T cells as
FoxP3lowCD45RA- (III), respectively [15].
After sorting, each of the 3 subsets of Treg cells were added with 5 × 10³ responder cells (1:1
ratio) labeled with 1 μM carboxyfluorescein di- acetate succinimidyl ester (CFSE) (eBioscience, San Diego, CA, USA). Soluble anti-CD28 (2 μg/ mL) and plate-bound anti-CD3 (0.5 μg/mL) were used in the co-culture system. After 72 hours of co-culturing, cells were harvested and analyzed by flow cytometry. Percentages of suppression were determined by the prolifera-tion index (PI, frequencies of proliferated cells in each group/frequency of proliferated cells in a responder cell control group X 100%) of a responder cell control group (100% prolifera-tion, 0% suppression), compared with the PI of responder cells co-cultured with each Treg subset.
Migration assay
Migration assay was performed as previous- ly described [27]. 1 × 10⁴ aTreg cells were in-
cubated with a CCR4 antagonist (C27H41N5 O2.2HCL, 0.14 μM, TOCRIS, Minneapolis, MN, USA) for 30 minutes at 37°C. Anti-mouse-CCL2 antibodies (Monoclonal Mouse IgG1 Clone
#24822, 15 μg/mL, R & D Systems) or tumor extracts were added to the lower chamber. Migrated cells were counted with an automat- ed cell counter (Scepter, Millipore, Billerica, MA, USA).
Immunohistochemical analysis
Detection of chemokine receptor ligands MCP-1 (CCL2), TARC (CCL17), and MDC (CCL22) an- tibodies was performed on 4 μm-thick paraf- fin-embedded sections of tumor tissue and paracancerous tissue samples with indicat- ed antibodies using an ABC kit (PK-4001, ZSGBBIO).
Statistical analysis
Statistical analysis was performed with SPSS Standard version 13.0 software (IBM, Chicago, IL, USA). Differences in frequencies of the total Treg subset between groups were assessed using Student’s t-tests, while differences of fre-quencies of distinct Treg subsets and CCR4 expression on distinct Treg subsets subsets were assessed using Mann-Whitney U-test. Suppressive function of distinct Treg groups and recruiting function of CCR4 on aTreg were analyzed using Kruskal-Wallis tests. Com- parison of MCP-1 (CCL2), TARC (CCL17), and MDC (CCL22) expression between tumor tis-sues and paracancerous tistis-sues was per-formed using Wilcoxon matched-pairs signed-ranks test. P-values less than 0.05 were considered statistically significant.
Results
Total aTreg cells were accumulated in mice HNSCC tissue
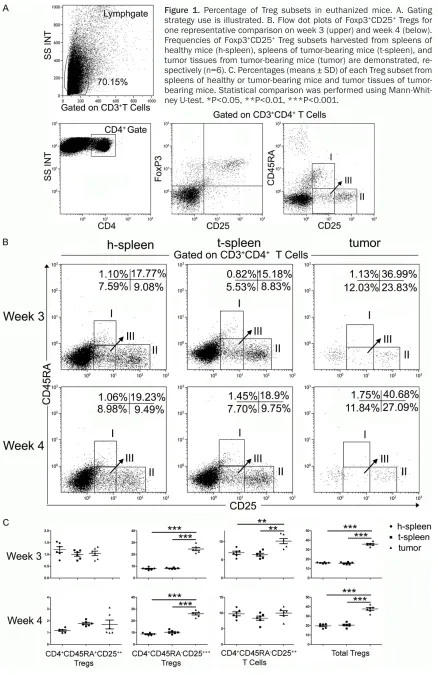
Figure 1A demonstrates the gating strategy to identify the whole CD4+CD25+Foxp3+ Treg
subset. On week 3, the frequency of all CD4+CD25+Foxp3+ Tregs from tumor tissues
0.05, respectively). After 1 week of tumor-glow-ing, more Treg cells were gathered in spleens of tumor-bearing mice sacrificed on week 4 than that on week 3 (20.57±0.94% vs. 15.66± 0.47%, P<0.001). Results showed that, with tumors planted, total Tregs accumulated wi- thin the tumor-microenvironment. Further in- vestigation, however, should be done to deter-mine the distribution of the 3 subsets from increased Tregs.
aTreg cells were the major factor of treg cell accumulation in mice HNSCC tissue
After dividing the whole Treg subset into th- ree distinct subsets, frequencies of each sub-set were assessed from tumor tissues of tu- mor-bearing mice, spleens of healthy mice(h-spleen), and spleens of tumor-bearing mice (t-spleen) (Figure 1B).
On week 3, the frequency of CD4+CD45RA+
Foxp3low Tregs (rTregs) from t-spleen (0.99±
0.07%) was similar to that from h-spleen (1.21±0.12%, P>0.05) or tumor tissues (1.05± 0.09%, P>0.05). Frequency of CD4+CD45RA
-Foxp3low T-cells from t-spleen (6.43±0.40%)
was similar to that from h-spleen (6.95±0.45%,
P>0.05), but lower than that from tumor tissu- es (10.18±0.40%, P<0.01). The frequency of CD4+CD45RA-Foxp3high Tregs (aTregs) from t-sp-
leen (8.23±0.22%) was higher than that from h-spleen (6.43±0.40%, P<0.01), but lower than the dramatically increased frequency of the same subset from tumor tissues (24.62±1.30%, P<0.0001).
On week 4, the frequency of aTregs from tumor tissues remained much higher than that from h-spleen or t-spleen (25.98±1.02% vs. 8.80± 0.42%, P<0.0001; 25.98±1.02% vs. 10.43± 0.64%, P<0.0001), while the latter two did not differ from each other (P>0.05).
Moreover, after 1 week of tumor-growing, more aTregs were recruited to tumor tissues on week 4 than on week 3 (25.98±1.02% vs. 24.62± 1.30%, P>0.05), yet statistical significance was not reached.
aTreg cells had better suppressive function
[image:5.612.95.519.70.321.2]Tregs were obtained from tumor tissues of 6 randomly selected mice after 28 days of tumor-bearing and sorted into three distinct Treg subsets. Each subset was co-cultured with
autologous CD25-CD45RA+CD4+ responder ce-
lls (Figure 2A-D). After 72 hours of co-culturing, CD45RA+CD25++ Tregs showed a higher
sup-pression rate compared with CD45RA-CD25+
Tregs, but differences were not significant (71.67±4.96% vs. 84.50%±3.05%, P>0.05). These 2 subsets both induced a higher sup-pression rate to CD45RA-CD25++CD4+ T-ce-
lls (71.67±4.96% vs. 57.15±3.79%, P<0.05; 84.50%±3.05% vs. 57.15±3.79%, P<0.001, Figure 2E). Mice CD45RA-CD25++CD4+ T-cells
had better suppressive function compared wi- th the same subset assessed from HNSCC
patients [17], in accordance with a previous study [19].
CCR4 was predominantly expressed on aTreg cells
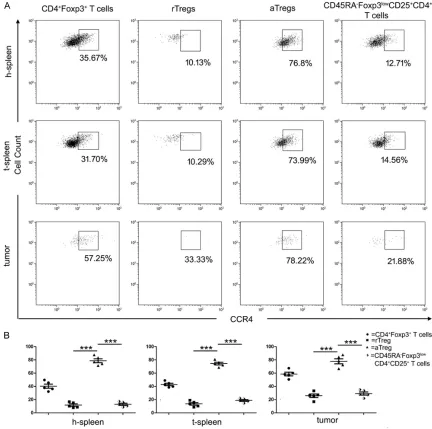
To evaluate the importance of CCR4 in recruit-ing aTreg cells to the mice tumor microenviron-ment in HNSCC, expression of CCR4 was as- sessed in Treg cells from h-spleen, t-spleen, and tumor-tissues (n=5) (Figure 3). It was found that among all CD4+CD25+Foxp3+ Treg cells,
[image:6.612.88.520.72.501.2]Treg cells from tumor tissues (60.42±2.77%)
had a significantly higher CCR4 expression than Treg cells from t-spleen (40.29±4.34%, P< 0.001) or h-spleen (41.19±3.00%, P<0.001). After dividing CD4+CD25+Foxp3+ Treg cells into
three distinct subsets, results showed that from the h-spleen group, aTreg cells (78.64± 2.94%) expressed CCR4 on a higher level than rTreg cells (11.70±1.78%, P<0.001%) and CD- 45RA-CD25++CD4+ T-cells (12.98±1.60%, P<
0.001%). From the t-spleen group, aTreg ce- lls (74.37±0.04%) expressed CCR4 on a high- er level than rTreg cells (13.51±1.86%, P<0.001%) and CD45RA-CD25++CD4+ T-cells
(18.70±1.28%, P<0.0001%). From tumor tis-sues, aTreg cells (77.82±3.84%) expressed CCR4 on a higher level than rTreg cells (25.77± 2.64%, P<0.001%) and CD45RA-CD25++CD4+
T-cells (29.11±2.36%, P<0.001%).
Moreover, aTreg cells from tumor tissues ex- pressed CCR4 on a similar level as aTreg ce- lls from h-spleens and t-spleens (77.82± 3.84% vs. 78.64±2.94%, P>0.05; 77.82±3.84% vs. 74.37±0.04%, P>0.05).
The results showed that aTregs from different origins have a dramatically higher CCR4 expres-sion, suggesting that CCR might be a key fac- tor for accumulation of aTregs in the tumor microenvironment.
Tumor tissues had higher expression of CCR4-binding ligands
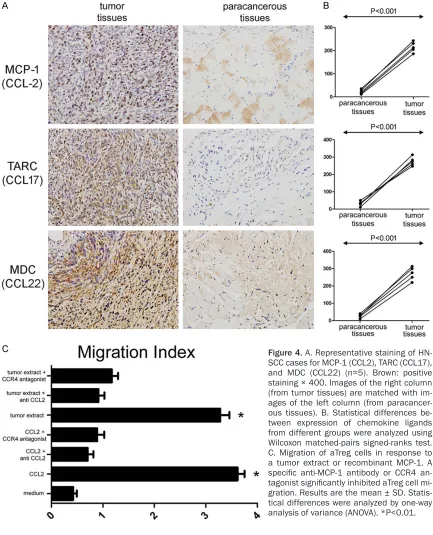
CCR4 is a receptor for monocyte chemoat- tractant protein-1 (MCP-1)/CCL2, thymus and activation regulated chemokine (TARC)/CCL- 17, and macrophage-derived chemokine (MDC)/CCL22. To confirm expression of these endogenous CCR4-binding ligands in the HNSCC microenvironment, immunohistoche- mical analysis was used to assess expres- sion of these chemokine ligands in paired tumor and paracancerous tissues from 5 HN- SCC tumor-bearing mice (Figure 4A). Intere- stingly, CCL2, CCL17, and CCL22 were all inc- reased in tumor tissues compared with para-cancerous tissues (215.6±22.27 vs. 21.80± 9.731, P<0.001; 275.6±25.08 vs. 30.92± 14.02, P<0.001; 271.5±37.46 vs. 26.81±10.94, P<0.001 (Figure 4B). Immunohistochemistry results were consistent with the postulation that mouse aTreg cells could be recruited to the tumor microenvironment by ligands through binding to CCR4.
CCR4 antagonist inhibited the recruitment of aTreg cells
The ability of CCR4 to recruit mouse aTreg cells to tumor-tissues was evaluated (Figure 4C). Based on a study on migration of aTreg cells from HNSCC patients, MCP-1 (CCL2) was cho-sen to demonstrate the hypothesis. Freshly sorted aTreg cells from tumor tissues were ana-lyzed in migration assays (n=3). Results show- ed that tumor extracts and MCP-1 (CCL2) in- duced significant migration of aTreg cells (P< 0.01 vs. control [medium]; P<0.01 vs. control [medium]). Using a monoclonal antibody ag- ainst mice MCP-1 (CCL2) and a CCR4 antago-nist, migration of aTreg cells was severely bl- ocked, even if induced by tumor extracts of MCP-1 (CCL2) (P<0.01 for each; P<0.01 for ea- ch). These results suggest that blocking CCR4-induced-pathways by addressing CCR4 anta- gonist may result in the inhibition of Treg recruitment.
Discussion
Previous studies have shown that aTreg cells are increased in the peripheral circulation in HNSCC patients and that accumulation of aTreg cells in HNSCC tumor tissues may accelerate disease progression and predict poor survival [16-18]. Therefore, it is of great value to block Treg cell recruitment into the tumor microenvi-ronment. This study aimed to demonstrate the feasibility of this strategy with HNSCC mice. CD25 and CD45RA were used as two markers to classify Tregs into three distinct subsets. Mouse CD45RA-CD25++CD4+ T-cells showed a
higher suppression rate compared to the same Treg subset in humans, which was in accor-dance with previous study. However, CD45RA
-CD25+++ Tregs had significantly higher
HNSCC patients [16-18]. Given the distribution of Treg subsets, it is of great value to inhibit highly suppressive aTreg cells from recruitment to HNSCC tumor microenvironment.
Chemokine receptors have been reported to play a critical role in recruiting immunoregula-tory cells [12, 20-23]. Previous work has shown that aTreg cells predominantly express CCR4
compared with CD4+Foxp3+/- T-cells and other
[image:8.612.90.523.72.607.2]immune cells [18]. Based on the many similari-ties aTreg cells share between mice and humans, it is reasonable to assume that mouse aTreg cells also predominantly express CCR4. To verify this theory, CCR4 expression was assessed in different Treg subsets. The data showed that CCR4 was predominantly ex- pressed in aTreg cells from various origins,
showing that high expression of CCR4 is a unique characteristic for mice aTreg cells. Moreover, data showed that MCP-1 (CCL2), TARC (CCL17), and MDC (CCL22), all chemoat-tractant ligands for CCR4, were highly express- ed in HNSCC tumor tissues compared with adjacent nontumor tissues. These results st- rongly suggest that interaction between CCR4 and its ligands plays a vital role in the recruit-ment of mouse aTreg cells towards the tumor microenvironment.
In addition, the in vitro experiment showed that by using a CCR4 antagonist, aTreg migration capacity was largely exhibited. While some ear-lier studies demonstrated that anti-human CCR4 monoclonal antibodies can enhance an- titumor immune response in cancer patients, this study is the first to report that use of a CCR4 antagonist exhibits mice aTreg cell migra-tion without depleting any fragment of CD25+
T-cells in peripheral circulation, possibly ex- plaining the clinical failure and eruption of auto-immunity of CD25 depleting strategy in some studies [24, 25].
In conclusion, this present study suggests that mouse aTreg cells predominantly express CCR4 and that CCR4 antagonists can block migration of mouse aTreg cells. Therefore, future studies should focus on the use of CCR4 antagonists, in vivo, which may result in the exhibition of tumor growth and longer mouse survival.
Acknowledgements
This study was supported by The National Natural Science Foundation of China (81602- 365) and The National Natural Science Fo- undation of Guangdong Province (2017A03- 0313700).
Disclosure of conflict of interest
None.
Address correspondence to: Dr. Wei-Ping Wen, Department of Otorhinolaryngology Head and Neck Surgery, The First Affiliated Hospital of The Sun Yat-Sen University, 58 Zhongshan Road II, Guangzhou 510080, China. Tel: +86-20-13538885840; E-mail: [email protected]
References
[1] Parkin DM, Bray F, Ferlay J and Pisani P. Global cancer statistics, 2002. CA Cancer J Clin 2005; 55: 74-108.
[2] Forastiere A, Koch W, Trotti A and Sidransky D. Head and neck cancer. N Engl J Med 2001; 345: 1890-1990.
[3] Alhamarneh O, Amarnath SM, Stafford ND and Greenman J. Regulatory T cells: what role do they play in antitumor immunity in patients with head and neck cancer? Head Neck 2008; 30: 251-261.
[4] Khazaie K and von Boehmer H. The impact of CD4+CD25+ Treg on tumor specific CD8+ T cell cytotoxicity and cancer. Sermin Cancer Biol 2006; 16: 124-136.
[5] Zou W. Regulatory T cells, tumor immunity and immunotherapy. Nat Rev Immunol 2006; 6: 295-307.
[6] Ma R, Jiang T and Kang X. Circulating microR-NAs in cancer: origin, function and application. J Exp Clin Cancer Res 2012; 31: 38.
[7] Kobayashi N, Hiraoka N, Yamagami W, Ojima H, Kanai Y, Kosuge T, Nakajima A and Hiro-hashi S. FOXP3+ regulatory T cells affect the development and progression of hepatorcar-cinogenesis. Clin Cancer Res 2007; 13: 902-911.
[8] Chen Y, Zhang Y, Liao W, Zhou J, He G, Xie X, Fei R, Qin L, Wei L and Chen H. FOXP3 gene polymorphism is associated with hepatitis B-related hepatocellular carcinoma in China. J Exp Clin Cancer Res 2013; 32: 39.
[9] Okita R, Saeki, Takashima S, Yamaguchi Y and Toge T. CD4+CD25+ regulatory T cells in the pe-ripheral blood of patients with breast cancer and nonsmall cell lung cancer. Oncol Rep 2005; 14: 1269-1273.
[10] Dannull J, Su Z, Rizzieri D, Yang BK, Coleman D, Yancey D, Zhang A, Dahm P, Chao N, Gilboa E and Vieweg J. Enhancement of vaccine-medi-ated antitumor immunity in cancer patients after depletion of regulatory T cells. J Clin In-vest 2005; 115: 3623-3633.
[11] Attia P, Maker AV, Haworth LR, Rogers-Freezer L and Rosenberg SA. Inability of a fusion pro-tein of IL-2 and diphtheria toxin (Denileukin Diftitox, DAB389IL-2, ONTAK) to eliminate reg-ulatory T lymphocytes in patients with melano-ma. J Immunother 2005; 28: 582-592. [12] Nishikawa H and Sakaguchi S. Regulatory T
cells in tumor immunity. Int J Cancer 2010; 127: 759-767.
[14] Rech AJ, Mick R, Martin S, Recio A, Aqui NA, Powell DJ Jr, Colligon TA, Trosko JA, Leinbach LI, Pletcher CH, Tweed CK, DeMichele A, Fox KR, Domchek SM, Riley JL and Vonderheide RH. CD25 blockade depletes and selectively reprograms regulatory T cells in concert with immunotherapy in cancer patients. Sci Transl Med 2012; 4: 134-162.
[15] Miyara M, Yoshioka Y, Kitoh A, Shima T, Wing K, Niwa A, Parizot C, Taflin C, Heike T, Valeyre D, Mathian A, Nakahata T, Yamaguchi T, No-mura T, Ono M, Amoura Z, Gorochov G and Sakaguchi S. Functional delineation and differ-entiation dynamics of human CD4+ T cells ex-pressing the Foxp3 transcription factor. Immu-nity 2009; 30: 899-911.
[16] Sun W, Li WJ, Wu CY, Zhong H and Wen WP. CD45RAFoxp3high but not CD45RA+Foxp3low suppressive T regulatory cells increased in the peripheral circulation of patients with head and neck squamous cell carcinoma and corre-lated with tumor progression. J Exp Clin Cancer Res 2014; 33: 35.
[17] Sun W, Li WJ, Fu QL, Wu CY, Lin JZ, Zhu XL, Hou WJ, Wei Y, Wen YH, Wang YJ and Wen WP. Func-tionally distinct subsets of CD4+ regulatory T cells in patients with laryngeal squamous cell carcinoma are indicative of immune deregula-tion and disease progression. Oncol Rep 2015; 33: 354-362.
[18] Sun W, Li WJ, Wei FQ, Wong TS, Lei WB, Zhu XL, Li J and Wen WP. Blockade of MCP-1/CCR4 signaling-induced recruitment of activated reg-ulatory cells evokes an antitumor immune re-sponse in head and neck squamous cell carci-noma. Oncotarget 2016; 7: 37714-37727. [19] Baecher-Allan CM and Hafler DA. Functional
analysis of highly defined FACS-isolated popu-lations of human regulatory CD4+CD25+ T cells. Clin Immunol 2005; 117: 192.
[20] Curiel TJ, Coukos G, Zou L, Alvarez X, Cheng P, Mottram P, Evdemon-Hogan M, Conejo-Garcia JR, Zhang L, Burow M, Zhu Y, Wei S, Kryczek I, Daniel B, Gordon A, Myers L, Lackner A, Disis ML, Knutson KL, Chen L and Zou W. Specific recruitment of regulatory T cells in ovarian car-cinoma fosters immune privilege and predicts reduced survival. Nat Med 2004; 10: 942-949.
[21] Parsonage G, Machado LR, Hui JW, McLarnon A, Schmaler T, Balasothy M, To KF, Vlantis AC, van Hasselt CA, Lo KW, Wong WL, Hui EP, Chan AT and Lee SP. CXCR6 and CCR5 localize T lym-phocyte subsets in nasopharyngeal carcino-ma. Am J Pathol 2012; 180: 1215-1222. [22] Zou W, Machelon V, Coulomb-L’Hermin A,
Bor-vak J, Nome F, Isaeva T, Wei S, Krzysiek R, Du-rand-Gasselin I, Gordon A, Pustilnik T, Curiel DT, Galanaud P, Capron F, Emilie D and Curiel J. Stromal-derived factor-1 in human tumors recruits and alters the function of plasmacy-toid precursor dendritic cells. Nat Med 2001; 7: 1339-1346.
[23] Iellem A, Mariani M, Lang R, Recalde H, Pani-na-Bordignon P, Sinigaglia F and D’Ambrosio D. Unique chemotactic response profile and specific expression of chemokine receptors CCR4 and CCR8 by CD4(+)CD25(+) regulatory T cells. J Exp Med 2001; 194: 847-853. [24] Kurose K, Ohue Y, Wada H, Iida S, Ishida T,
Ko-jima T, Doi T, Suzuki S, Isobe M, Funakoshi T, Kakimi K, Nishikawa H, Udono H, Oka M, Ueda R and Nakayam E. Phase Ia study of FoxP3+ CD4 Treg depletion by infusion of a humanized Anti-CCR4 antibody, KW-0761, in cancer pa-tients. Clin Cancer Res 2015; 21: 4327-4336. [25] Duvic M, Pinter-Brown LC, Foss FM, Sokol L,
Jorgensen JL, Challagundla P, Dwyer KM, Zhang X, Kurman MR, Ballerini R, Liu L and Kim YH. Phase 1/2 study of mogamulizumab, a defucosylated anti-CCR4 antibody, in previ-ously treated patients with cutaneous T-cell lymphoma. Blood 2015; 125: 1883-1889. [26] Lee H, Lee H, Kwon Y, Lee JH, Kim J, Shin MK,
Kim SH and Bae H. Methyl gallate exhibits po-tent antitumor activities by inhibiting tumor in-filtration of CD4+CD25+ regulatory T cells. J Im-munol 2010; 185: 6698-6705.