Original Article
Altering of FTO in the serum and livers
of NAFLD patients: a correlation analysis
Jianjin Guo1*, Wei Ren2*, Xing Li1, Guangxia Xi2, Yuanbin Li2, Linlin Gao2, Jie Liu3, Dongming Su4
1Department of Endocrinology, The Second Affiliated Hospital of Shanxi Medical University, Taiyuan 030001,
China; 2Department of Endocrinology, Shanxi Academy of Medical Sciences & Shanxi Dayi Hospital, Taiyuan
030001, China; 3Department of Endocrinology, Shanxi Province People’s Hospital, Taiyuan 030001, China; 4The
Center of Metabolic Disease Research, Nanjing Medical University, Nanjing 210029, China. *Equal contributors. Received March 15, 2016; Accepted August 15, 2016; Epub June 15, 2018; Published June 30, 2018
Abstract: Nonalcoholic fatty liver disease (NAFLD), caused by a type of fatty liver without excessive alcohol intake, is characterized by steatosis, ballooning degeneration, and fatty retention of liver parenchyma cells. NAFLD’s major spectrum includes nonalcoholic simple fatty liver (NAFL) and nonalcoholic steatohepatitis (NASH);however, the rela-tionship between NAFLD and the fat mass and obesity associated (FTO) gene are not fully understood. To address this, we collected clinical basic parameters of NAFLD and control patients, measured FTO expression levels in their serum and livers by using ELISA, qRT-PCR and Western blot, and analyzed the correlation of FTO expression levels to the clinical basic parameters. NAFLD more often occurs in middle-aged males, and the clinical basic parameters were significantly increased in NAFLD patients with the exception of HDL. The serum FTO expression level of the NAFLD patient group was significantly higher compared to the control group; however, within the NAFLD patient group, the expression level in the NASH group was significantly greater compared to the NAFL group, and was posi-tively correlated to body mass index (BMI) in the NAFL group and total cholesterol in the NASH group. Similarly, the liver FTO expression level of the NAFLD patient group was significantly higher compared to the control group, and also significantly increased in the NASH group compared to the NAFL group. This study provides a significant refer-ence for the study of FTO in NAFLD patients their treatment.
Keywords: Nonalcoholic fatty liver disease, nonalcoholic simple fatty liver, nonalcoholic steatohepatitis, clinical basic parameters, fat mass and obesity associated gene, correlation analysis
Introduction
The recent revelation of high-fat diets causing non-alcoholic fatty liver disease (NAFLD) has aroused the concern of people worldwide, and has therefore caused a decreased prevalence of NAFLD by 20% to 35% due to living quality improvements [1-3]. NAFLD is characterized by a series of hepatic pathological changes, such as simple steatosis, non-alcoholic steatohepa-titis and cirrhosis; its major disease spectrum includes nonalcoholic simple fatty liver (NAFL) and nonalcoholic steatohepatitis (NASH) [1, 4]. NAFL, defined as a simple steatosis [5-7], appreciably differs from NASH, which is charac-terized by inflammatory infiltrate, ballooning and necroapoptosis [8-11]. According to an epi-demiological survey, NAFLD is closely related to several metabolic syndromes, such as obesity, diabetes mellitus, and hyperlipemia [12-14]. Of the patients with NAFL, 10%-20% will have their
NAFL develop into NASH, and 1.5%-3% of patients’ NAFL will develop into liver fibrosis, thereby seriously threatening their health [2, 15]. The pathogenesis of NAFLD is not yet understood; the ‘two-hit’ theory has been rec- eived with extensive concern [15-17]. Under metabolic stress conditions, such as obesity, type 2 diabetes mellitus, and dyslipidemia, sev-eral inflammatory cytokines, such as tumor necrosis factor-alpha (TNF-α), interleukin-6 (IL-6), and interferon (IFN), may induce insulin resistance followed by a deposition of fatty acid and triglyceride in the liver-further inducing simple steatosis [3, 18]. Liver cells and their mitochondria arethen subjected to secondary damaged by oxidative stress, cytokines, and adipocytokines.
rec-ognized as the most robust predictor of poly-genic obesity [19, 20]. It encodes for a Fe(II)- and 2-oxoglutarate dependent nucleic acid demethylase present in the nucleus. Several risk alleles for FTO, such as the rs9939609, rs9930506, rs1421085, rs17817449, and rs- 1121980 polymorphisms, are known to associ-ate with obesity and a higher body mass index (BMI) [21, 22]. FTO is widely expressed in the nucleus of human tissues; the brain has the highest expression level, especially in the arcu-ate nucleus of the hypothalamus, which is known to play a major role in controlling energy homeostasis and eating behavior [23-25]. The potential role of FTO in energy homeostasis, which has been well documented by several researchers in humans, mice, and rodents, is the regulation of the FTO mRNA expression by food intake, circulating glucose levels, weight status, and energy expenditure [26, 27]. Fto
knockout mice exhibit normal embryonic devel-opment, but high postnatal lethality, growth retardation, lower weight and adiposity mea-sures, and experience initial reduced weight and lean mass [28-30]. Fto knockout mice were protected from diet-induced obesity throughout their entire life span when consuming a high fat diet, while a high fat intake augmented weight gain in mice with FTO over-expression [31, 32]. A number of possible but inconclusive mecha-nisms for FTO’s role in explaining these findings have been proposed. Such as, FTO may influ-ence protein and/or fat utilization, as well as energy expenditure and adrenalin levels [33]. NAFLD as a significant disease is associated with several metabolic syndromes, such as obesity, type 2 diabetes mellitus, and dyslipid-emia [34-36]; therefore, we hypothesize that
FTO may be involved in regulating the patho-genesis of NAFLD. After measuring the FTO
expression levels in the serum and livers of NAFLD and control patients, we found that the
FTO expression level is significantly associated with NAFLD thus providing a significant refer-ence for studying and treating NAFLD.
Materials and methods
Patients and basic clinical information collec-tion
A total of 255NAFLD patients and 100 healthy patient controls were enrolled from October 2013 to October 2015 in the Six People’s Hospital Affiliated to Shanghai JiaoTong Univ- ersity. Blood samples were collected prior to any therapeutic procedure. The NAFLD patie-
nts, after excluding those with significant alco-hol consumption (female >20 g/day and male >30 g/day) and any pre-existing liver disease, were further divided into two groups according to the clinical diagnosis: 130 cases of NAFL and 125 cases of NASH. The healthy patient controls underwent a routine health examina-tion to asses for any evidence or history of liver pathology, an unremarkable liver ultrasound, normal liver stiffness, and no elevation of serum transaminases alanine aminotransfer-ase (AST) or aspartate aminotransferaminotransfer-ase (ALT). We also excluded patients with a history of cor-onary heart disease, hypertension, valvular dis-ease, and any arrhythmia or systemic disease. In addition, the basic clinical information of the control patients, NAFL, and NASH groups were collected, including age, gender, body mass index (BMI), waistline, hipline, waist-hip ratio, fasting blood glucose (FBG), fasting insulin, total cholesterol (TC), triglyceride (TG), high density lipoprotein (HDL), low density lipopro-tein (LDL), ALT, and AST. Subsequently, liver biopsies were also obtained and stored in -80°C refrigerator for further use. All patients provided written informed consent to partici-pate in this study, and it was approved by the Ethics Committee of the Six People’s Hospital Affiliated to Shanghai JiaoTong University.
Serum FTO levels assayed by ELISA
The collected blood samples were incubated at room temperature (RT) for 2 h followed by cen-trifugation at 3,000 rpm for 20 min; the super-natant was carefully collected to examine the
CAGGCTGGCAAGGATGGA-3’ (reverse). The qRT-PCR reaction mixture was prepared by mixing: 10 μL 2×Master Mix, 0.08 μL forward primer, 0.08 μL reverse primer, 2 μL cDNA template, 0.4 μL Taq DNA polymerase, and 7.44 μL ddH2O. Amplification was performed as follow-ing: 95°C 3 min→(95°C 12 s→62°C 30 s), 40 cycles→72°C 30 s. The results were analyzed using the SDS 1.4 software (Applied Biosy- stems), and a histogram was generated using the Origin 9.5 software (http://www.originlab. com/).
Western blot assay
The total protein collected from the liver tissues was extracted and examined by using the BCA Protein Assay Kit (ZKP-C150046-1, Suzhou Zeke biotech Co., LTD, Jiangsu, China). About 35 μg of protein samples were fractionated by electrophoresis through 12.5% polyacrylamide gels, and transferred to a polyvinylidene difluo-ride membrane following the manufacturers’ instructions. The membrane was probed with the first antibody, a mouse-derived anti-FTO antibody (ab92821, Abcam, United Kingdom), mouse-derived anti-GAPDH (ab8245, Abcam, United Kingdom) for 1.5 h at room temperature. Afterward, the membrane was incubated with horseradish peroxidase-conjugated goat anti-mouse secondary antibody (1:5,000 in TBST; Beijing Golden Bridge Biotechnology Co., Ltd, China) at room temperature for 1 h. The chemi-luminescence luminol reagent (ZKP-C150044-1, Suzhou Zeke biotech Co., LTD, Jiangsu, China) was used to develop the immune-labeled bands on X-ray film, and the optical density of the bands was quantified using the ImageJ 1.46 software (http://rsb.info.nih.gov/ij/down-load.html), and a histogram was generated using the Origin 9.5 software (http://www. originlab.com/).
Statistical analysis
All data is expressed as the mean ± standard deviation (SD). Statistical analysis was per-formed using SPSS software (version 21.0, http://spss.en.softonic.com/; Chicago, IL, USA). The differences between the groups were eval-uated by one-way ANOVA. Student’s t-tests were performed in a group of two samples, and correlation analysis was performed with the bivariate Pearson’s Rank correlation test;
P<0.05 and P<0.01 were used to indicate sig-and analyzed by using SPSS software (version
21.0, http://spss.en.softonic.com/; Chicago, IL, USA), and histogram analysis was performed using Origin 9.5 software (http://www.originlab. com/).
Total RNA extraction of liver
A total of 100 mg of collected liver tissue from the patients was frozen in liquid nitrogen and grounded for a total RNA extraction with TRIzol, in accordance with the manufacturer’s instruc-tions. After grinding, 1 mL of TRIzol was added and mixed for 30 s; samples were incubated at room temperature for 5 min and then centrifu-gation at 4°C, at 12,000 rpm for 10 min. The supernatant was collected, 200 μL chloroform was added and mixed in for 15 s, incubated at room temperature for 3 min, and then centri-fuged at 4°C, at 12,000 rpm for 15 min. An equal volume of isopropyl alcohol was mixed in with the absorbed aqueous phase, incubated at room temperature for 30 min, and then cen-trifuged at 4°C, at 12,000 rpm for 10 min; the supernatant was removed. The pellet was washed with 1 mL of 75% ethanol, centrifuged at 4°C, at 5,000 rpm for 3 min, The residual liquid was then removed, and left to air-dry at room temperature. After adding100 μL of RNAse-free ddH2O and centrifuging at room temperature, at 12,000 rpm for 2 min, the effluent was collected, and the concentration and the purity of RNA were examined by ultra-violet spectrophotometry.
Quantitative reverse transcription-polymerase chain reaction (qRT-PCR) assay of FTO in liver
nificant differences and highly significant diff- erences, respectively.
Results
The clinical basic parameters of NAFLD pa-tients
NAFLD often occurred in middle-aged men; age was significantly increased in the NAFL and NASH groups when compared the control group (**: P<0.01), and also significantly increased in the NASH group compared to the NAFL group (§: P<0.01) (Table 1). The male ratio was sign-ificantly increased, 73.1% in the NAFL group and 78.4% in the NASH group, when compare to the 52% male ration in the control group (**:
P<0.01); the male ration was also significantly increased in NASH group compared to the NAFL group (§: P<0.01). Similarly, several clinical
compared to the NAFL group (§: P<0.01), with the exception of HDL. The HDL level was signifi-cantly decreased, 1.19 ± 0.16 in NAFL group and 1.07 ± 0.10 in NASH group, when com-pared to the 1.41 ± 0.10 level of control group (**: P<0.01); and also significantly decreased in the NASH group compared to the NAFL group (§: P<0.01).
The FTO expression level was significantly increased in the serum of NAFL and NASH patients when compared control patients, and significantly correlated to BMI, waistline, and TG in the control group; to age, BMI, FBG, ALT, AST in the NAFL group; to TC, HDL in the NASH group
The FTO level in the serums of NAFL and NASH patients was significantly higher, 34.57 ± 1.734 and 45.56 ± 1.58, respectively, when
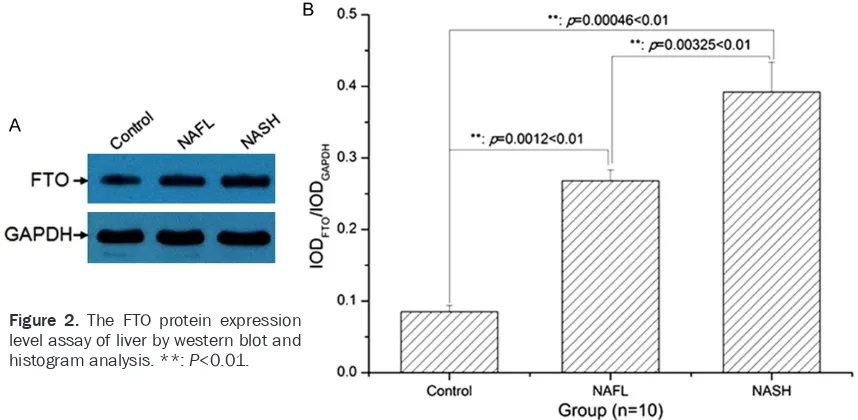
com-Table 1. The basic parameters of NAFLD patients in the clinic
Parameters Control (n=100) Groups (Mean ± SD)
NAFL (n=130) NASH (n=125)
Age (year) 45.67 ± 2.22 48.71 ± 3.34** 49.70 ± 3.87**,§
Gender Male 68 95 98
Female 32 35 27
Male ratio (%) 68.0 73.1 78.4
BMI (kg/m2) 23.59 ± 1.44 26.37 ± 1.38** 30.27 ± 2.50**,§
Waistline (cm) 85.76 ± 1.85 94.03 ± 1.84** 101.12 ± 3.26**,§
Hipline (cm) 98.05 ± 2.49 100.87 ± 3.59** 101.47 ± 3.04**,§
Waist-hip ratio (%) 87.52 ± 3.00 93.33 ± 3.67** 99.74 ± 4.30**,§
FBG (mmol/L) 4.42 ± 0.18 5.46 ± 0.13** 5.71 ± 0.14**,§
Fasting insulin (μIU/mL) 7.47 ± 0.24 17.62 ± 0.203** 25.88 ± 1.59**,§
TC (mmol/L) 4.71 ± 0.48 5.02 ± 0.53** 5.23 ± 0.24**,§
TG (mmol/L) 1.05 ± 0.10 1.54 ± 0.12** 2.49 ± 1.21**,§
HDL (mmol/L) 1.41 ± 0.10 1.19 ± 0.16** 1.07 ± 0.10**,§
LDL (mmol/L) 2.67 ± 0.13 2.87 ± 0.17** 3.24 ± 0.21**,§
ALT (U/L) 24.46 ± 0.35 29.10 ± 0.92** 40.61 ± 1.01**,§
AST (U/L) 24.40 ± 1.78 26.44 ± 1.65** 31.88 ± 1.68**,§
[image:4.612.91.523.84.323.2]Note: **: P<0.01; §: P<0.01; SD indicates the standard deviation; NAFL indicates thenon-alcoholic fatty liver; NASH indicates the non-alcoholic steatohepatitis; BMI indicates bodymass index; FBG indicates the fasting blood glucose; TC indicates the total cholesterol; TG indicates the triglyceride; HDL indicates the high density lipoprotein; LDL indicates the low densitylipopro-tein; ALT indicates the alanine aminotransferase; AST indicates the aspartateaminotransferase.
Table 2. The content measurement of FTO in serum
Parameters Control (n=100) Groups (Mean ± SD)NAFL (n=130) NASH (n=125)
FTO 18.57 ± 0.59 34.57 ± 1.734** 45.56 ± 1.58**,§
Note: **: P<0.01; §: P<0.01; FTO indicates the fat mass and obesity associ-ated gene.
[image:4.612.90.356.404.439.2]pared to the 18.57 ± 0.59 level of the control group (**: P<0.01); and also significantly incr- eased in the NASH group when compared to the NAFL group (§: P<0.01) (Table 2). A correla-tion analysis showed that the FTO level in serum was positively correlated to waistline in
protein expression levels in the serum and liver were significantly increased in NASH and NAFL patients when compared to the controls, and significantly increased in NASH patients when compared to NAFL patients. The expression level of FTO in the serum was positively
corre-Table 3. The correlation analysis of FTO in serum to the basic index of NAFLD patients
Parameters
Correlation
Control NAFL NASH
p-value r-value p-value r-value p-value r-value
Age 0.269 0.026 0.044 -0.151* 0.289 -0.050
BMI 0.013 -0.222* 0.041 0.153* 0.222 0.069
Waistline 0.003 0.272** 0.325 0.040 0.211 -0.073 Hipline 0.194 0.087 0.055 0.141 0.146 -0.095 Waist-hip ratio 0.149 0.105 0.109 -0.109 0.431 0.016
FBG 0.210 0.081 0.003 -0.240** 0.360 -0.032
Fasting insulin 0.279 -0.059 0.498 0.001 0.312 -0.044
TC 0.173 -0.095 0.379 -0.023 0.001 0.274**
TG 0.011 -0.229* 0.409 -0.020 0.150 0.093
HDL 0.157 -0.102 0.345 -0.035 0.021 -0.182*
LDL 0.280 0.059 0.092 -0.117 0.395 -0.024
ALT 0.376 0.032 0.046 -0.148* 0.268 -0.056
AST 0.244 -0.070 0.042 -0.152* 0.197 0.077
Note: *: P<0.05; **: P<0.01. NAFL indicates the non-alcoholic fatty liver; NASH indicates the non-alcoholic steatohepatitis; BMI indicates body mass index; FBG indicates the fasting blood glucose; TC indicates the total cholesterol; TG indi-cates the triglyceride; HDL indiindi-cates the high density lipoprotein; LDL indiindi-cates the low density lipoprotein; ALT indicates the alanine aminotransferase; AST indicates the aspartate aminotransferase.
the control group, tp BMI in the NAFL group, and to TC in the NASH group, and negatively correlated to BMI in all groups, to TG in the control group, to age, FBG, ALT, and AST in the NAFL group, and to HDL in the NASH group, and however no regression function (Table 3).
FTO mRNA and protein levels were significantly increased in livers of NAFL and NASH patients when compared the control patients
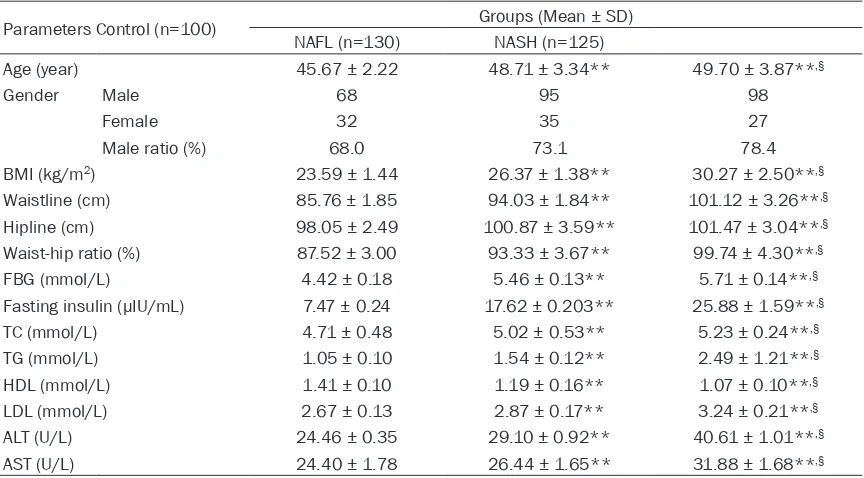
The FTO mRNA level was sig-nificantly increased in the liv-ers of NAFL and NASH patie- nts when compared to the con-trol patients (**: P<0.01); and also significantly increased in the NASH group in when com-pared to the NAFL group (§:
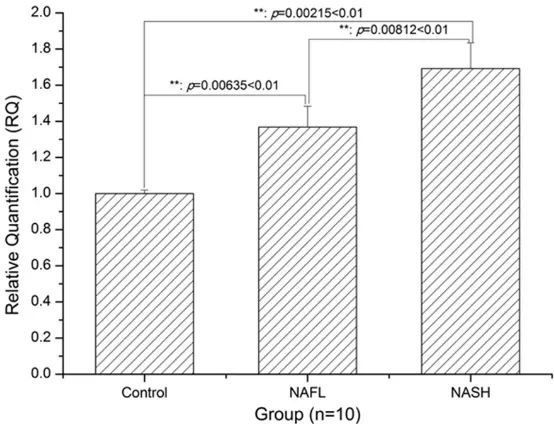
P<0.01) (Figure 1). Similarly, the FTO protein level was also significantly increased in livers of NAFL and NASH patients when compared the control patients (**: P<0.01); and also significantly increased in the NASH group when compared to the NAFL group (**: P<0.01) (Figure 2).
Discussion
[image:5.612.91.372.96.309.2]The present study demon-strates that NAFLD often occ- urred more often middle-aged males when compared to the controls; a significantly incre- ased number of NASH patients when compared to NAFL pati- ents; the other clinical basic parameters, including BMI, waistline, hipline, waist-hip ra- tio, FBG, fasting insulin, TC, TG, LDL, ALT, and AST, exhibited the same trend with the ex- ception of HDL. The mRNA and
Figure 1. Histogram analysis of FTO mRNA expression level in the liver. **:
[image:5.612.92.369.395.607.2]lated to the waistlines of control patients, to BMI in the NAFL group, and to TC in the NASH group, and negatively correlated to BMI, TG in the control patients, to age, FBG, ALT, AST in the NAFL group, and to HDL in NASH group, and however no regression function.
NAFLD, a chronic liver disease that is often caused, worldwide, by high-fat diets, is com-bined with several metabolic syndromes, such as obesity, type 2 diabetes mellitus, and dys- lipidemia [34-36]. As shown with the clinical basic parameters of NAFLD patients, the BMI, waistline, hipline, and waist-hip ratio were sig-nificantly increased in NASH and NAFL patients, and indicated that NAFLD is closely associated with obesity. The FBG, fasting insulin, TC, TG, and LDL were significantly increased in the NASH and NAFL patients thus indicating that NAFLD is closely associated with diabetes and hyperlipidemia. This data demonstrates that NAFLD is a metabolic syndrome with several disease associations.
FTO, a significant fat mass and obesity associ-ated gene with a full length of 400 bp, consists of nine exons, mainly located in the 16q12-q24 of the human chromosome, and encodes for an important energy regulating protein that is closely related to lipid metabolic processes [37-40]. Therefore, we hypothesized that FTO may be significantly expressed in the serum and liv-ers of NAFLD patients, and also be involved in the regulation of NAFLD. The expression levels of FTO in the serum were significantly incre- ased in NAFLD patients, and positively
corre-lated to the waistlines of control patients, to BMI in the NAFL group, and to TC in the NASH group, and negatively correlated to BMI in all groups, to TG in control patients, to age, FBG, ALT, and AST in the NAFL group, and to HDL in the NASH group. Thereby indicating that serum
FTO may act as a significant diagnosis index for NAFLD. Significantly, the mRNA and protein expression levels of FTO in the liver were also increased in NAFLD patients, and especially so in NASH patients. However, the current study is preliminary, and several limitations need to be solved in the future, such as the limited sample size, detection means, and epidemiological sta-tistics; future research should further explore the function of FTO in cells and animals, and help to develop a significant diagnosis index for NAFLD based on FTO expression levels in the serum or liver.
Conclusively, after an epidemiological survey of NAFLD patients, the associated indexes of obe-sity, diabetes, and hyperlipidemia were signifi-cantly changed in NASH and NAFL patients when compared to of the control patients; fur-thermore, FTO expression levels in the serum and liver were closely associated with NAFLD, and provided a significant reference for study-ing and treatstudy-ing NAFLD disease.
Acknowledgements
[image:6.612.93.522.74.284.2]This research project was sponsored by National Natural Science Foundation of China (Grant No. 81400836, No. 81570779).
Figure 2. The FTO protein expression
Disclosure of conflict of interest
None.
Address correspondence to: Jianjin Guo, Depart-
ment of Endocrinology, The second Affiliated Hospital of Shanxi Medical University, No. 382, Wuyi Road, Taiyuan 030001, China. Tel: +86-351-4690188; Fax: +86-351-+86-351-4690188; E-mail: [email protected]
References
[1] Ishii KA and Takamura T. [Non-alcoholic fatty liver disease (NAFLD) /non-alcoholic steato- hepatitis (NASH) and nutrition]. Clin Calcium 2016; 26: 363-367.
[2] Hazlehurst JM, Woods C, Marjot T, Cobbold JF and Tomlinson JW. Non-alcoholic fatty liver dis-ease and diabetes. Metabolism 2016. [3] Xiao J and Tipoe GL. Inflammasomes in
non-alcoholic fatty liver disease. Front Biosci (Land-mark Ed) 2016; 21: 683-695.
[4] Abenavoli L, DI Renzo L, Guzzi PH, Pellicano R, Milic N, DE Lorenzo A. Non-alcoholic fatty liver disease severity, central fat mass and adino-pectin: a close relationship. Clujul Med 2015; 88: 489-493.
[5] Bastati N, Feier D, Wibmer A, Traussnigg S, Bal-assy C, Tamandl D, Einspieler H, Wrba F, Traun-er M, HTraun-erold C and Ba-Ssalamah A. Noninva-sive differentiation of simple steatosis and steatohepatitis by using gadoxetic acid-en-hanced MR imaging in patients with nonalco-holic fatty liver disease: a proof-of-concept study. Radiology 2014; 271: 739-747.
[6] Fuyan S, Jing L, Wenjun C, Zhijun T, Weijing M, Suzhen W and Yongyong X. Fatty liver disease index: a simple screening tool to facilitate diag-nosis of nonalcoholic fatty liver disease in the Chinese population. Dig Dis Sci 2013; 58: 3326-3334.
[7] Park YJ, Lim JH, Kwon ER, Kim HK, Jung MC, Seol KH, Noh WY and Kim NE. Development and validation of a simple index system to pre-dict nonalcoholic fatty liver disease. Korean J Hepatol 2011; 17: 19-26.
[8] Singal AK, Hasanin M, Kaif M, Wiesner R and Kuo YF. Nonalcoholic Steatohepatitis is the Most Rapidly Growing Indication for Simultane-ous Liver Kidney Transplantation in the United States. Transplantation 2016; 100: 607-612. [9] Liu W, Baker RD, Bhatia T, Zhu L and Baker SS.
Pathogenesis of nonalcoholic steatohepatitis. Cell Mol Life Sci 2016; 3: 1969-87.
[10] Ibrahim SH, Hirsova P, Malhi H and Gores GJ. Animal Models of Nonalcoholic Steatohepati-tis: Eat, Delete, and Inflame. Dig Dis Sci 2016; 61: 1325-36.
[11] Caldwell S. NASH (Nonalcoholic steatohepati-tis): A case of multiorganelle failure. Free Rad-ic Biol Med 2014; 75 Suppl 1: S6.
[12] Anstee QM, Seth D and Day CP. Genetic Fac-tors That Affect Risk of Alcoholic and Non-Alco-holic Fatty Liver Disease. Gastroenterology 2016; 150: 1728-1744, e7.
[13] Buzzetti E, Pinzani M and Tsochatzis EA. The multiple-hit pathogenesis of non-alcoholic fat-ty liver disease (NAFLD). Metabolism 2016; 65: 1038-48.
[14] Del Ben M, Polimeni L, Baratta F, Pastori D and Angelico F. The Role of Nutraceuticals for the Treatment of Non-Alcoholic Fatty Liver Dis-ease. Br J Clin Pharmacol 2016; [Epub ahead of print].
[15] Karim MF, Al-Mahtab M, Rahman S and Deb-nath CR. Non-alcoholic Fatty Liver Disease (NAFLD)-A Review. Mymensingh Med J 2015; 24: 873-880.
[16] Petta S, Valenti L, Bugianesi E, Targher G, Bel-lentani S and Bonino F. A "systems medicine" approach to the study of non-alcoholic fatty liver disease. Dig Liver Dis 2016; 48: 333-342. [17] Rodriguez-Ramiro I, Vauzour D and Minihane
AM. Polyphenols and non-alcoholic fatty liver disease: impact and mechanisms. Proc Nutr Soc 2016; 75: 47-60.
[18] Sun W and Chen D. [Diagnosis and multimo-dality therapy for non-alcoholic fatty liver dis-ease]. Zhonghua Gan Zang Bing Za Zhi 2015; 23: 727-729.
[19] Sanchez-Pulido L and Andrade-Navarro MA. The FTO (fat mass and obesity associated) gene codes for a novel member of the non-heme dioxygenase superfamily. BMC Biochem 2007; 8: 23.
[20] Hinney A, Nguyen TT, Scherag A, Friedel S, Bronner G, Muller TD, Grallert H, Illig T, Wich-mann HE, Rief W, Schafer H and Hebebrand J. Genome wide association (GWA) study for ear-ly onset extreme obesity supports the role of fat mass and obesity associated gene (FTO) variants. PLoS One 2007; 2: e1361.
[21] Wahlen K, Sjolin E and Hoffstedt J. The com-mon rs9939609 gene variant of the fat mass- and obesity-associated gene FTO is related to fat cell lipolysis. J Lipid Res 2008; 49: 607-611.
[22] Li H, Wu Y, Loos RJ, Hu FB, Liu Y, Wang J, Yu Z and Lin X. Variants in the fat mass- and obesi-ty-associated (FTO) gene are not associated with obesity in a Chinese Han population. Dia-betes 2008; 57: 264-268.
[24] Ehrlich AC and Friedenberg FK. Genetic Asso-ciations of Obesity: The Fat-Mass and Obesity-Associated (FTO) Gene. Clin Transl Gastroen-terol 2016; 7: e140.
[25] Hess ME and Bruning JC. The fat mass and obesity-associated (FTO) gene: Obesity and be-yond? Biochim Biophys Acta 2014; 1842: 2039-2047.
[26] Han L, Tang L, Wang C, Chen Z, Zhang T, Chen S, Liu S, Peng X, Mai Y and Duan S. Fat mass and obesity-associated gene rs11642015 polymorphism is significantly associated with prediabetes and type 2 diabetes subsequent to adjustment for body mass index. Biomed Rep 2014; 2: 681-686.
[27] Shing EC, Tiwari AK, Brandl EJ, Zai CC, Lieber-man JA, Meltzer HY, Kennedy JL and Muller DJ. Fat mass- and obesity-associated (FTO) gene and antipsychotic-induced weight gain: an as-sociation study. Neuropsychobiology 2014; 69: 59-63.
[28] Hess ME, Hess S, Meyer KD, Verhagen LA, Koch L, Bronneke HS, Dietrich MO, Jordan SD, Saletore Y, Elemento O, Belgardt BF, Franz T, Horvath TL, Ruther U, Jaffrey SR, Kloppenburg P and Bruning JC. The fat mass and obesity as-sociated gene (Fto) regulates activity of the dopaminergic midbrain circuitry. Nat Neurosci 2013; 16: 1042-1048.
[29] Brunkwall L, Ericson U, Hellstrand S, Gullberg B, Orho-Melander M and Sonestedt E. Genetic variation in the fat mass and obesity-associat-ed gene (FTO) in association with food prefer-ences in healthy adults. Food Nutr Res 2013; 57.
[30] Watanabe SY, Iga J, Numata S, Nakataki M, Ta-nahashi T, Itakura M and Ohmori T. Association Study of Fat-mass and Obesity-associated Gene and Body Mass Index in Japanese Pa-tients with Schizophrenia and Healthy Sub-jects. Clin Psychopharmacol Neurosci 2012; 10: 185-189.
[31] Kapoor S. Polymorphisms of the fat mass and obesity-associated gene and the increased risk of systemic carcinogenesis. Eur J Intern Med 2013; 24: e17.
[32] Hubacek JA, Adamkova V, Dlouha D, Jirsa M, Sperl J, Tonjes A, Kovacs P, Pikhart H, Peasey A and Bobak M. Fat mass and obesity-associat-ed (fto) gene and alcohol intake. Addiction 2012; 107: 1185-1186.
[33] Timpson NJ, Emmett PM, Frayling TM, Rogers I, Hattersley AT, McCarthy MI and Davey Smith G. The fat mass- and obesity-associated locus and dietary intake in children. Am J Clin Nutr 2008; 88: 971-978.
[34] Reeves HL, Zaki MY and Day CP. Hepatocellu-lar Carcinoma in Obesity, Type 2 Diabetes, and NAFLD. Dig Dis Sci 2016; 61: 1234-45. [35] Patell R, Dosi R, Joshi H, Sheth S, Shah P and
Jasdanwala S. Non-Alcoholic Fatty Liver Dis-ease (NAFLD) in Obesity. J Clin Diagn Res 2014; 8: 62-66.
[36] Angulo P. NAFLD, obesity, and bariatric sur-gery. Gastroenterology 2006; 130: 1848-1852.
[37] Aik W, Demetriades M, Hamdan MK, Bagg EA, Yeoh KK, Lejeune C, Zhang Z, McDonough MA and Schofield CJ. Structural basis for inhibition of the fat mass and obesity associated protein (FTO). J Med Chem 2013; 56: 3680-3688. [38] Caruso V, Bahari H and Morris MJ. The
benefi-cial effects of early short-term exercise in the offspring of obese mothers are accompanied by alterations in the hypothalamic gene ex-pression of appetite regulators and FTO (fat mass and obesity associated) gene. J Neuro-endocrinol 2013; 25: 742-752.
[39] Gao X, Shin YH, Li M, Wang F, Tong Q and Zhang P. The fat mass and obesity associated gene FTO functions in the brain to regulate postnatal growth in mice. PLoS One 2010; 5: e14005.