SEISMIC EVALUATION OF R.C.C FRAME
BUILDINGS WITH LINEAR AND NON – LINEAR
STATIC ANALYSIS
Prince Sharma
1, Er. Bhupinder Singh
21
Post Graduate Student,
2Assistant Professor
Department of Civil Engineering, Indo global college of engineering, Abhipur, Punjab (India)
Abstract
During the last two decades, with large influxes of population and scarcity of land in urban areas, the designers have been forced to resort to vertical growth of the building in form of storeyed buildings. A multi-storeyed, multi panelled frame is complicated statically indeterminate structure. It consists if number of beams and columns built monolithically forming a network. The floors and walls are supported on beams, which transmit the load to columns. A building frame is subjected to both vertical as well as horizontal load. The vertical load consists of the dead weight of structural components such as beams, slabs, columns etc and imposed load. The horizontal load consists of wind forces and earthquake forces. The ability of multi-storeyed building to resist wind and other lateral forces depends on the rigidity of connections between the beams and columns. if the beams, columns and diaphragm act the fully rigid system, the structures as a whole is capable of resisting the horizontal force acting on the structure.
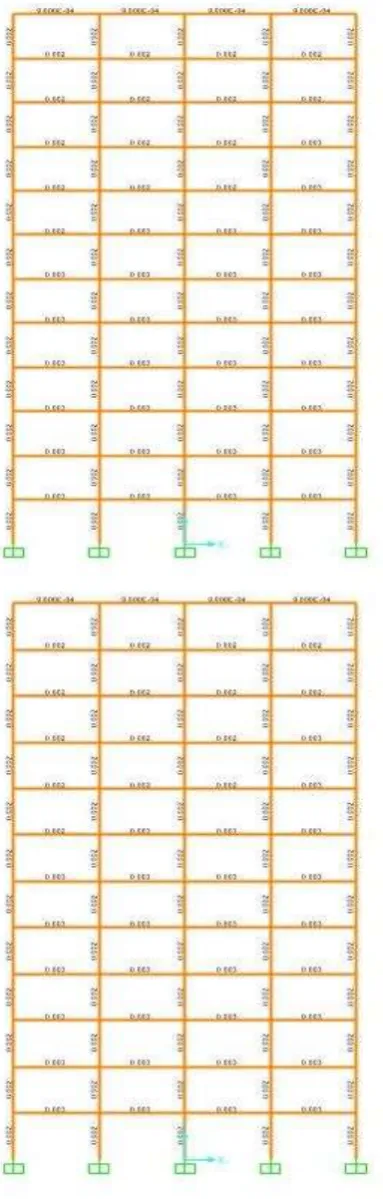
The present work includes the reinforced concrete framed buildings of 4 storey (Low- Rise),8 storey and 12 storey (High-Rise). The plan area of building is 20 x 20 m with 3.0 m as height of each typical storey. It consists of 4 bays of 5m each in X - direction and Z - direction (5 x 4 = 20 m). Hence, the building is symmetrical about both the axis. As the height of building increases the sizes of the columns are also increased proportionately. The Evaluation of above mentioned buildings by linear static analysis is done by staad pro 8vi and Sap 2000 and results are also compared for the authenticity purpose. The Evaluation of above mentioned buildings by Non linear analysis is done by Sap 2000. Results Comparison includes the comparison of Roof Displacements, Base Shear and Hinge Formation for the considered R.C.C frames designed with (a) gravity loading and (b) seismic loading using Linear analysis and Non Linear static analysis. It has been observed that, the height increase the variation of hinges
performance point increase for mid rise and high rise buildings designs
with gravity loadings and seismic loading.
Keywords: Push over Analysis, Linear analysis, Non linear Analysis, Performance of building,
Seismic Analysis method, Storey Displacement, Software analysis (Staad Pro analysis, SAP
I. INTRODUCTION
During the last 20 years ago with large influxes of population and scarcity of land in town areas the designers have been forced to resort to vertical increase the buildings in form of multi -storeyed structure. Building frames may check number of bays and may have several stories. Multi -storeyed building panels frames are complicate statically indeterminate structures. It consists the number of beams and columns casted monolithically and working a network. The floors and walls are supporting on beams which transmit the load to columns. A building frame is depended t o both vertical as well as horizontal loads. The vertical loads consists the dead w of the building components such as beams slabs columns etc and applied load.
Horizontal forces consists the earthquake forces and wind forces the ability of building to resist wind load and other lateral forces bet on the inflexibility of connections between the columns and beams. If the beams-columns and diaphragm act as the inflexible system the structure as a whole is capable of holding the horizontal force acting on the structure Earthquake forces in addition to gravity forces. Therefore, the attention of the engineering community is drawn to make the building earthquake resistant to resist the effects of ground shaking without collapsing even during strong earthquakes. Earthquakes are hazardous with low probability of occurrence but with major consequence. Majority of casualties in such condition are due to collapse the multi-storey building. It is subjected to earthquake force simultaneously undergoes lateral as well as torsional motions if their centre of rigidity and centre of mass do not coincide. So the lateral forces experienced by the various resisting elements such as frames, shear walls etc. of an unsymmetrical building would differ from those experienced by the same elements if the building had symmetric plan.
II. NEED OF SEISMIC EVALUATION
Occurrences of recent earthquakes in Nepal, India and in different parts of the world and the resulting losses human lives and highlight the structural deficiency of building to comport seismic loads. There is need for assessment of exist building for seismic resistance. A maximum damages in a building is expected during an earthquake if the seismic resistance of the building is unequal. The numerous collapses of multi-storeyed buildings in the Gujarat earthquake of 2001 have clearly shown the vulnerability of a large building stock in our country, Hence the large number of building needed seismic evaluation where in the building provided additional strength, stiffness and ductility to ensure acceptable performance in future.
2.1 Objectives
The main objectives of the study are as follows:
[1] To follow out the seismic analysis and design of multi-storeyed building frames and finding the ductility and strength parameters.
[2] To follow out linear static analysis and non linear static analysis to evaluate the above mentioned three buildings and to check the predominating affect of analysis on the multi-storeyed buildings.
III. SCOPE OF THE STUDY
[1] Only RC buildings are considered. [2] Only vertical irregularity was studied.
[3] Linear elastic analysis was done on the structures. [4] Non-Linear elastic analysis was done on the structures. [5] Column was modelled as fixed to the base.
These buildings are firstly designed for gravity loading and seismic loading as per code IS: 456 -2002 and IS: 2002 design considerations. Designed buildings are assess by Linear Static Analysis as per code IS: 1893-2002 and Non linear static analysis as per code Federal Emergency Management (FEMA 356) and Applied Technology Council (ATC 40).
The Evaluation of above mentioned buildings by linear static analysis is done by Staad Pro v8i and Sap 2000 12 version and there results are also compared for the authenticity purpose. The Evaluation of above mentioned buildings per Non linear analysis is done by SAP 2000 18.
The effect of soil structure interaction is ignored.
IV. METHODOLOGY
Review of existing literatures by different researchers. [1] Selection of types of structures.
[2] Modelling of the selected structures.
[3] Performing seismic evaluation of R.C.C frame buildings with linear static analysis by using STAAD Pro 8vi and SAP 2000. The comparison of results by two software’s is also carried out.
V. PUSHOVER ANALYSIS
Pushover analysis was performed on linear and non-linear for multi-storeyed buildings by using Staad- Pro and Sap 2000. Pushover analysis can determine the behavior of a building including the gravity load and the maximum inelastic deflection. Local Nonlinear effects are modeled and the structure is pushed until a collapse mechanism gets developed. At each step, the base shear and the roof displacement can be plotted to generate the pushover curve.
It gives an idea of the maximum base shear that the structure was capable of resisting at the time of the earthquake. For regular buildings, it can also give a rough idea about the global stiffness of the building. In soft storey the displacement will be maximum in nature as they have no sufficient strength to take loads from above storey but as the soft storey is shifted bottom to top of the structure the results may be found reverse where strength will eventually increases. To perform the pushover ATC -40 is reviewed whole through the study. All three types of hinges required for performing pushover analysis of RC structure are calculated software’s data and experience. The storey shear forces were calculated for each floor and graph was plotted for each structure.
VI. CALCULATION OF BASE SHEAR OF STOREY
The following parameters were taken: Zone Factor, Z= 0.24(Chandigarh)(IV) Importance Factor, I = 1.0 (All Building)
Response Reduction Factor = 5.0 (Damping Factor) Time Period is calculated from;
Ts = 0.075h0.75 = 0.075x 360.75 =1.10227 seconds (h = Height of Building) Hence, Sa/g = 1.234 (For Medium Soil Conditions)
Hence, Ah = (.24/2)x(1/5)x(1.234) = 0.0433 (Ah = Coefficient of base Shear) Thus Vb =0.0433x 55353.91 = 2396.82 KN
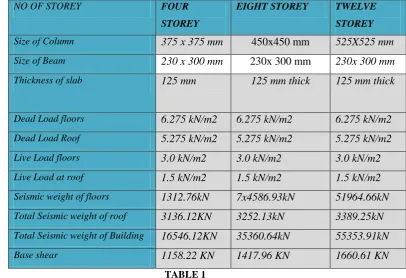
VII. ALL PROPERTIES OF ELEMENTS OF FOUR,EIGHT AND TWELVE STOREY
NO OF STOREY FOUR STOREY
EIGHT STOREY TWELVE
STOREY
Size of Column
375 x 375 mm
450x450 mm
525X525 mm
Size of Beam230 x 300 mm
230x 300 mm
230x 300 mm
Thickness of slab125 mm
125 mm thick
125 mm thick
Dead Load floors
6.275 kN/m2
6.275 kN/m2
6.275 kN/m2
Dead Load Roof5.275 kN/m2
5.275 kN/m2
5.275 kN/m2
Live Load floors
3.0 kN/m2
3.0 kN/m2
3.0 kN/m2
Live Load at roof
1.5 kN/m2
1.5 kN/m2
1.5 kN/m2
Seismic weight of floors
1312.76kN
7x4586.93kN
51964.66kN
Total Seismic weight of roof3136.12KN
3252.13kN
3389.25kN
Total Seismic weight of Building16546.12KN
35360.64kN
55353.91kN
Base shear
1158.22 KN
1417.96 KN
1660.61 KN
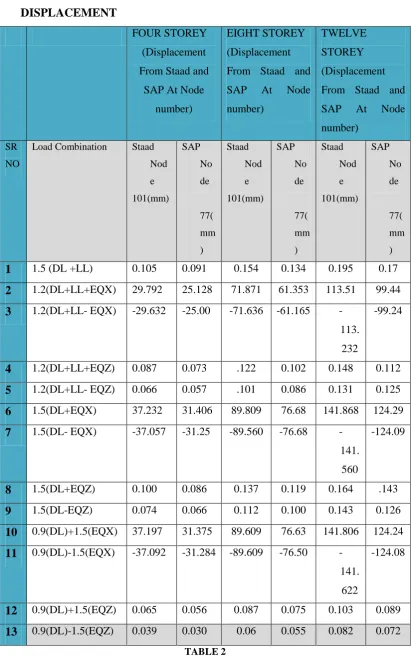
VIII. RESULTS OF LINEAR STATIC ANALYSIS IN TERM OF ROOF
DISPLACEMENT
FOUR STOREY
(Displacement
From Staad and
SAP At Node
number)
EIGHT STOREY
(Displacement
From Staad and
SAP
At
Node
number)
TWELVE
STOREY
(Displacement
From Staad and
SAP
At
Node
number)
SR NO
Load Combination Staad Nod e 101(mm) SAP No de 77( mm ) Staad Nod e 101(mm) SAP No de 77( mm ) Staad Nod e 101(mm) SAP No de 77( mm )
1
1.5 (DL +LL)
0.105
0.091
0.154
0.134
0.195
0.17
2
1.2(DL+LL+EQX)
29.792
25.128
71.871
61.353
113.51
99.44
3
1.2(DL+LL- EQX)
-29.632
-25.00
-71.636
-61.165
-113.
232
-99.24
4
1.2(DL+LL+EQZ)
0.087
0.073
.122
0.102
0.148
0.112
5
1.2(DL+LL- EQZ)
0.066
0.057
.101
0.086
0.131
0.125
6
1.5(DL+EQX)
37.232
31.406
89.809
76.68
141.868
124.29
7
1.5(DL- EQX)
-37.057
-31.25
-89.560
-76.68
-141.
560
-124.09
8
1.5(DL+EQZ)
0.100
0.086
0.137
0.119
0.164
.143
9
1.5(DL-EQZ)
0.074
0.066
0.112
0.100
0.143
0.126
10
0.9(DL)+1.5(EQX)
37.197
31.375
89.609
76.63
141.806
124.24
11
0.9(DL)-1.5(EQX)
-37.092
-31.284
-89.609
-76.50
-141.
622
-124.08
12
0.9(DL)+1.5(EQZ)
0.065
0.056
0.087
0.075
0.103
0.089
13
0.9(DL)-1.5(EQZ)
0.039
0.030
0.06
0.055
0.082
0.072
IX. LATERAL LOAD PATTERN FOR PUSHOVER
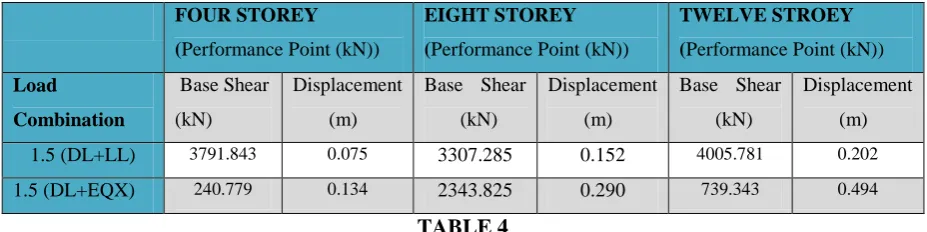
X. RESULTS OF NON-LINEAR ANALYSIS IN TERMS OF BASE SHEAR & ROOF
DISPLACEMENT AT PERFORMANCE POINT
Results of Non-Linear Static Analysis all Storey’s.
FOUR STOREY (Performance Point (kN))
EIGHT STOREY (Performance Point (kN))
TWELVE STROEY (Performance Point (kN))
Load
Combination
Base Shear (kN)
Displacement (m)
Base Shear (kN)
Displacement (m)
Base Shear (kN)
Displacement (m)
1.5 (DL+LL) 3791.843 0.075 3307.285 0.152 4005.781 0.202
1.5 (DL+EQX) 240.779 0.134 2343.825 0.290 739.343 0.494
TABLE 4
XI. COMPARISION OF RESULTS AND CONCLUSIONS
11.1 Comparision of Results
Comparison of results includes:
1)
Comparison of Roof Displacement at exterior nodes obtained using Linear Static and Non-Linear
static analysis of R.C.C frame buildings, designed with gravity loading.
Table 6 Comparison of Roof Displacement of R.C.C framed building, designed with Gravity loading.
STOREYS TYPES
LINEAR STATIC ANALYSIS
DISPLACEMENT (M)
NON-LINEAR
STATIC ANALYSIS DISPLACEMENT
4 0.000091 0.036
8 0.00034 0.152
12 0.17 0.202
2)
Comparison of Roof Displacement at exterior nodes obtained using linear static and non-Linear
static analysis of R.C.C framed buildings, designed with seismic loading.
Table 7 Comparison of Roof Displacement of R.C.C framed building, designed with Seismic loading.
STOREYS TYPES
LINEAR STATIC ANALYSIS DISPLACEMENT (M)
NON-LINEAR STATIC ANALYSIS DISPLACEMENT 4 0.031406 0.134
8 0.07668 0.290 12 0.12429 0.424
TABLE7
3) Comparison of Base shear at Performance point obtained using Non-Linear static analysis of R.C.C
framed buildings, designed with gravity loading.
Table 8 Comparison of Base shear at Performance point of R.C.C framed building, designed with Gravity loading.
STOREYS TYPES
Base shear at Performance point (KN)
4 3791.843 8 3307.285
12 4005.781
TABLE8
4) Comparison of Base shear at Performance point obtained using Non-Linear static analysis of R.C.C
framed buildings, designed with seismic loading.
Table 9 Comparison of Base shear at Performance point of R.C.C framed building, designed with Seismic loading.
STOREYS TYPES
Base shear at Performance point (KN)
4 2402.779
8 2343.825
12 739.343
5) Comparison of Hinge formation at Performance point obtained using Non-Linear static analysis of
R.C.C
frame
buildings,
designed
with
gravity
and
seismic
loading.
Fig 2.Comparison of Hinge formation at performance for Four Storey R.C.C frame designed with Gravity Loading & Seismic Loading.
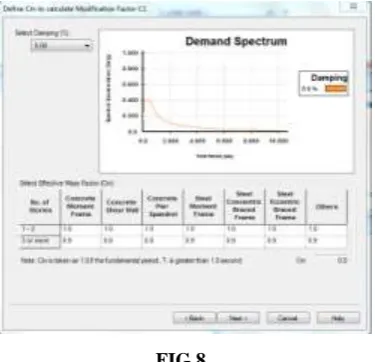
XII. GENERATION OF CAPACITY SPECTRUM CURVE FOR SEISMIC LOADING
FIG. 7Capacity Curve for Seismic Load Case of Twelve Storey
Capacity Curve For Gravity Load
FIG 8
XIII. CONCLUSIONS
Three R.C.C framed building of varying heights namely 4 storey, 8 storey and 12 storey have been analyzed and designed with and without earthquake forces. Linear static analysis has been carried out to evaluate the roof displacement with gravity loading and seismic loading. The building frames have been again analyzed by Non-linear static analysis to evaluate the strength, ductility parameters, location of hinges and roof displacements which are the compare with each other as per given above results and the following observations are summarized on the basis of above comparison which are as follows:-
2.The roof displacement of building designed with seismic loading is almost two times more than the roof displacement of building designed gravity loading, obtained by Non- Linear static analysis.
3.There is an increase in 50 % of base shear at performance point of R.C.C building frames designed with gravity loading as compare to seismic loading.
4. As the height increase the variation of Hinges formation at performance point increase for mid rise and height rise buildings, designed with gravity loading and seismic loading.
5. Hence it is concluded that for mid rise and height rise buildings a structure engineer must have to go Non- Linear analysis for seismic evaluation of buildings for achieving the objective of Performance as well as Economy.
XIV. SCOPE OF FUTURE WORK
Within the limited scope of the present work, the broad conclusions drawn from this work have been reported. However, further study can be undertaken in following areas:
In the present study, the pushover analysis has been carried out for building symmetrical in plan. This
study can further be extended for buildings which are unsymmetrical in plan and as well as elevation. In the present study, the sizes of all the columns are kept same throughout the height of building, which
can be change according to the capacity required at particular storey.
A comparative study can be done to see the effect of shear walls on pushover analysis.
REFERENCES
[1] Applied Technology Council (1996) “Seismic Evaluation and Retrofit of concrete Buildings, Report No. ATC-40, California.
[2] FEMA (1997), “FEMA 273 – NEHRP Guidelines for the Seismic Rehabilitation of Building”, Federal
Emergency Management Agency, Washington DC,USA
[3] SAP2000, “Detailed Tutorial Including Pushover analysis”, Computers and Structures Inc. [4] “Practical Three Dimensional Non-linear Static Pushover Analysis”, Structure Magazine USA.
[5] American Society of Civil Engineers (2000), “Pre-standard and Commentary for the Seismic Rehabilitation of Buildings, FEMA-356”, Federal Emergency Management Agency, Washington, DC.
[6] Farzad Naeim, Hussian Bhatia, Roy m. Lobo, (2000) “Chapter 15, Performance Based Seismic Engineering”, seismic Design Handbook.
[7] Chopra AK, (2001) “Dynamics of Structures – Theory and Application to Earthquake Engineering”.
Prentice Hall of India Pvt. Ltd.
[8] R.K. Gajjar and S.C Patodi, (2002) “Studying Damage of RCC Columns under Seismic Forces through
Virtual Reality”, M.E Thesis, the M.S University of Baroda, Baroda.
[10] Goel RK, Chopra AK, “Evaluation of modal and FEMA pushover analysis, SAC building. Earthquake Spectra 2004; 20 (1): 225-54”.
[11] M.Nuray Aydmoglu and Utka Celep (July 2005), “Improving a pushover- based seismic procedure for practice” earthquake engineering research centre middle east technical university.
[12] Barros Rul C., Almedia Ricardo. (2005) “Pushover Analysis of Asymmetric Three Dimensional Buildings
Frames”.
[13] “Effects of plastic properties in Non-Linear Analysis of Reinforced Concrete Building”.
[14] IS 456: 2000 “Indian Standard Code of Practice for Plain and Reinforced Concrete”, Fourth Revision,
Bureau of Indian Standards, New Delhi.
[15] IS Code 1893 -2002 (Part 1) “Criteria for Earthquake Resistant Design of Structures (part 1)”, General provisions and Buildings, Fifth Revision.
[16] IS 875 (Part 1) – 1987, “Code of Practice for Design Loads (Other than Earthquake) For Buildings and Structures”, Second Revision, Bureau of Indian Standards New Delhi.
[17] “Seismic evolution of existing building” Dr. durgesh C Rai Department of civil egg. IIT Kanpur.
[18] “study on empirical seismic codal guidelines for masonry buildings in kollam”, Kerala, India july
2015.“A study on simple pushover analysis of asymmetric building frames” Dr.D.N.Shinde, Maharashtra, India. (An ISO 3297: 2007 Certified Organization) Vol. 4, Issue 9, September 2015.
[19] “performance based seismic design of reinforced concrete building” Dr. Rehan A. Khan 2014.
[20] pushover analysis of r.c. frame building with shear wall prof. Mahindra wadia research scholar, 1department of civil engineering, alpine institute of technology ,Ujjain
[21] IS 875 (Part 1) – 1987, “Code of Practice for Imposed Loads (Other than Earthquake) For Buildings and Structures”, Second Revision, Bureau of Indian Standards New Delhi.
Copyright
The undersigned hereby represents and warrants that the paper is original and that he is the author of the paper and participated sufficiently in the conception and design of this paper/work and the analysis of the data (wherever applicable), as well as the writing of the manuscript except for material that is clearly identified as to its original source, with permission notices from the copyright owners where required. The undersigned represents that he has the power and authority to make and execute this assignment and take public responsibility for it.
Author
Author’s Name, Er.Prince Sharma
grayscale.