Abstract— The aim of this study was to develop a practical method for quantifying stress from heartbeat recordings. We used modified detrended analysis (mDFA) that we made recently. Using the mDFA, we analyzed electrocardiograms (EKGs) that were recorded by newly made EKG amplifier that had a short input time-constant (tau). The amplifier can avoid running off of EKG traces from the PC screen during a long recording, normally for over 30 min without missing any heartbeat. Here we show case studies that prove mDFA is practical for measuring stress of model animals and human subjects. First we found that stressed hearts exhibited a low scaling exponent (SI, the Scaling Index) in model animals. Therefore, we got an idea that mDFA was applicable to humans and we conducted tmDFA on over 300 human subjects and simultaneously interviewed whether or not the subjects would have stress. In the present paper, we describe SI values and physiological interpretations that would show how mDFA quantify stress. Subjects who showed a low SI exclusively mentioned that he/she had stress or psychological pressure in their life. We conclude that mDFA can be a practical method to quantify stress caused by autonomic nerve responses to stimuli involved in our daily life because heartbeats are window and mirror of mind.
Index Terms—DFA, heart, health, stress, quantification, interval-time-series.
I. INTRODUCTION
wo individuals are never the same in terms of molecular and cellular biology, thus supporting the concept of providing individually tailored medicine and healthcare. It might be practical that we characterize subjects’ health conditions individually one by one, as well as collecting a big health-data to conduct statistical analysis. In fact, statistical evaluation does not always work in drug development: Antidepressant medications can release only 20-40 percent depression-patients from their sickness conditions, as pointed out by Emily Anthes [1]. Even though, however, in a healthy state, it was found that our hearts behave under the same law. Namely, every healthy subjects exhibits basically Manuscript received July 7, 2015; revised July 31, 2015. This work was supported by JSPS Grants No. 23500524, and 2635050. We thank DVx Inc. Tokyo, Japan, for their support to this research since 2012 (code: 4DQ404). We also thank Symphodia Phil Co. Ltd. for their financial support in 2015.
T. Yazawa is with the Tokyo Metropolitan University, Tokyo, Japan (corresponding author phone: 81-90-9805-3592; fax: 81-46-239-2350; e-mail: yazawa-tohru@ tmu.ac.jp).
M. Wakabayashi is with DVx Inc. Tokyo, Japan (e-mail: [email protected]).
the same scaling indices (SI), in terms of the heartbeat fluctuation behavior, i.e., healthy hearts exhibit a 1/f fluctuation reported by Kobayashi and Musha in 1982 [2]. This fact raised an idea that if we can make a SI-measuring device that is a kind of heartbeat checker, the device would tell us whether his/her body system is normal or abnormal in terms of cardiovascular dynamics and physiology.
The aim of this study is to make such tool. A method, detrended fluctuation analysis (DFA), is known to distinguish between normal and abnormal hearts as shown by Peng et al. [4] and Goldberger (e.g., the website “PhysioNet,” Goldberger et al. [5]). Unfortunately, however, they have not made a tool that automatically check heartbeats. The reason for uneasiness in making a tool is simple: Researchers must draw a regression line over an unauthorized length in the DFA graph, the length of which was raging over arbitrary “heartbeat number.” Researchers arbitrary determined every time when he/she use Peng et al.’s DFA. It has been two decades since then. We finally made a method, modified DFA (mDFA) [3] that can work automatically. In order to obtain a good result, we have determined appropriate length of EKG-data, heartbeat number, and so forth [3].
Here we report that several case studies proving mDFA has potential. For example, (1) stress of a caregiver (50s in age) lower her SI, (~0.7), but her SI went up gradually toward an SI, 1.0 after her loved one passed away. Our interview proved that she was released from exhausted tough time due to caring dementia mother. She once had a notion to kill her, she said. (2) A man (40s) who experienced a significant number of extra-systolic heartbeats (PVCs) that has never seen before. His SI was previously normal (SI ≒ 1.0), but he got a responsible unsuccessful business outcome, resulting in a bad inventory with hundreds thousand US dollar, and his SI dropped to 0.87 with a lot of PVCs. (3) An academic scientist (60s) who has an intellectual ability but he is extremely shy, he said. He is always not in the mood for a conference-party after his talk, then, meeting and greeting and even smiling to unfamiliar people to whom he has never met before, where he was a guest speaker for unfamiliar audiences who try to give name-card to him. His SI dropped from 1.0 during talk to 0.7 during the party. From those several observations, we concluded that mDFA can quantify stress. We thus propose that anyone can make a wearable mobile EKG-mDFA device, although we are not having a skill to make it, solely
Quantifying Stress Using Modified DFA
(
m
DFA): A Practical Heartbeat-Interval Time
Series Analysis
Toru Yazawa and Makoto Wakabayashi
conducting invertebrate neurobiology.
II. MATERIALS AND METHOD
A. Heartbeat recording and analysis
We made a computation method mDFA) [3] as followings: (a) Recording electrocardiogram (EKG, after Willem Einthoven) at a sampling rate 1 kHz, obtaining 2,000 heartbeats without any missing heartbeat. A commercial disposable Ag/AgCl electrode for EKG monitoring, Hihon-Koden Vitrode V, V-090M3 was used. (b) To avoid miss recording, we newly made an EKG amplifier that mounted an in-put circuit with a short time-constant (tau); the ideal tau would be, τ < 0.22 s. (see also Results Case 2) (c) An appropriate box size for the mDFA was [30; 270] in beat per min (BPM), which means that mDFA computes a routine regression line from 30 BPM to 270 BPM. (see Peng [4] in detail).
This automatic computation well distinguished two different heart conditions, an isolated heart and an intact heart of lobsters [6]. We used mDFA throughout the study way over 300 people. EKGs were taken at the sitting position for about 30 min, in the afternoon, with obtaining a written certificate for the ethical control agreement from the volunteers.
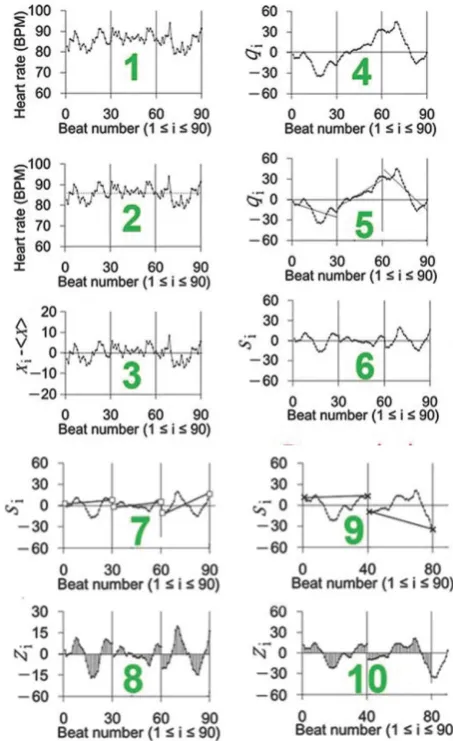
Figure 1 shows the mDFA-computation. An interval time series {Xi} was obtained (Graph 1 in Figure 1). Graph 1 only shows 90 beats. Real data involved as 2,000 beats. An average interval time of the 2,000, <X>, was obtained (Graph 2, a dotted line). A computation of Xi - <X> gave a time series that fluctuate around zero line (Graph 3). A computation of qi,
(1)
was conducted (Graph 4). This “random walk” like signal was cut into “box” (Graphs 4 and 5)., i.e., here, “box size” is 30 beat.
Within each box, a regression line was made by the least mean square method (Graph 5). In Graph 5, a linear regression line is shown. But, in the real mDFA, we use biquadratic regression line. Then, “difference” between the regression line and data were calculated (Si, Graph 6). This is “detrended” procedure that Peng et al. [5] have introduced for EKG analysis.
Peng et al. [4] measured all the difference (Graph 8), but mDFA computes “how many steps proceeded” that is, “difference” between the first value and last value of regression line of a box (Graph 7). Graphs 9 and 10 shows that box size is 40, for example. Peng et al.’s DFA and mDFA is thus different. Subsequent algorithm is the same as Peng’s (see [4]). By changing box size, we can see the scale invariant property, i.e., a self-similar process at different scale.
Figure 1. Ten key procedures explaining mDFA computation (Graphs 1-10).
III. RESULTS
A. Case 1 Model animals (lobster and crab)
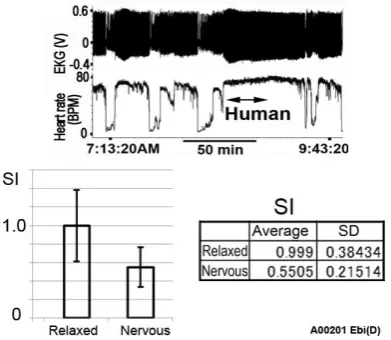
A stridulating insect such as cicada stop singing when humans approach closer to them. This is a positive evidence for that model animals can sense the risks. We discovered the same behavior in the lobsters and crabs (Figure 2): They suddenly changed heartbeat-pattern when a human approached closer to them. Intriguingly, mDFA numerically distinguished the difference: SI ≒ 1.0 for a normal heart, and SI ≒ 0.5 if humans approached closer to the lobster tank (see Yazawa, ASME Monograph 2015 [3]).
[image:2.595.319.546.52.423.2]Figure 2. Human approaching gives lobster stress. Stress response of lobster can be seen by altered pattern of beating. (arrows). Inset; the scaling indices (SI), values correspond to “relaxed” and “nervous” lobster respectively.
Figure 3. Crustacean heart response to the autonomic cardiac nerves (ANS). Simultaneous recordings of EKG and ANS of hermit crab, Dardanus crassimanus. Asterisks (*) show heartbeat. Three kinds of impulses are recorded; the largest impulses are inhibitory in function. Medium sized impulse (two triangles) and the smallest impulses are acceleratory in function, which can be identified when recoding with EKG.
B. Case 2 Telephone call from mother-in-law
A woman, in her 60s, had premature ventricular contractions (PVCs) (Figure 4) (In principle, PVCs less than ten per min is not matter. Sixty per cent people over 40 years old have PVSs.) Figure 4 shows how peaks of heartbeat were detected with newly made amplifier and with our peak-detection program. Two PVCs can be seen in Figure 4. This newly made amplifier has a time-constant (tau) of 0.1 sec. This makes EKG trace very stable and hardly fall out from the PC screen if volunteer subjects move. It is important to note that, in our method, all heartbeat peaks were always checked by eyes on the PC screen throughout the study. (see Methods)
In Figure 4, it is obvious that her heartbeats are irregular. But she was not aware of each and every PVC. We can conclude that a fluctuation pattern of during a 2000 heartbeat set was “normal” or “benign” based on the scaling characteristics, because her SI (see [30; 270] in beat per min (BPM) in Figure 5B) is 1.0 even though she had PVCs. Thus, her cardiovascular dynamics is all right based on the fluctuation analysis. Her heart is functioning properly.
We can apply an analytical method ,mDFA, to any healthcare testing, for example, the heart conditions after the valve operation and/or after the restitution from ischemic heart disease. If SI is one, the heart is all right (data not shown but we have such EKGs.
We learned about nervous control of the heart from her heart data (Figure 5). Figure 5A shows a 2000 beat time series. During these 2000 beat period, she accidentally received a phone call. The telephone call changed her PVC-pattern dramatically: She later told us that it was a kind of stressful state, because the phone call was from her mother-in-law (see a bar in Figure 5A). She was not aware of PVCs. But, psychologically, mother-in-law’s phone call made her nervous. She said that it was NOT harmful (note: she has good relationship with her) but just nervous. The phone call resulted in an increase of number of PVCs (Figure 5A, a bar period.) An increase in number of PVCs was caused by not sonly heart function but apparently autonomic nervous function that tells to the heart “I am nervous.” The heart is a window or a mirror of mind. The cardiovascular functioning was still all right because she had SI = one.
Her EKG time series documented a functional significance of her autonomic nervous function governing the heart. During this period, one can see that her heartbeat intervals were kept in a steady level, without much dynamic fluctuation. From this observation, we can conclude that her vagus nerve activity decreased during this stressful period (a bar period). This resembled lobster heart tests (Figure 2 and Figure 3).
The phone call lasted for about 500 beats that is too short for conducting mDFA. Ideally, we need a 2000 beat data for a mDFA computation.
[image:3.595.315.549.470.733.2]This subject is one of the best subject for investigating possible relationship between stress/anxiety and heartbeat based on the cardiovascular dynamics. She kindly promised to us more EKG tests next time again. She was a good but rare subject who had normal scaling exponent (SI is near one) but exhibits abnormal cardiac rhythm, the PVCs.
Figure 4. Premature ventricular contractions.
C. Case 3 Caregiver of mother
[image:4.595.335.521.259.379.2]We conducted a long term EKG-observation of a woman, 50s, who was a caregiver for her mother (90s) at her home. Figure 6 shows transition of her SI. EKGs were taken at a sitting position with interviewing in the afternoon 3 PM (Figure 6).
She was so exhausted that she could have escaped from the tough condition especially after her mother was diagnosed with dementia in 2007. At that time, she had a very low SI (SI was 0.8 with box size of [30; 270]). She remembers that she hoped to escape from her home to get asleep at a hotel nearby even just one day. She also remembers that she got a thought that she could have kill her mother and then kill herself although it never happened.
Her mother passed away in July 2008, her SI recovered (SI = 1.09). She felt sorry about her own mother’s death. But she also felt that it was thankful that her mother released her from hard work that continued for years. Figure 6 demonstrates that it can be possible to trace her psychological conditions with measuring SI. In mDFA, an appropriate box size is [30; 270] as previously explained [3].
[image:4.595.52.290.385.523.2]In early spring of 2014, she got light pain at her pancreas. She went hospital to see a doctor. Her doctor’s diagnose was “no problem” for her pancreas. But she is not hundred percent happy with the doctors answer, because she still worry a little about unpleasant sensation.
Figure 6. A long-range monitoring of stress.
D. Case 4 Caregiver of grandmother
[image:4.595.355.502.414.634.2]A 26 years old woman finished her master degree and got a position at a patent office of a university in 2006 (Figure 7). She was so kind that she allowed us to record her heartbeat and promised a long range EKG observation for our research upon a potential stress measurements project. We recorded her EKG always in the afternoon at sitting position and talking. In 2006, we found her SI was near 1.0 (Figure 7). We lost much interest about her scaling exponent because it was normal. We solely accumulated her EKG data in PC. But, she recently told us about her dramatic history that she never told us before. We were surprised when we computed her SI (Figure 7). We found that her SI traces her history.
She started her job in 2006. Her office located in Tokyo but she often went her home town where her grandmother lived. She wanted to take care of her loved one. It was 200 km away from Tokyo. She often left her job place, and thus she felt
inevitable stress in 2007. But, she could not escape from the routine owing to a reason of her family. Her grandmother passed away in 2008.
After her grandmother’ death, she decided to change her job place. She successfully moved to other university office. As can be seen in Figure 7, her SI reflect her stress history. In order to use mDFA as a tool, an appropriate box size is [30; 270]. In Figure 7, eleven box-size were measured in mDFA computations. Two of them, [30; 140] and [30; 270] are shown. An average (Ave) values out of eleven are also shown. One can recognize that Ave is close to that of box size [30; 270]. We propose that, for an automatic computing program that can incorporated into a stress quantifying device, we recommend to use box [30; 270] as a simple tool. We hope that a healthcare mDFA gadget will work at various place in the future.
Figure 7. A young woman (26 in 2006) who had stress in her job and also stress as a caregiver of her grandmother who lived at a remote place 200 km away
Figure 8. Long-term EKG checking from a worker, Mr. Ehr, age in his 40s. Heartbeat interval time series for 150 beats, and corresponding SI with box size [30; 270] are shown. Note: different date/year between A and B.
E. Case 5 Job-related stress 1
are taken in the afternoon, about 2 pm to 4 pm, at a sitting position and talking conditions.
A healthy subject who previously had a perfect scaling exponent (i.e., 0.97 in 5 March 2013, and 0.98 in 06 November 2013, see Figure 8A) exhibited a quite low scaling exponent SI = 077 in 23 May 2014 (see Figure 8B). One can see that heartbeat fluctuation in Figure 8A is more dynamic than that in Figure 8B. From Figure 8B, we can presume that inhibitory regulation (parasympathetic nerve discharge) was reduced. However, we were not able to record the nerve discharge. From the heartbeat interval time series, we were not able to determine what caused this reduction (Figure 8B) of dynamism that he used to have (Figure 8A).
Our interview revealed why he had such “stress” like response in that day (23 May 2014): He explained that he did not take sleep at all in previous night because of proofreading-job of a document, which should be finished before next morning. We coincidentally took his EKG in the afternoon of that day. We interpreted that this low SI was caused by sleep deprivation. We did not notice significant change in his behavior. From his EKG trace we hardly noticed that he spent sleep deprivation. Both interviewing and SI are important. Solely SI can tell us and quantify that his work condition in that day. Needless to say, sleep is essential for health and wellbeing. Abnormal health condition could be quantifiable and recognizable by a supervisor of the company if the company adopt mDFA, based on decrease/increase of the scaling exponent, SI. It would be possible for us to know our basal SI values by a wearable mDFA EKG device.
F. Case 6 Job-related stress 2
This section also presents a long term observation of heartbeats of a volunteer at a company downtown Tokyo with permission. A 90 min EKGs from subjects are taken in the afternoon, with a sitting position and talking about subject’s daily life.
In the year 2014, he exhibited a normal SI (i.e., near one (1), see Figure 9, January and May). In the next year, we noticed that his SI dropped significantly (23 January 2015). Furthermore we surprised that his EKGs exhibited excessive arrhythmic heartbeats, premature ventricular contractions (PVCs), which were rarely observable in 2014 (see Figure 10A). We found that his SI and PVCs were altered by some significant causes that we did not know. However, his heart rate, beat-per-min (BPM), was not significantly altered (see insertion table in Figure 10). What was happened to him?
Form the laboratory of university, we made a telephone call to him immediately after completion of this computation and asked him what was happen to him recently. He replied that he unexpectedly gave rise an unsuccessful business outcome, resulting in a bad inventory with hundreds thousand US dollar. This resulted in a catastrophe to him: The board member of the company decided that he must make a letter of apology and pay up for the bad inventory from his salary in the next 5 years. The catastrophe came to him in 22 December 2014. In January 2015, we obtained a
low SI with his EKG (see Figure 9). The number of arrhythmic heartbeats was dramatically increased as shown in Figure 10. Surprisingly, squatting exercise seemingly pushed his SI towards normal value and decrease the number of PVCs (see Figure 10). Although this effects of exercise was not proven yet, because we do not have enough example for that, a doctor already documented that exercise reduces PVCs [7]. In the year 2015. he still did not find any good solution, while he refused to make a letter of apology because he insists that the board member once agreed to the enterprise.
In 25 March 2015, we took his EKG and found that his SI was recovered to a normal SI value (near 1,0, see Figure 9). He explained to us that he promised himself that he quit from the current job, finding a new job. Thereafter, he felt a lot better, although relevant problems have not been solved in the company. However, he accustomed to his situation after two moth and he was happy with that the company will give him regular salary until June 2015. His horrible PVCs reduced dramatically then (EKG data not shown).
[image:5.595.334.530.400.471.2]In summary, a man (40s) who experienced a significant number of extra-systolic heartbeats (PVCs) that has never seen before. His SI was previously normal (SI ≒ 1.0), but he got a unsuccessful business outcome, resulting in a bad inventory with hundreds thousand US dollar, and his SI dropped to 0.86, which was accompanied by a dramatic increase of the number occurrences of PVCs.
Figure 9. Job-related stress of Mr. S. age in his 40s.
[image:5.595.314.550.418.668.2]G. Case7 Job-related stress 3
There was an academic scientist (male, 60s) who has an intellectual ability presenting lecture but he is extremely shy: He would rather stay in his shell. Recently, he made a lecture successfully but he was not in the mood for a conference-party AFTER his talk. But he must attend the party because he was “the guest speaker of the day.” We recorded his EKG (Figure 11).
He presented his recent findings to the audiences who try to give name-card to him at the party because it was the first time for him to meet them (business people). To make things worse, he was obligated to express his gratitude because he was invited to the happily-organized meeting. In the party, he expressed compliments and greeting and even with full-smiling to unfamiliar people, one by one, to whom he has never met before. His SI was normal (around 1.0) during talking. But his SI dropped from 1.0 to 0.7 during the party (Figure 11).
Figure 11A illustrates the time-line: He entered into a lecture hall (see LH), while a chair person was speaking. The chair introduced the topics of the day, the aim of the meeting, and the special guest speaker of the day that was he. After that, he made a lecture (LC) for one hour, then, a chair and he discussed on stage (DS) in front of the audience about fifty attendees. Then a party began at a party room (PR) downstairs. After the party, he went out to drink light beer with his intimate friends who hosted the meeting (FR).
Figure 11B illustrates the period-length of EKG where mDFA was conducted individually one by one. Each EKG was composed of 2000 beat length (see, f1 in Figure 11B in LH period). His heart rate was about 80 (Figure 11C). His SI during LH period was near one (1.0) as shown in Figure 11D and Figure 11E.
Because of a recording-device technical problem, EKG recordings were unfortunately discontinuance, which happened three time as shown by three vertical lines, 1, 2, and 3 (see Figure 11B). Due to this problem, LC period EKG was too short to conduct a 2000-beat mDFA. Therefore, mDFA-value during LC period was missing.
From g1 to g3, his SI were near one. This was a period on stage when he made a lecture and discussion with the chair (Figure 11D and Figure 11E). From g4 to g8, he was in the middle of the party (Figure 11B). Although he was smiling and greeting to people, his SI was finally dropped to 0.7 (see g8 both in Figure 11D and Figure 11E).
After the party, his SI went up to a normal value that is near one (Figure 11D and Figure 11E). This indicates that his fear/anxiety/stress was removed with spending a private time with his intimate friends who organized the meeting.
[image:6.595.335.525.51.199.2]This example indicates that mDFA has potential to quantify fear/anxiety/stress. Anyone can make a device that can automatically measure fear/anxiety/stress by mDFA technique (see [3]). Then, it can quantitatively characterize psychology of any individuals, even in lower animals, as shown especially in Figure 2 and Figure 11. A prototype device is working (Figure 12), although it is a bit early to get it commercially.
Figure 12. A newly made EKG monitoring system.
IV. DISCUSSION
A. Heartbeat recording and analysis
Using mDFA, we presented empirical evidences for that both the lobster (Figure 2) and human (Figures 11) similarly responded to environmental stimuli that can cause an “anxiety/stress/fear” response. Lobster’s “fear” response appearing on EKG has not been documented before us as far as we know. But it is well known that a cicada and/or a cricket stop singing (chirp sound) when human approach them. This “stress-responses” were characterized in this study by a decrease of the scaling exponent. Physiological interpretation for the meaning of the exponent-decrease is clear, in the crustaceans (lobster), because we electro-physiologically recorded cardio-inhibitory regulator-nerve activities (Figure 3). This cardiac-nerve recordings in crustacean model animals were not new but already documented by Field and Larimer (1975) [8] and Young (1978) [9]. Therefore, importance of inhibitory control of the heart has been known even in lower animals, the invertebrates.
We extended this invertebrate findings to humans, because a key gene (so called tinman or Nkx2), which is an important DNA making the cardiovascular system, is common throughout the “hearted” animals groups (including human). This means that our (human) system is fundamentally made up by a blueprint based on a copy of our ancestor’s system, which was a historical invention that could happen in a geologically long time ago. We conclude that a decrease of SI was accompanied by decrease or void of activities of inhibitory nerve or parasympathetic nerve (vagus nerve) .
four conditions are necessary to incorporate into the device. We have studied EKGs over 1000 invertebrate specimens and over 300 human EKGs. We conclude that EKGs can carry information about “stress/fear/anxiety.” By analyzing EKGs by mDFA, with aforementioned four conditions, we are able to inspect people and do simple healthcare: who has stress and who does not. Any organisms may exhibit “stress response” through the heart.
In the present article, we showed only a few examples. However, as well as meaningful statistics upon a large scale data, it seems NOT so silly if we use mDFA, because everybody’s system is different based on nonlinear connections with each elements, such as molecules, cells, tissues, and organs that composed of the body system. Statistics does not always work. Central limit theorem does not always work if the distribution is NOT Gaussian. We do not know what is a perfect human, and what is the type specimen of human. Everybody is different. Instead of accumulating millions of individual EKGs, we must carefully observe one by one. But we have an unifying principle. That is: healthy subjects exhibit the scaling exponent of one (1.0) (see Kobayashi and Musha [2]). Based on the principle, we can quantify and determine whether or not a subject is normal. We hope that, by strictly copying mDFA, engineers can make a device for checking if he/she has the scaling exponent near one (1.0) or not.
REFERENCES
[1] Emily Anthes, “Depression: A change of mind.” Nature, Vol. 515, (2014), pp.185-187.
[2] Kobayashi, M., and Musha, T., “1/f fluctuation of heartbeat period.” IEEE Transactios on Biomedical Engineering, Vol. 29, (1982), pp. 456-457.
[3] Yazawa, T., “Modified detrended fluctuation analysis.” Monograph series. 2015, ISBN: 978-0-7918-6038-0, ASME Press, NY.
[4] Peng, C.-K., Havlin, S., Stanley, H.E. and Goldberger, A.L., “Quantification of scaling exponents and crossover phenomena in nonstationary heartbeat time series.” Chaos 5, 82-87(1995).
[5] Goldberger et al., the website “PhysioNet,” Circulation 101(23):e215-e220.
[6] Yazawa, T. et al. 2004. “Neurodynamical control systems of the heart of Japanese spiny lobster, Panulirus japonicus.” Izvestiya VUZ.Applied Nonlinear Dynamics Vol.12, No. 1-2, pp. 114-121.
[7] John Mandrola, “Benign PVCs: A heart rhythm doctor’s approach.” http://www.drjohnm.org/general-cardiology-and-internal-medicine/ 2015 Apr 18.
[8] Field, L. H. et al. 1975. “The cardioregulatory system of crayfish: Neuroanatomy and physiology.” J. Exp. Biol. Vol. 62, pp. 519-530. [9] Young, R. E. 1978. “Correlated activities in the cardioregulator nerves