An examination of the molecular control
of feed efficiency in beef cattle
Thesis submitted to the
University of Dublin, Trinity College
For the Degree of
Doctor of Philosophy
By
Clare Mckenna, BA (Mod)
School of Biochemistry and Immunology
Trinity College Dublin
February 2018
i
Declaration
I declare that this thesis has not been submitted as an exercise for a degree at this or any other university and it is entirely my own work. I agree to deposit this thesis in the University's open access institutional repository or allow the library to do so on my behalf, subject to Irish Copyright Legislation and Trinity College Library conditions of use and acknowledgement.
ii
Summary
Global agriculture is faced with the enormous challenge of feeding a rapidly growing population while being cognizant of the environmental footprint of such endeavours. A consequence of increased meat consumption worldwide is an increase in demand for animal feed. As feed provision is the single largest cost incurred by beef farmers, cattle with improved feed efficiency are central to profitable, sustainable and efficient beef production. A major constraint to genetic progress in feed efficiency is the difficulty and enormous expense of measuring it directly. Therefore, robust cost-effective molecular-based biomarkers for feed efficiency are necessary. This multidisciplinary thesis aimed to: (i) establish and physiologically characterise two populations of cattle, genetically and phenotypically divergent for feed efficiency as measured by residual feed intake (RFI); (ii) examine the premise that efficiency of energy transduction in cattle is a function of mitochondrial abundance and mitochondrial functional efficiency; (iii) examine the expression of genes involved in fatty acid
iii
iv
Acknowledgements
I would like to thank my Teagasc supervisors. Firstly Dr. David Kenny for his continuous guidance over the last 4 years. His knowledge of all things agriculture has been indispensable during the experimentation and writing of this thesis and his support and experience have been essential in my training as a researcher. Most importantly, thanks for introducing a city girl to the world of cattle, I don’t think I will ever forget the trips to the abattoir or Athenry! Secondly,
I would like to thank Dr. Sinead Waters for her supervision and advice on the molecular aspect of this work and also thanks for being a friendly face popping in and out of the office. I would like to thank my Trinity supervisor, Dr. Richie Porter for his guidance and advice on this dissertation. Your enthusiasm for biochemistry is infectious and your ideas for cool experiments endless. To all three supervisors, your combined patience and encouragement when a breakdown was imminent never went unnoticed.
To Claire Fitzsimons and Kate Keogh, I watched you both transition from PhD students to post doc and you quickly became an inspiration to me. You both have incredible work ethic and an abundance of knowledge. I see you both as additional mentors to me and I am forever in your debt. Mary Rooney, another post doc who deserves a mention. While her incredible lab skills and help have benefited me to no end, I am also glad to say we have become great friends over the last number of years. Thanks for always making me feel welcome when I returned to Trinity, especially when prosecco was involved!
v
bioinformatic input of Dr. Paul Cormican and Dr. Gordon Blackshields, who are a credit to Grange. I would like to offer my thanks to Dr. Matt McCabe and Dr. Ciara Carberry, for tutelage and assistance with various aspects of molecular biology.
To the Teagasc Walsh Fellowship programme and the Teagasc Overseas Training programme, thank you for providing me with the most incredible opportunity to visit Dr. Walter Bottje in the University of Arkansas. To Dr. Bottje himself, thank you for all your tutelage and guidance throughout the last few years and thank you for introducing me to Kallie, Alissa and David. I will be eternally grateful.
To all my friends and fellow PhD students in Grange. Anne-Marie, Keelan, Eoin, Mick, Katie, Rachel, Tommy, Simone and John. Thank you for all the amazing memories and non-stop laughing over the last few years. It was a pleasure to share this time and experience with you all and I wish you all happiness and success going forward. To Colin, thank you for helping me with and teaching me so much about cattle. I don’t believe this thesis would have been possible without your support. Your voice of reason and amazing friendship were invaluable to me. To Emily, it is hard to put into words, the appreciation I have for you and your friendship over the last few years. From figuring out what the hell RFI is, to getting a cat together (R.I.P Chickpea), and all the rollercoaster ride in between, it is safe to say that your friendship was the highlight of working in Grange for me. To all the gang in the 6th floor reading room in Trinity - Siobhan, Fintan, Claire, Mashel, Emma, Rachel, Sinead, Ciaran, Brian and Jill - thanks for always welcoming me back to trinity with open arms. I will always have fond memories of our reading room wine nights! I wish you all the best of luck and happiness in the future.
vi
as you say yourself, “I haven’t a clue what she does – something about cows”. I look forward to our next adventure in Vancouver, and I can only hope that I can repay your kindness and patience at some point in the future. To my sister Lily, thank you for always making me laugh (and sometimes cry) and thank you for providing me with my wardrobe for the last few years.
To my parents, this achievement is as much yours as it is mine. It is hard to comprehend how lucky I feel to have your constant encouragement and wisdom. To my Mum, thank you for always doing stupid things to make me laugh but mainly, thanks for making sure I always strive to be the best version of myself. To my Dad, I am in awe of your intelligence. I don’t think there is anything you don’t know! I am forever grateful for your guidance and support - both
mentally and financially - over the last number of years. Without both of you, who never doubted me, I would not have made it to this point.
vii
Table of contents
Declaration i
Summary ii
Acknowledgements iv
Table of contents vii
List of figures xi
List of tables xiii
Abbreviations xv
Presentations, publications and awards xxi
Chapter 1. Introduction 1.1 Introduction to literature review 1 1.2 Feed efficiency 1 1.3 Feed intake and factors affecting feed intake 2 1.3.1 Distension or fill feedback and metabolic control of feed intake 3 1.3.2 Dietary factors 3 1.3.3 Hormonal control of feed intake and the central nervous system 3 1.3.4 Animal factors involved in feed intake 5 1.4 Measuring feed efficiency 6 1.4.1 Residual feed intake 8 1.4.2 Statistical components of RFI 9 1.4.3 Measuring RFI 11 1.4.3.1 Test Diets 11 1.4.3.2 Breed effects 12 1.4.3.3 Body Composition 13 1.4.4 Genetic component of RFI 13 1.4.5 Repeatability of RFI in beef cattle 14 1.5 Physiological regulation of RFI 15 1.5.1 Feed intake 17 1.5.2 Digestion and Methanogensis 17 1.5.3 Body composition 19 1.5.4 Tissue metabolism and maintenance 20
1.5.4.1 Energy consumption in muscle 22
1.5.4.2 Energy substrate Partitioning and its role in variation in feed efficiency
25
1.5.4.3 Adipose Tissue 26
1.5.4.4 Adipose tissue and its potential contribution to variation in feed efficiency
27
1.5.5 Lipid Metabolism 28
1.5.6 Mitochondria 32
1.5.6.1 Functions of mitochondria 35
1.5.6.2 Energy Metabolism 35
1.5.6.3 The electron transport chain 38
1.5.6.4 Reactive oxygen species 40
viii
1.5.6.6 Proton Leak, Uncoupling & Oxidative stress 40
1.5.6.7 Mitochondrial Biogenesis 41
1.5.7 Feed efficiency and Mitochondrial Function 41
1.5.7.1 Feed efficiency and ROS production 43
1.5.7.2 Feed efficiency and mitochondrial biochemistry 44 1.5.7.3 Feed efficiency and mitochondrial protein expression 44
1.5.8 Blood metabolites 46
1.5.9 Activity 48
1.5.10 Thermoregulation 49
1.6 Genomics 49
1.6.1 Functional Genomics 50
1.6.2 Genomic Assisted Selection for RFI 51
1.7 Objectives of this study 54
Chapter 2. Materials and methods
2.1 Animal Models 56
2.1.1 Project licences 56
2.1.2 Chapter 3-5 56
2.1.2.1 Animal management 56
2.1.2.2 Feed analysis 57
2.1.2.3 Body weight and body measurements 57
2.1.3 Chapter 6 58
2.2 Computation of traits and RFI calculation 59
2.2.1 Chapters 3-5 59
2.2.3 Chapter 6 60
2.3 Sample collection 60
2.3.1 Biopsy sample collection 60
2.3.2 Animal slaughter and tissue collection 60
2.3.3 Blood metabolites 61
2.4 Sample processing 61
2.4.1 Tissue homogenate preparation and protein determination 61
2.4.2 RNA isolation and purification 62
2.4.3 Blood metabolite analysis 62
2.5 Enzymatic assays 63
2.6 Statistical Analyses 66
2.6.1 Effect of RFI grouping on performance traits, mitochondria and blood metabolites
66 2.6.2 Effect of RFI grouping on gene expression in adipose tissue 67
2.7 Complementary DNA synthesis 67
2.7.1 cDNA synthesis for qRT-PCR 67
2.7.2 Non stranded cDNA library preparation and sequencing 68 2.7.3 Stranded cDNA library preparation and sequencing 68 2.8 Real-Time quantitative reverse transcription PCR 69
2.9 RNA-sequencing data analysis 73
ix
2.9.1.1 Chapter 5 73
2.9.1.2 Chapter 6 73
2.9.2 Expression analysis 73
2.9.2.1 Chapter 5 73
2.9.2.2 Chapter 6 74
2.9.3 Pathway analysis 76
Chapter 3. Mitochondrial abundance and function in skeletal muscle and liver from beef cattle divergent for RFI.
3.1 Introduction 78
3.2 Results 79
3.2.1 Animal Performance and RFI 79
3.2.2 Blood metabolites 81
3.2.3 Citrate Synthase Assay 83
3.2.4 Mitochondrial Electron Transport Chain Complex Activities 83 3.2.5 Combined activities of electron transport chain complexes 83
3.3 Discussion 86
Chapter 4. Residual feed intake phenotype and gender affect the expression of key genes of the lipogenesis pathway in adipose tissue of beef cattle
4.1 Introduction 92
4.2 Results 95
4.2.1 Summary of phenotypic data 95
4.2.2 Real-Time quantitative reverse transcription PCR 97
4.3 Discussion 102
Chapter 5. An examination of the transcriptional control of
energetic efficiency in skeletal muscle and hepatic tissue from beef cattle divergent for residual feed intake
5.1 Introduction 109
5.2 Results 112
5.2.1 Animal performance 112
5.2.2 RNA-seq read alignment and differential gene expression 115 5.2.3 Differentially expressed genes and pathway analysis 128
5.3 Discussion 133
Chapter 6. The effect of breed and diet on the skeletal muscle transcriptome of beef cattle divergent for residual feed intake
6.1 Introduction 141
6.2 Results 144
6.2.1 Animal Model 144
x
6.2.2.1 Input, preprocessing, read mapping and quantification 148
6.2.2.2 Expression analysis 149
6.2.2.3 Pair-wise contrast analysis 154
6.2.2.4 Differential expression analysis 162
6.2.2.5 Pathway analysis 165
6.3 Discussion 184
Chapter 7. Overall summary, discussion and conclusions
7.1 Introduction 191
7.2 A word on experimental design 194
7.3 Mitochondria 195
7.4 Lipogenesis 197
7.5 Transcriptomics 198
7.6 Biomarkers for RFI 200
7.7 Future work 201
Chapter 8. References 207
xi
List of figures
Chapter 1
Figure 1.1 An example of the regression line used to calculate RFI
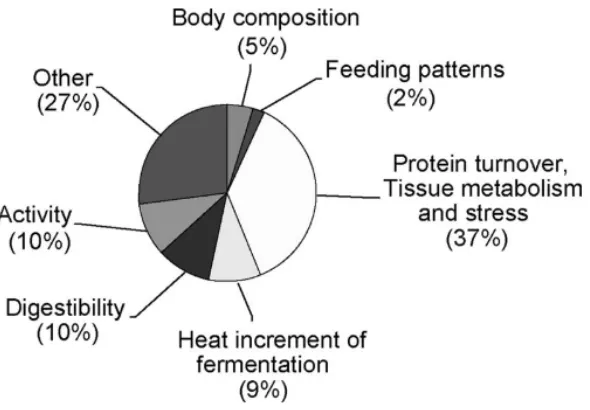
10 Figure 1.2 Contributions of various biological mechanisms to
variation in RFI
16 Figure 1.3 A brief overview of the pathways and processes that
link metabolism of muscle, liver and adipose tissue that have the potential to contribute to variation in feed efficiency
25
Figure 1.4 Mitochondrial structure 34
Figure 1.5 Illustration of the connected network of mitochondrial metabolic pathways
36 Figure 1.6 The electron transport chain embedded in the inner
mitochondrial membrane
39
Chapter 4
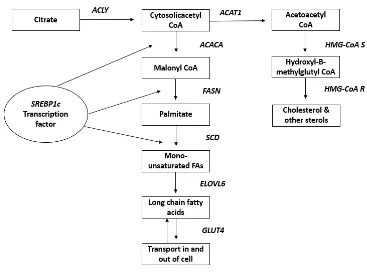
Figure 4.1 Schematic representation of lipogenesis and cholesterol synthesis pathways
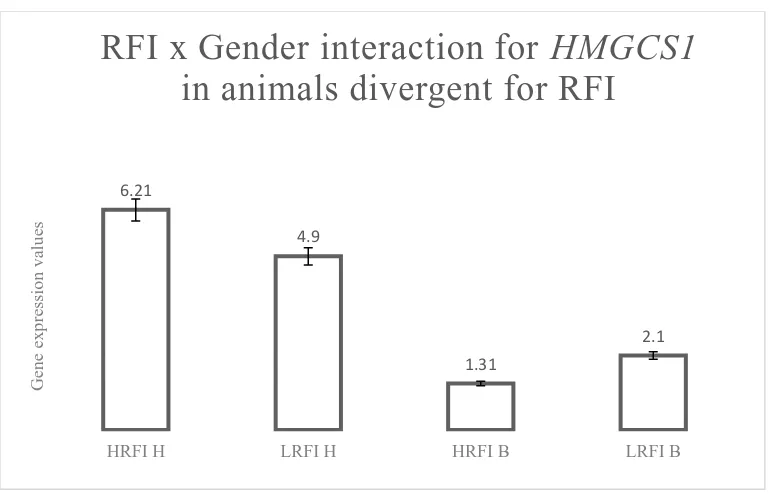
94 Figure 4.2 RFI x Gender interaction for HMGCoAS in animals
divergent for RFI
99
Chapter 5
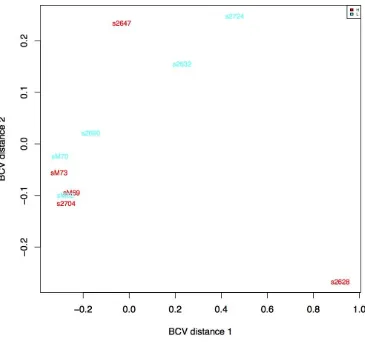
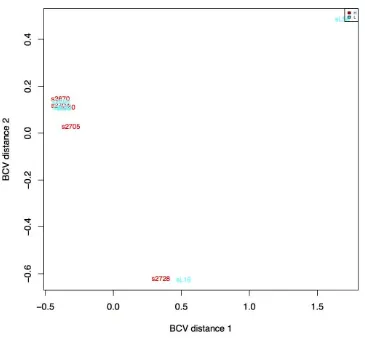
Figure 5.1 Mds plot based on normalised expression values in muscle from high and low RFI heifers
116 Figure 5.2 Mds plot based on normalised expression values in
liver from high and low RFI heifers
117 Figure 5.3 Mds plot based on normalised expression values in
muscle from high and low RFI bulls
118 Figure 5.4 Mds plot based on normalised expression values in
liver from high and low RFI bulls
119 Figure 5.5 Volcano plot of gene expression changes in muscle
tissue from high and low RFI heifers
120 Figure 5.6 Volcano plot of gene expression changes in liver tissue
from high and low RFI heifers
121 Figure 5.7 Volcano plot of gene expression changes in muscle
tissue from high and low RFI bulls
122 Figure 5.8 Volcano plot of gene expression changes in liver tissue
from high and low RFI bulls
123 Figure 5.9 Correlogram highlighting the correlation between
DEGs in muscle tissue from high and low RFI heifer
124 Figure 5.10 Correlogram highlighting the correlation between
DEGs in muscle tissue from high and low RFI bulls
xii
Chapter 6
Figure 6.1 Kernel Density Estimation of all input libraries in the study
150 Figure 6.2 Correlation Analysis of all input libraries in the study 151 Figure 6.3 Hierarchical cluster analysis of all input libraries in the
study
152 Figure 6.4 Principal components analysis of all input libraries in
the study
153 Figure 6.5 Principal components analysis of all contrasted
libraries in CH cattle in phase 1
156 Figure 6.6 Principal components analysis of all contrasted
libraries in CH cattle in phase 2
157 Figure 6.7 Principal components analysis of all contrasted
libraries in CH cattle in phase 3
158 Figure 6.8 Principal components analysis of all contrasted
libraries in HF cattle in phase 1
159 Figure 6.9 Principal components analysis of all contrasted
libraries in HF cattle in phase 2
160 Figure 6.10 Principal components analysis of all contrasted
libraries in HF cattle in phase 3
161 Figure 6.11 Volcano plot depicting an overview of differential
gene expression in HF animals divergent for RFI in phase 2 (zero grazed grass)
163
Figure 6.12
Chapter 9
Figure 9.1
Volcano plot depicting an overview of differential gene expression in CH animals divergent for RFI in phase 3
Interaction between high RFI heifers and high RFI in bulls in Complex 1 activity in muscle
164
xiii
List of tables
Chapter 1
Table 1.1 Definitions and formulas of feed efficiency measures 7
Chapter 2
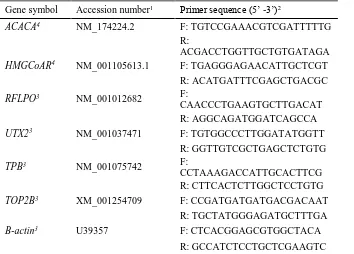
Table 2.1 Sequences of bovine oligonucleotide primers used for real-time reverse transcription PCR
71 Table 2.2 Pair wise contrasts in which differential expression
analyses were performed
75
Chapter 3
Table 3.1 Summary of phenotypic data of animals divergent for RFI
80 Table 3.2 Blood metabolites of animals divergent for RFI 82 Table 3.3 Activity of Citrate Synthase and Complexes I-IV in
muscle and liver of animals divergent for RFI
84 Table 3.4 Combined activity of Complexes I and III and II and III
in muscle and liver of animals divergent for RFI
85
Chapter 4
Table 4.1 Summary of phenotypic data of animals divergent for RFI
96 Table 4.2 Effect of RFI on the expression of lipogenic genes in
adipose tissue from cattle divergent for RFI
98 Table 4.3 Effect of RFI on the expression of lipogenic genes in
adipose tissue from bulls divergent for RFI
100 Table 4.4 Effect of RFI on the expression of lipogenic genes in
adipose tissue from heifers divergent for RFI
101
Chapter 5
Table 5.1 Summary of phenotypic data of bulls at end of feed intake trial
113 Table 5.2 Summary of phenotypic data of heifers at end of feed
intake trial
114 Table 5.3 Differentially expressed genes in the skeletal muscle of
heifers divergent for RFI
126 Table 5.4 Differentially expressed genes in the hepatic tissue of
bulls divergent for RFI
127 Table 5.5 Enriched GO functions in skeletal muscle from heifers
divergent for RFI as identified by DAVID
129 Table 5.6 Enriched GO functions in hepatic tissue from bulls
divergent for RFI as identified by DAVID
xiv
Table 5.7
Canonical pathways associated with divergence for RFI in heifer skeletal muscle
131 Table 5.8 Canonical pathways associated with divergence for RFI
in bull hepatic tissue
132
Chapter 6
Table 6.1 Feed intake, RFI and growth traits for CH and HF steers ranked low and high RFI offered a high concentrate diet at yearling stage (H1)
145
Table 6.2 Feed intake, RFI and growth traits for CH and HF steers ranked low and high RFI offered a zero grazed grass diet at growing stage (ZG)
146
Table 6.3 Feed intake, RFI and growth traits for CH and HF steers ranked low and high RFI offered a high concentrate diet at finishing stage (H2)
147
Table 6.4 Summary of pair-wise differential expression test 155 Table 6.5 Differentially expressed genes between HF animals
divergent for RFI offered a zero grazed grass diet
166 Table 6.6 Differentially expressed genes between CH animals
divergent for RFI offered a high concentrate diet in their finishing phase
174
Table 6.7 Functional analysis using both the up- and down- regulated genes from DAVID
175 Table 6.8 Top canonical pathways related to RFI in muscle tissue
from HF animals consuming Zero Grazed Grass
183
Chapter 9
Table 9.1 Slaughter information for heifers and bulls divergent for RFI
242 Table 9.2 Effects of read-filtering, adapter trimming and read
mapping
xv
Abbreviations
7SK RNA 7SK small nuclear RNA ACACA Acetyl-CoA carboxylase 1 ACAT1 Acetyl-CoA Acetyltransferase 1
ACLY ATP Citrate Lyase
ACTA2 alpha smooth muscle actin ADG average daily gain
ADP Adenosine diphosphate
AMPK 5' adenosine monophosphate-activated protein kinase ANOVA analysis of variance
ANT-1 ADP,ATP carrier protein, mitochondrial precursor
AT Adipose tissue
ATP Adenosine triphosphate BAT Brown adipose tissue BCA Bicinchoninic acid
BF Backfat
βHB beta-hydroxybutyrate
BIF Beef Improvement Federation BLAST Basic Local Alignment Search Tool BSA Bovine serum albumin
BW Bodyweight
cDNA complementary DNA
CH Charolais
CNS Central nervous system
CO2 Carbon dioxide
xvi
COX III Cytochrome c oxidase subunit 3
CRELD2 CRELD2 cysteine rich with EGF like domains 2
CS Citrate synthase
Ct cycle threshold
CI Complex 1
CII Complex 2
CII Complex 3
CIV Complex 4
CV Complex 5
CYTB Cytochrome b
DAVID Database for Annotation, Visualization and Integrated Discovery DBP D site-binding protein
DPBS Dulbecco's phosphate buffered saline DCPIP 2,6-dichlorophenolindophenol DEG differentially expressed genes
DM dry matter
DMI dry matter intake DNA Deoxyribonucleic acid
DNAJB11 DNAJ homolog subfamily B member 11
DUB Decylubiquinone
EBV Estimated breeding value
EDTA Ethylenediaminetetraacetic acid
EGTA ethylene glycol-bis(β-aminoethyl ether)-N,N,N',N'-tetraacetic acid EIF2 Eukaryotic Initiation Factor 2
ELOVL6 Elongation of very long chain fatty acids protein 6 ER Endoplasmic reticulum
xvii
FABP4 fatty acid-binding protein 4 FADH2 flavin adenine dinucleotide
FA Fatty acids
FASN Fatty acid synthase FDR False discovery rate
FE Feed efficiency
FFA Free fatty acids
GAO Gross agricultural output
GC Guanine cytosine
GH Growth hormone
GIT Gastro intestinal tract
GLUT4 insulin-regulated glucose transporter 4
GMPPB Mannose-1-phosphate guanyltransferase beta GNPNAT1 Glucosamine-Phosphate N-Acetyltransferase 1
GO Gene ontology
GSH Glutathione
GSTT1 Glutathione S-transferase theta-1
GSTTP1 Glutathione S-transferase theta pseudogene 1 GTT Glutathione S-transferase 2
GWAS Genome wide association study H1 High concentrate 1 (phase 1) H2 High concentrate 2 (phase 3)
H202 Hydrogen peroxide
HCA hierarchical cluster analysis HCL Hydrochloric acid
HF Holstein Friesan
xviii
HIF Heat increment of feeding
HMG-CoAR 3-hydroxy-3-methyl-glutaryl-coenzyme A reductase HMG-CoAS 3-hydroxy-3-methyl-glutaryl-coenzyme A synthase HSP70 70 kilodalton heat shock proteins
HSPA5 78 kDa glucose-regulated protein precursor HSPA6 Heat shock 70 kDa protein 6
HYOU1 Hypoxia up-regulated protein 1 precursor IGF-1 Insulin-like growth factor 1
ILK Integrin-linked kinase
IMM Inner mitochondrial membrane INSIG1 Insulin-induced gene 1 protein IPA Ingenuity pathway analysis KCL Potassium chloride
KCN Potassium cyanide
KDE Kernel density estimation
KEGG Kyoto Encyclopedia of Genes and Genomes KH2PO4 Potassium phosphate monobasic
KRT75 Keratin, type II cytoskeletal 75
LIMS2 LIM Zinc Finger Domain Containing 2
Lo Low RFI
MANF Mesencephalic astrocyte-derived neurotrophic factor MBW Metabolic body weight
MDS Multidimensional scaling
ME Metabolisable energy
MR Milk replacer
mRNA messenger RNA
xix
mtTFA mitochondrial transcription factor A NADH Nicotinamide adenine dinucleotide
NADPH Nicotinamide adenine dinucleotide phosphate ND5 NADH dehydrogenase, subunit 5 (complex I) ND6 NADH dehydrogenase, subunit 6 (complex I) NDF Neutral detergent fibre
nDNA nuclear DNA
NEFA Non esterified fatty acids NRF1 Nuclear respiratory factor 1 NRF2 Nuclear respiratory factor 2
O Oxygen
PCA Principal component analysis PCR Polymerase chain reaction
PGC1-a Peroxisome proliferator-activated receptor gamma coactivator 1-alpha PPARGC1a Peroxisome proliferator-activated receptor gamma
PPARs Peroxisome proliferator-activated receptors PRDX3 Thioredoxin-dependent peroxide reductase
QH2 Ubiquinol
RC Respiratory chain
RCR Respiratory control ratio RFI Residual feed intake
RFLPO 60S acidic ribosomal protein P0 RIN RNA integrity number
xx
SCAT Sub cutaneous adipose tissue SCD1 Stearoyl-CoA desaturase-1 SCFAs Short chain fatty acids
SIRT1 silent mating type information regulation 2 homolog 1 SLC16A1 solute carrier family 16 member 1
SM Simmental
SNPs single nucleotide polymorphisms SOD Superoxide dismutase
SREBPCs Sterol regulatory element-binding proteins STAR Spliced Transcripts Alignment to a Reference
TAG Triglycerides
TBP TATA-box binding protein TNB 2-Nitro-5-sulfanylbenzoic acid TOP2B DNA topoisomerase 2-beta TRIS tris(hydroxymethyl)aminomethane
UCPs Uncoupling proteins
UPC2 Uncoupling protein 2
UPC3 Uncoupling protein 1
UTX2 X-linked H3K27 demethylase
VDAC Voltage-dependent anion channel VFI Voluntary feed intake
VLDLs Very low-density lipoprotein VST variance-stabilizing transformation WAT white adipose tissue
xxi
Publications, presentations and awards
Conference proceedings
1. McKenna C. et al. (2016) Mitochondrial abundance and respiratory chain activities in tissue of cattle divergent in RFI. EAAP 2016
2. Mckenna C. et al. (2016) Relationship between mitochondria and compensatory growth in Holstein Friesian bulls. EAAP 2016
3. McKenna C. Et al. (2016) An examination of the biochemical control of feed efficiency in beef cattle. Walsh Fellowship seminar 2016
4. McKenna C. et al. (2017) Divergence in RFI effects lipogenesis in adipose tissue of beef cattle. ISAG 2017
Presentations
1. McKenna C. et al. (2016) Mitochondrial abundance and respiratory chain activities in tissue of cattle divergent in RFI. EAAP 2016
2. Mckenna C. et al. (2016) Relationship between mitochondria and compensatory growth in Holstein Friesian bulls. EAAP 2016
Posters
1. McKenna C. Et al. (2016) An examination of the biochemical control of feed efficiency in beef cattle. Walsh Fellowship Seminar 2016
Awards-Overseas Training
xxii
1
CHAPTER 1. INTRODUCTION TO LITERATURE REVIEW
The objectives of this literature review are to (i) provide a short description of feed efficiency (FE) and its importance in the beef industry; (ii) outline factors contributing to variation in feed intake; (iii) briefly review measures of FE with a specific focus on residual feed intake (RFI); (iv) outline the known physiological factors contributing to variation in RFI with a strong emphasis on mitochondrial function and dysfunction and lipogenesis; and (v) summarise the known genomic and transcriptomic information relative to RFI and give a short description of these technologies.
1.2 FEED EFFICIENCY
2
improve profits for the cattle producer while decreasing the environmental footprint of beef cattle production thus attempting to address the challenges of increasing feed costs and land pressure [4]. Increasing profits can be achieved by reducing production costs without compromising level of output [5]. Feed efficiency is the measure of how efficiently an animal converts its feed to product (carcass/meat). Feed utilisation is of great economic importance to beef producers as it is predicted that 65% -75% of total dietary energy intake of an individual animal is used exclusively for body maintenance. Animals with better FE consume less feed for the same production and are therefore more profitable and have a lower environmental footprint.
Unlike the pig and poultry industry, historically in the beef industry strong emphasis has been placed on improving output-related traits (weight and carcass) through genetic selection. Subsequently little emphasis was placed on cost related traits including feed intake, FE and or feed utilisation traits associated with output traits [6]. This is most likely due to the high cost and logistics associated with directly measuring feed intake in cattle. The challenge is to reliably and cost-effectively identifying these feed efficient animals and proliferating their genetics through animal breeding programmes. There is, thus, a critical necessity to develop robust cost-effective molecular-based biomarkers of FE.
1.3 FEED INTAKE AND FACTORS AFFECTING FEED INTAKE
3
this fact, DMI is the primary limitation on production [7]. Factors that affect feed intake should be assumed to function with multiple interactions. Feedback regulators such as distension, protein and energy should be viewed as interacting processes when considering control of voluntary feed intake (VFI) [8].
1.3.1 Distension or Fill Feedback and Metabolic Control of Feed Intake
One of the most important factors controlling VFI is that of physical feedback. Distension or “fill” feedback happens when stretch and tension receptors within the rumen wall signal the degree of “fill” to the brain [8] . As an animal feeds, the increasing volume of rumen digesta
leads to distension in the rumen wall, stimulating the distension receptors responsible for decreasing feed intake. As this is happening, rumen motility is amended increasing the flow of digesta from the rumen into the small intestine. This activity counteracts the stimulation of the distension receptors leading to increased feed intake once again [9]. This digesta has chemical properties such as protein and lipostatic feedback, and metabolites arising from this digesta such as glucose, fatty acids (FAs) and amino acids also contribute to feed intake in ruminants [9]. Physical feedback is generally responsible for the short-term regulation of VFI while metabolic regulation of VFI appears to be related to satiety over longer periods [9].
1.3.2 Dietary Factors
4
rate of digestion giving it an important role in regulating VFI [12]. Rumen distension due to fill has been associated with the NDF portion of the diet due to its low digestibility and slow rate of passage through the rumen. If feed has an increased NDF content then DMI is decreased [11] due to the low digestibility of NDF causing distension of the gastro-intestinal tract (GIT), which physically limits intake until the digesta moves further down the tract. Further research on identifying dietary factors that control VFI is required so that these constraints may be minimised.
1.3.3 Hormonal control of Feed intake and the Central Nervous System
Changes in intake are heavily influenced by alteration in physiological requirements of the animal. The homeostatic role of sensing nutrient intake and body reserves is conducted by the central nervous system (CNS). The CNS regulates short term control of energy intake and expenditure by integrating messages from the peripheral and central sensory pathways related to hunger and satiation. Long term energy balance is regulated through a complicated and integrated neuro-humoral system that dampens the impact of short-term changes in energy balance on metabolic reserves. This balance is achieved by a control system comprising metabolites and hormones that are secreted in proportion to the animal’s energy status and
metabolic reserves [13]. These metabolites and hormones will then interact with CNS targets influencing an appropriate physiological response [7].
5
should affect VFI, iv) the secretion of orexigenic signals must follow a period of fasting and secretion of anorexigenic signals must follow a period of ingesting food and v) chronic infusions should alter body fat mass and the responsiveness of peripheral tissues to energy and adrenergic stimuli [7].
Insulin (anorexigenic) and glucagon (orexigenic) work in parallel with many metabolic hormones such as leptin [14] and ghrelin [15].
1.3.4 Animal factors involved in feed intake
6
1.4 MEASURING FEED EFFICIENCY
7
Table 1.1 Definitions and formulas of feed efficiency measures.
Adapted from Arthur et al. (2008) [20]
Measure Definition Formula
Average daily gain (ADG) Weight gain per day Regression coefficient from
the regression of weight on
time (days)
Relative growth rate (RGR) Growth relative to
instantaneous size
100 X (log and wt –log start
wt)
Days on test
Feed conversion ratio (FCR) Feed intake (FI) per unit wt
gain
FI / ADG
Partial efficiency of growth
(PEG)
Efficiency of wt gain not of
maintenance food
requirements
ADG/ FI – maintenance food
(food maintenance
requirements obtained from
feeding standards.
Residual feed intake (RFI) The difference between an
animal’s actual FI and its
expected FI based on its size
and growth. Independent of
the level of production
FI –expected FI. Expected
intake obtained by the
regression of FI on average
8
Current understanding indicates that RFI is moderately heritable and when animals are fed under an ad libitum regime RFI is phenotypically independent of growth traits and level of production [21, 22]. Selection for low RFI (high FE) will result in progeny that consume less food for the same production output as progeny of high RFI (low FE) animals. This review will focus on RFI and the biological and molecular processes which may contribute to variation in RFI.
1.4.1 Residual feed intake
The concept of RFI in beef cattle was first described and used by Koch et al. in 1963 [23]. Koch examined many different measures of efficiency recognising that feed requirements in growing cattle are dependent upon body weight of the animal and suggested that feed intake could be adjusted for BW, weight gain and/or any other production trait or energy sink identified [24]. This idea highlighted the two components of feed intake (1) expected feed intake for the given level of production and (2) a residual portion. This residual portion indicates an animal that deviates from their expected intake. Animals that eat less than expected and have a negative RFI value are considered to be high feed efficient or low RFI while animals that are assigned a positive RFI value are considered to be low feed efficient and are high RFI [24, 25]. RFI can be defined as the difference between an animal’s observed feed intake and its expected feed
9
of feed utilization [20]. Previous research has revealed the presence of sufficient genetic variation for selection to increase efficiency of beef production [22, 28]. Research has suggested that RFI is moderately heritable across many breeds of beef cattle [29-31].
1.4.2 Statistical components of RFI
Calculation of a RFI value on a single animal uses a multiple linear regression of DMI on selected sources of significant energy expenditure or sinks [28, 32] as summarised below :
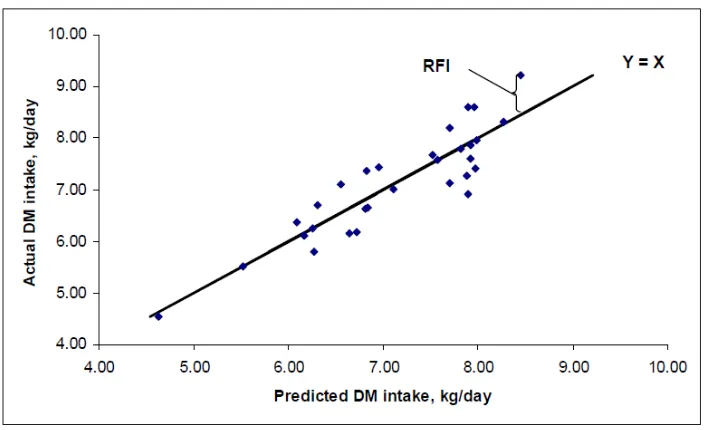
𝑦= 𝛽0 + 𝛽1 (𝐴𝐷𝐺) + 𝛽2 (𝐵𝑊) + 𝑅𝐹𝐼
Where 𝑦 is daily dry matter feed intake, 0 is the regression intercept, 𝛽1 is the partial regression
10
Figure 1.1. An example of the regression line used to calculate RFI.
11
1.4.3 Measuring RFI
Variation in feed intake in cattle cannot be ascertained from BW and level of production alone, therefore reliable measurement of feed intake is a necessary requirement in cattle evaluation systems [36]. Residual feed intake is an individual record for each animal taken over a long term feeding trial. The duration of test period necessary to calculate RFI varies between studies in the literature with some authors reporting test periods of 120 days [37] and others recommending 70 days [38] and even as low as 56 days with frequent automatic weighing [39]. A recent study concluded that intake evaluation periods can be shortened with minimal effects on the accuracy of predicting individual animal DMI [40]. The Beef Improvement Federation (BIF, 2010) suggests a 70 day test duration with live weight recorded at periodic intervals throughout the test period. The longer the test period the stronger the calculation of growth rate which appears to be the determinant of optimum test period [31, 37, 38, 41]. Animals must undergo an acclimatisation period of at least 21 days to adapt to test diet and test facilities and must be weighed on two consecutive days at the beginning and end of the test period [42]. As feed intake has been shown to be related to the age of animals when feeding tests are conducted, animals should have accurate birthdates assigned to them before entering a feed intake trial, so that age at the beginning of the test can be calculated. An animal should only undergo food intake measurement test after weaning but not younger than 240 days or older than 390 days. When measuring feed intake in a group, animals should have test start ages within a 60-day range.
1.4.3.1 Test Diets
12
basis and total diet chemical composition should be determined. Intake data should be reported on a DM basis to remove variability in moisture content across a diversity of diets. The majority of the intake evaluations performed in beef cattle have been conducted in cattle fed grain-based diets rather than those grazing forages In addition, regulation of feed intake is mainly driven by diet type, therefore there may be limitations of using feedlot intake information in development systems [40]. Durunna et al. (2011) hypothesised that diet type affects the measurement of FE when cattle are offered a growing and finishing diet in their respective growing and finishing phases [43]. Furthermore, regulation of feed intake may differ when cattle are fed different diets, and it is well known that DMI is related to energy content of feed or physical fill [12]. As DMI is an important component of FE, mechanisms of intake regulation for divergent diet types may confound the accuracy of comparing RFI in cattle when fed grain or forage [40]. A recent review highlighted a lower degree of variation in RFI is explained when animals were offered forage-based diets, and attributed this observation to the poorer intake characteristics and slower rate of passage through the rumen of a high forage diet [44]. There is a lack of knowledge comparing RFI values when cattle are fed differing diet type, however, a recent study found the correlation between forage and grain DMI to be 0.58 [40]. Furthermore, this study observed that this linear relationship of DMI closely paralleled the relationship of DMI during the growing and finishing period of grain-fed steers (0.56), suggesting that mechanisms of intake regulation on these diet types may not differ.
1.4.3.2 Breed effects
It is important to include animal effects such as breed in the calculation of phenotypic RFI. Schenkel et al. (2004) observed that when bulls were offered a high concentrate diet, Blonde d’Aquitane and Limousin breeds had the lowest RFI and Angus cattle had the greatest RFI with
13
Angus as the least efficient in a study conducted by [22]. In a study conducted by Retallick et al. (2013) it was reported that Angus steers had a less desirable RFI than Simmental steers that were tested under the same conditions [47]. It was concluded by Herd et al. (2009) that breed or genetic makeup of an animal can influence variation in RFI [48].
1.4.3.3 Body Composition
Basarab et al. (2003) suggested that differences in fat deposition can account for 5-9% of the variation in DMI [49]. Previous work suggests that fat and muscle deposition are related to feed intake [45, 49]. It is becoming a common practice for research facilities to collect body composition measurements using ultrasound scanning. Thus, many studies include an adjustment for body fat in the statistical model computing RFI, which can increase variation explained from approximately 1 [50] to up to 5 per cent [51]. If body composition is considered when calculating RFI, measurements should be taken at least once during the feed intake test period [21].
1.4.4 Genetic component of RFI
14
1.4.5 Repeatability of RFI in beef cattle
In order to validate RFI as an economically important trait worthy of inclusion in selection programmes, an animal’s status for the trait must be repeatable across various phases,
physiological states and differing diets. Furthermore, high repeatability is very important for breeding programmes, where predictions of performance can only be made early in life. Knowledge of the repeatability of RFI where animals are consuming the same diet, during different stages of an animal’s life and in different environments, is scarce [54]. Studies
examining the repeatability of RFI in beef animals offered the same diet across two periods have found that RFI was repeatable in heifers (r = 0.62; P<0.001; [26]) and steers (r = 0.40; P<0.10; [55]). Moderate rank correlations (r = 0.52; P<0.05) have been observed between RFI
in beef heifers offered the same diet across two consecutive periods [56]. However, Durunna et al. (2011) examined the repeatability of RFI between two consecutive periods for beef steers fed a grower diet, and subsequently a finisher diet, and observed that RFI was less repeatable (r = 0.33) [43]. Despite moderate repeatability, it is evident that animal re-ranking is occurring across different diets and stage of production which suggests the existence of a genotype x environment interaction in beef cattle [26, 43, 56]. Despite the studies referred to above, questions remain regarding the repeatability of RFI at different stages of an animal’s life, on
different diets, and in different environments. Positive phenotypic and genetic correlations have been reported between RFI measured in animals fed a grower diet and then subsequently measured on a finisher diet [28, 43, 57, 58]. These results indicate that RFI is moderately repeatable across different diets and stages of an animal’s life, however they also point to
15
measured on a grazed herbage regime [59]. In addition, a recent study conducted by Coyle et al. (2017), concluded that only 50% of animals retained their RFI ranking when intake was measured across different diets and stages of production [62]. These discrepancies in repeatability of RFI may be explained by maturity, dietary energy content, the physiological state of the animal and the inherent difficulty in accurately quantifying herbage intake in grazing cattle [44, 60]. Thus, it is evident that some animal re-ranking occurs, suggesting existence of a genotype x environment interaction for RFI, and this is an important area for future research.
1.5 PHYSIOLOGICAL REGULATION OF RFI
16
[image:40.595.74.369.99.304.2]
17
1.5.1 Feed intake
Variation in feed intake is related to variation in maintenance requirements of ruminants in that an increase in feed intake means an increase in the amount of energy expended to digest feed. This can be attributed to an increase in the size of digestive organs and also an increase in energy expenditure within various metabolic tissues. This is known as the heat increment of feeding (HIF) and is due to the work associated with the many physical and chemical processes involved in the mastication, digestion, absorption and metabolism of digested foods [68]. In ruminants the HIF accounts for approximately 9% of metabolizable energy (ME). As RFI is associated with differences in intake, it follows that the more efficient animals that eat less for the same level of production could be expending less energy as HIF [63].
Rate of ingestion and duration of the meal have been reported as key factors that determine the energy cost of eating in cattle [69]. It has been reported that low RFI animals settle into a regular feeding cycle faster than their high RFI counterparts who had more variable temporal patterns of feed intake early in the RFI test period [70]. RFI has been reported to be positively correlated with three feeding behaviour traits of feedlot steers, in that high RFI was associated with longer feeding time per day, more eating times per day, and faster rate of eating (g/min). In this study it was observed that feeding time and number of eating sessions also had positive genetic correlations with RFI [71]. Additionally, Fitzsimons et al. (2014) showed that low RFI animals spent less time engaged in feeding behaviour related activities [72].
1.5.2 Digestion and Methanogensis
18
19
no differences in the expression of genes involved in VFA metabolism [82], consistent with many studies that measured the physiological aspects of VFA metabolism [83, 84].
Feed consumed by ruminants primarily consists of fibrous forage which is composed of polysaccharides such as cellulose and hemicellulose [12]. Enzymes synthesised by the microbes present in the rumen break down and digest these polysaccharides converting them to short-chain fatty acids (SCFAs) that can be utilised by the animal for energy production [76, 85]. Methane is a by-product of this process. These SCFAs are absorbed through the rumen wall and fulfil the energy needs of the animal; methane is not absorbed and is emitted to the atmosphere together with its retained energy contributing to energy lost from the feed as well as global warming [86]. There is evidence to suggest a relationship between the rumen microbiome, VFA and RFI [87, 88]. Furthermore, differences between high and low RFI animals have been reported in terms of methane production and microbial composition in the rumen [27, 86, 89, 90]. These results indicate that differences in the processes of digestion, microbial fermentation and substrate availability could provide a possible mechanism to explain variation in efficiency of feed utilization [63].
1.5.3 Body composition
20
rate of protein degradation in muscle and liver and a less efficient mechanism for protein deposition and there may be a genetic origin for this trait [79]. Many studies that did not include BF in the model used to predict RFI have shown that high RFI animals tend to be fatter while low RFI animals tend to be leaner [34, 92]. In contrast, other studies have reported no relationship [55, 93-95] However, where others have included adjustments for BF in the model, a trend for a positive relationship [34], no relationship [92], or a negative relationship [96] between RFI and measures of body fat were reported.
It appears that feed efficient animals may be leaner while growing but it has been proposed that once these animals are fully grown adults they may in fact be fatter than their less efficient counterparts. These same authors hypothesised that in young, growing heifers, those of low RFI may partition more energy into lean tissue accretion and then, later in life when they are more mature and not in growth phase, fat tissue accretion becomes prominent as there is a lower energy requirement for maintenance of this tissue relative to lean tissue [91]. Basarab et al. (2007) supported this notion when retrospective analysis on historical productivity records found that females which produced low RFI progeny had greater back fat thickness compared to those that produced high RFI progeny [97]. Despite this, other studies have found conflicting results, including Arthur et al. (2004) who found that high RFI cows had a greater rib fat thickness compared to low RFI cows at the start of the breeding phase but these differences disappeared during gestation [53].
1.5.4 Tissue metabolism and maintenance
21
proportion of total energy intake required solely for body maintenance is typically in excess of 50% in adult cattle, thus making it the single most important factor that determines metabolism efficiency [99, 100]. Given the large energetic requirement to maintain energy homeostasis, it is no surprise that a number of physiological and biochemical processes are involved, some of which are discussed below.
Maintenance of tissues and metabolic functions such as protein turnover and substrate cycling, of the GIT and liver, are responsible for substantial energy consumption [99]. From the literature, it is estimated that combined, the GIT and liver account for approximately 14% of body weight but account for up to 48% of total energy expenditure [67, 99, 101-105]. Muscle tissue accounts for 40-45% of empty body weight and approximately 21% of total body energy consumption, highlighting the disproportionate energy expenditure relative to weight [99]. Energy consumed by the GIT and liver is related to absorption and subsequent transportation of nutrients to tissues, where it is utilised for energy production but also for maintenance of tissue integrity and mass [105]. Due to the large proportion of energy expenditure in these different tissues, it follows that changes in the energy metabolism or size of these organs could have a large effect on efficiency of energy utilisation by the whole animal [101, 105] and it appears that increases or decreases in the weight of the liver and GIT are directly proportional to dietary intake [101].
22
1.5.4.1 Energy consumption in muscle
Skeletal muscle can account for up to 40-45% of the total body mass of ruminants and when considering the whole animal, can contribute 60% or more to systemic metabolism [91]. When compared with other tissues skeletal muscle is considered one of the most energy consuming tissues and in its active state it must be supplied with energy rich substrates that can accommodate these metabolic needs [91]. Energy substrates that are utilised by muscle include glucose, triacylglycerol (TAG) and blood-borne free fatty acids (FFA), fatty acids (FA) and ketone bodies [112].
Glucose, a simple sugar, has two distinct fates in muscle metabolism. It is either oxidised via glycolysis or stored as glycogen [113]. Glycolysis is a process that occurs in the cytosol of cells to generate a small amount of adenosine triphosphate (ATP) [91]. Pyruvate (a product of glycolysis) is oxidised by the citric acid cycle generating the coenzymes nicotinamide adenine dinucleotide (NADH) and ubiquinol (QH2). These coenzymes are oxidised and large amounts
of ATP are formed during oxidative phosphorylation, occurring in the inner mitochondrial membrane (IMM) [114]. Glycogen is the main storage form of glucose in resting muscle and these stores can be called upon in times of increasing energy demand, being converted into glucose-6-phosphate for entry into glycolysis. Skeletal muscle has the ability to obtain glucose in the same manner via mobilisation of liver glycogen stores [91]. In times of high energy demand, glucose transport mediated by the insulin-mediated glucose transporter 4 (GLUT4) is the rate limiting step [115, 116]. An increase in GLUT4 expression leads to a decreased rate of FFA oxidation and increased glycogen synthesis meaning that if the system is in a state of elevated glucose oxidation, it requires less FFA for the same level of demand [117].
23
carbohydrates [91]. Muscle, liver and adipose tissue (AT) store TAG as a reservoir of metabolic fuel, which can be broken down and utilised by the muscle in the form of FA [98].
Blood-borne FFA of adipose origin are the major substrate used by skeletal muscle at times of rest and during low to moderate exercise over a sustained period of time [118, 119]. As energy demand increases, FFA are mobilised from their AT into plasma, followed by an increase in muscle uptake and oxidation of FFA. Plasma FFA can account for up to 90% of the muscle’s lipid fuel requirements [112] with the rest coming from muscle FA [118, 120].
In times of severe starvation, ketone bodies are utilised as an alternative source of energy by muscle. Ketone bodies are formed from the incomplete oxidation of FAs to acetyl CoA in liver mitochondria, and skeletal muscle can then derive energy from the oxidation of ketone bodies to carbon dioxide (CO2) within muscle mitochondria [121]. In these circumstances extreme
substrate partitioning comes into play and only tissues deemed of high importance will be able to utilise energy generated from ketone bodies. While skeletal muscle can utilise ketone bodies, its energy demands may not be met in this instance [91]. Taking into account the underlying mechanisms in metabolism of muscle fibres, it is evident that variation in the utilisation of substrates by muscle could indeed contribute to variation in the whole energetic efficiency of an animal.
1.5.4.2 Energy substrate Partitioning and its role in variation in feed efficiency
24
determines which substrates will be used. The rate at which substrates will be oxidized reflects the demand of the tissue thus making this the critical step of the substrate partitioning process [91].
25
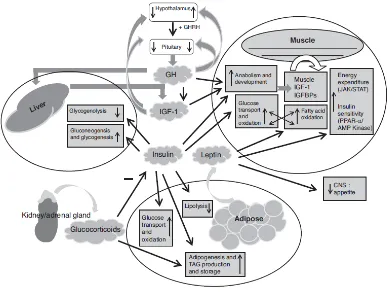
Figure 1.3. A brief overview of the pathways and processes that link metabolism of muscle,
liver and adipose tissue that have the potential to contribute to variation in feed efficiency.
26
As seen in Figure 1.3 the hormones leptin and insulin appear to have antagonistic effect on energy partitioning in muscle, with insulin blocking oxidation of FFA and leptin suppressing insulin [12127]. Leptin can directly stimulate FA oxidation in muscle by activating the 5-AMP-activated protein kinase (AMPK), which subsequently inactivates acetyl CoA carboxylase (facilitates fatty acid biogenesis) [128]. It has been proposed that leptin may stimulate thermogenesis in skeletal muscle via uncoupling proteins (UCPs) [129]. With this, leptin may facilitate a cycling between de novo lipogenesis and lipid oxidation, a process which requires glucose and thus interdependence on insulin signalling. Differences in leptin levels and subsequent differences in substrate partitioning could potentially contribute to variation in energetic (and feed) efficiency [91].
1.5.4.3 Adipose Tissue
Adipose tissue is a long-term fuel store possessing the ability to mobilise nutrients in times of deficiency[130]. There are different types of AT found in mammals; brown adipose tissue (BAT) and white adipose tissue (WAT). Different adipose depots are classed as either BAT or WAT and each one differs in its metabolic regulation [131, 132]. White adipose tissue includes visceral organ, subcutaneous, intermuscular and intramuscular fat. Visceral fat is found around the inner organs and is categorised as omental, mesenteric, retroperitoneal and pericardial. Subcutaneous fat is found abdominally and in the glutofermoral region. Brown tissue is found in the clavicle and subscapular region [131].
27
1.5.4.4 Adipose tissue and its potential contribution to variation in feed efficiency
White adipose tissue is the main reservoir for energy storage and regulates many processes related to feed intake, energy homeostasis and whole-body physiology [133, 134]. The response of AT to feed intake has been widely reported in different species, however, there remains a lack of knowledge on the relationship between adipose biological mechanisms and variations in feed utilization [135].
Leptin is a hormone found in the CNS which is produced primarily by WAT and its main role is the regulation of energy flow [136-139]. The central and peripheral actions of leptin result in a decrease in energy conservation and an increase in energy usage by partitioning substrates towards oxidation rather than storage [140-142]. Feeding and elevated blood glucose and glucocorticoid levels increase leptin gene expression; while fasting, insulin deficiency and high cyclic adenosine mono-phosphate levels will decrease leptin gene expression [142]. Deficiencies in leptin production or leptin receptors has been shown to result in animals exhibiting obesity among may other metabolic disorders [141].
It has been proposed that leptin is a regulator of appetite and energy partitioning, thereby implicating it as a regulator of FE [143]. As an animal reaches maturity, the majority of additional mammalian growth occurs in the form of AT, which in turn increases circulating leptin concentrations [144]. Studies in multiple species including swine [145], mice [146] and humans [147] have shown relationships between leptin gene polymorphisms and body composition. These studies indicate that polymorphisms in the leptin gene are a potential source for variation in RFI.
28
leptin and RFI [26, 149, 150]. Most recently it was reported that leptin mRNA levels were higher in subcutaneous AT of low RFI cattle when compared with their high RFI counterparts [151].
1.5.5 Lipid Metabolism
Extensive lipid metabolism occurs in the rumen, and this has a huge impact on the profile of FA available for absorption and tissue utilization. Lipid metabolism in the ruminant comprises a plethora of different processes that can be classified into two pathways of action. The first pathway is related to the ruminal biohyrdration of dietary FA, and their subsequent absorption and transportation to other tissues. The second pathway is related to the action of FA as metabolic modifiers, either by directly altering the synthesis and deposition of FAs in the tissues or by affecting biological processes in the animals including modulation of gene expression [152]. The starting point of lipid metabolism is the dietary intake of feedstuffs, which is followed by an extensive ruminal de-esterification and biohydrogenation of dietary lipids as well as synthesis of short-chain FA from dietary fibre compounds and fermentable carbohydrates. Fatty acids and their precursors are absorbed and further digestion and absorption of rumen-protected lipids occurs in the intestine. Upon absorption, FA and their precursors are transported to target tissues for further metabolism [152-154]. Cellular lipid metabolism, the next stage of lipid metabolism, comprises cellular uptake of FA and FA precursors via transport and hydrolysis, de novo fatty acid and triglyceride synthesis, intracellular lipid storage, lipid breakdown and fatty acid oxidation, transport and excretion processes and finally, modulation of gene expression [132, 155-158]. Detailed accounts of these processes are beyond the scope of this review and the reader is directed elsewhere for a more in depth explanation [159].
29
lipoproteins (VLDL). Large amounts of lipid can be deposited in AT because adipocytes are capable of both hypertrophy and hyperplasia and mature adipocytes contain 70-90% lipid depending on dietary energy supply [160]. Lipid metabolism refers to the synthesis and degradation of lipids, obtained from diet or synthesised by the liver, in cells. The amount of fat in AT is determined by rates of lipid synthesis (lipogenesis) and lipid degradation (lipolysis) [161]. The substrate pool of FA has three sources: cellular uptake from circulating lipoproteins (dietary derived), FA released from adipose depots and fatty acids synthesised de novo in the tissue [161].
Lipogenesis is a physiological process of endogenous FA synthesis that increases inversely to muscle tissue development; after ruminants reach genderual maturity, as muscle growth decreases and AT increases [162]. Further to this, it has been demonstrated that fat deposition is not homogeneous throughout an animal’s body [163]. Ruminants are unique as lipogenesis occurs primarily in AT and to a small extent in the liver. This is in contrast to humans and swine where the liver is the primary site [164]. Following absorption of dietary FA or de novo synthesis of FA, TAG must be incorporated into the animal’s AT [165].
30
into oxaloacetate and acetyl-CoA for subsequent lipogenesis. The metabolic processes that are involved in FA synthesis and their subsequent esterification to TAG have been reported in considerable detail [170]. Fatty acids are synthesised via an extramitochondrial system, which converts acetyl-CoA to palmitate in the cytosol. Glucose, which in ruminants, is obtained from gluconeogenesis and VFA, is utilised for the initiation of lipogenesis [170].
Pyruvate is formed from acetate (absorbed directly from the gut) via oxidation in the mitochondria and it is subsequently converted to acetyl-CoA which is the principal building block of FA. The biosynthesis of palmitate is catalysed by the enzyme complex fatty acid synthase (FASN). The system is active in liver, kidney, brain, lung, mammary gland and AT. The requirements of the system are reduced NADP, ATP, HCO3- as a source of carbon dioxide,
and manganese ions [12]. Palmitate is the final product of FA synthesis. The chain of palmitate may undergo elongation or it may be converted into unsaturated fatty acids through the action of the enzyme stearoyl-CoA desataurase (SCD1).
Many transcription factors are involved in lipid metabolism. Among these are peroxisome proliferator-activated receptors (PPARs) and Sterol regulatory element-binding proteins (SREBPs). PPARs are a family of nuclear receptors that bind to FAs and are crucial to the regulation of nutrient metabolism and energy homeostasis. There are three PPAR isoforms, α, β and γ, which differ in their target tissues, physiological properties and developmental stages
of tissues [171, 172]. PPARγ is highly expressed in adipocytes and to a lesser extent in muscle [173] and plays an important role in the control of adipogenesis, lipogenesis and insulin sensitivity [174].
31
partially to acetic acid or ketone bodies [175]. Fatty acids are oxidised in the peroxisomes and mitochondria (to acetyl-coA), contributing energy to the Krebs cycle [154].
Lipid metabolism and partitioning between different metabolic pathways in the liver is controlled by the fat: carbohydrate ratio and certain hormones, for example, insulin stimulates de novo lipogenesis and esterification of FA, but inhibits their oxidation [154].
Triglycerides and neutral fats constitute 90% of lipid fractions in adipose tissue. In the adipocyte the content of triglycerides depends on a balance between de novo synthesis of FA, FA uptake, FA esterification, lipolysis and re-esterification of FA produced during lipolysis. As already mentioned, in the ruminant, adipose tissue is responsible for approximately 90% de novo FA synthesis while liver is responsible for only 5% [130].
The importance of lipid metabolism in influencing RFI in cattle has previously been highlighted by [63]. In a recent study by Karisa et al. (2014) that analysed gene networks associated with variation in RFI, a major hub was associated with the insulin induced gene 1 (INSIG 1) [176]. This gene hub had interactions with many molecules related to energy, lipid and steroid metabolism and the authors suggest that polymorphisms present in these genes may influence body composition in beef cattle.
The same study observed that the metabolite creatinine was significantly associated with RFI [176]. Creatinine interacts closely with AMPK, an enzyme that has a vital role in cellular energy homeostasis. Stimulation of FA oxidation and ketogenesis in the liver, inhibition of cholesterol synthesis, lipogenesis, and triglyceride synthesis, inhibition of adipocyte lipolysis and lipogenesis, stimulation of skeletal muscle glucose uptake, and modulation of insulin secretion can all be attributed to the activation of AMPK [177].
32
due to variation in cellular regulation of cholesterol biosynthesis [12]. Karisa et al. (2014) utilised biological network analysis to determine pathways that may be involved in variation in FE. From this analysis it was hypothesised that FE in beef cattle is associated with cholesterol levels in tissues with high RFI steers having a higher cholesterol level that low RFI steers [176].
Altered lipid metabolism in the liver has previously been associated with RFI [178-180]. Using microarray analysis it was observed that key genes in lipid metabolism were elevated in high-RFI animals [180]. In a separate study, using RNA-seq technology, the authors hypothesised that low feed efficient animals had an increased lipogenesis in the liver [179]. This cohort of animals had greater fat deposition, elevated levels of serum cholesterol and up-regulated expression of FASN [179]. Similarly, an RNA-seq study in muscle tissue observed lipid metabolism to be altered between feed efficient phenotypes [181].
More recently a large cross-tissue RNA-Seq study aiming to identify gene networks associated with RFI, concluded that there was a deactivation of the regulatory network controlling FA metabolism in AT in the low RFI animals [182]. Similar conclusions were drawn relating to lipid metabolism and low RFI pigs [135].
1.5.6 Mitochondria
33
process can take place. Mitochondria have their own genome containing mitochondrial DNA (mtDNA), and they also divide independently of the cell in which they reside, indicating mitochondria replication is not coupled to cell division [186].
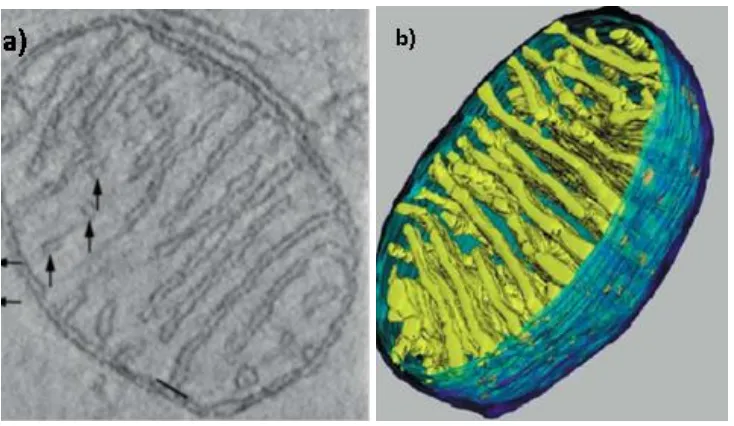
34
Figure 1.4: Mitochondrial structure.
35
1.5.6.1 Functions of mitochondria
Mitochondria are a highly dynamic organelle. Beyond a fundamental role in energy (ATP) production, they also play important roles in thermogenesis, sustaining cellular redox potential, calcium homeostasis [187], reactive oxygen species (ROS) production, fatty acid metabolism, pyrimidine biosynthesis, cell signalling [183] and cell death (apoptosis). With this in mind it is not surprising that mitochondrial dysfunction has been implicated in many rare genetic disorders, diseases of aging and defects in overall efficiency. The role of mitochondria in the above functions, while important, is beyond the scope of this review. The review will focus mainly on energy metabolism.
1.5.6.2 Energy Metabolism
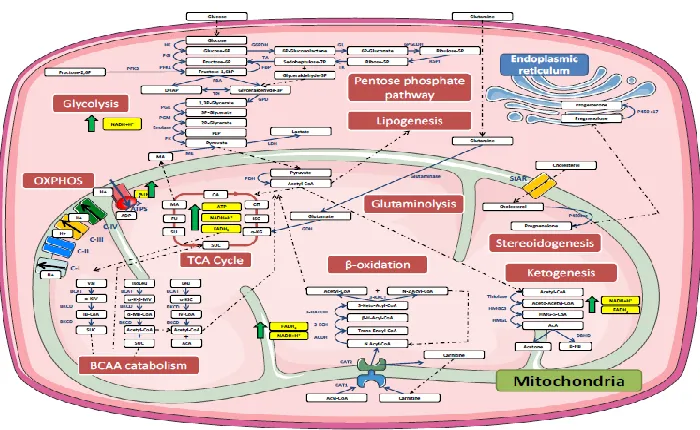
Mitochondria have always been regarded as key organelles in the regulation of metabolism. Glucose, FFAs and glutamine are major energy sources in mammalian cells [188]. Many enzymatic reactions are vital to the complete oxidation of these molecules in mitochondria. Mitochondria are the sites or at least one of the sites at which many of these interconnected processes occur, including, β-oxidation of FFAs, ketogenesis, glutaminolysis, branched amino
36
Figure 1.5. Illustration of the connected network of mitochondrial metabolic pathways.