Forest dieback due to air pollution (and other factors) is associated with worsening soil conditions caused among others by soil acidification, leaching of nutrients from the soil profile, release of toxic substances into the soil solu-tions and decreasing biological activity of soil. All these factors result in damage to forest stands. With the aim to eliminate or at least alleviate these unfavourable effects, liming of forest stands (including clearings) or their soils has been started both abroad and in this country.
Controversial liming of forest stands represents very complicated problems. Their complexity is given partic-ularly by an immense variability of the complex of fac-tors that jointly affect results of the liming itself. It is much less investigated than the problems of liming of agricultural soils that are relatively well worked out and verified with respect to the long-term controlled nutri-tion of agricultural crops.
A number of authors at many workplaces dealt with liming of forest soils and stands. Summary reports on the effect of liming on forest soil properties and resistance of forest trees to air pollution were published in this coun-try e.g. by MATERNA and SKOBLÍK (1988), PODRÁZSKÝ and PEØINA (1989), PODRÁZSKÝ (1990, 1991), KLIMO and VAVØÍÈEK (1991) etc. Some aspects of using cal-cium fertilizers, limestone and dolomite in particular, which could be identical with their use for liming of ag-ricultural soils, were mentioned by PAVLÍÈEK and MU -SIL (1988), who also reminded the fact that the effectiveness of limestone and dolomite was clearly
re-lated to their particle-size distribution. A partial experi-ment with several-year monitoring was established by the latter authors, the aim of which was to verify or to complete existing knowledge on the effect of main particle-size frac-tions (i.e. effects of particle size) of ordinarily used dolomi-tic limestone on selected properties of forest soils in the actual locality of the former Forest Enterprise Vítkov.
A preliminary report on the results of the experiment was presented (in Czech) to the editorial office of the Bulletin of the Central Supervisory and Experimental Agri-cultural Institute in Brno.
MATERIAL AND METHODS
To verify the effect of main particle-size fractions of dolomitic limestone on changes in the agrochemical properties of forest soils, a precise small-plot long-term trial was established in the area of the former Forest En-terprise Vítkov (Silesia), Forest District Skøipov (at present Municipal Forests of the town of Opava). The experiment was established at an altitude of 410 m in two neighbouring forest operational units (stand parts): 108 B7 mature spruce stand (area 7.16 ha; age
104 years; stocking 0.9; species composition: Norway spruce 100, site class 2; interspersed beech and syca-more maple; management group 571; forest type 5O1); 108 A5 clearing (area l ha; clearcut area reforested by spruce in the course of the experiment; manage-ment group 451; forest type 4B1).
JOURNAL OF FOREST SCIENCE, "&, 2002 (3): 121129
Liming of forest soils: effectiveness of particle-size fractions
I. M
USIL1, V. P
AVLÍÈEK21
Czech Agricultural University, Faculty of Forestry, Prague, Czech Republic
2
Central Supervisory and Experimental Agricultural Institute, OAPVR, Branch Office Opava,
Czech Republic
ABSTRACT: The paper studies the effect of a single use of a textural fraction of dolomitic limestone (5.1 t per ha) on soil reaction (pH/KCl and pH/H2O) and the content of exchangeable Ca and Mg (in the soil layer of 0–30 cm or in F, H and A horizons) during a 6-year experiment under a mature Norway spruce stand and a 4-year experiment on a clear-felled area. The increase in pH culminated in the 3rd or in the 3rd–6th year of the experiment. Maximum effects were achieved applying the fine fraction of a particle size ≤ 1 mm. The coarse fraction of a particle size > 1 mm showed virtually negli-gible effects. The increase in Ca and Mg content culminated in the last 6th year of the experiment. Maximum effects were achieved applying fine fractions again. The effect of the coarse fraction was also virtually negligible. After 6 years, ma-ximum increase in all values under study occurred in the upper narrow F horizon while the increase rapidly dropped down-wards.
Soil conditions of the locality (according to the syn-thetic soil map of the CR sheet B5 Opava): typical Cambisol, acid to very acid variety.
Climatic conditions of the locality (according to the map BPEJ, sheet Bílovec 81): moderately warm and humid climatic region; mean annual temperature 67°C, mean annual precipitation 650750 mm.
The trial plots were of circular shape each of 0.785 m2. In the field, the plots were stabilized by iron pins, a sheet-metal folding template being installed on them during all
activities in the plot. The templates accurately defined the trial plots.
To verify the effectiveness of particular fractions, nat-urally weathered dolomitic limestone from the west-Slo-vakian locality Malé Krteòany was used. The material is commonly used for liming of forests and agricultural soils. Limestone amounts for particular plots were calcu-lated according to the actual content of Ca and Mg in particular tested fractions and corresponded to the aver-age rate of 5.1 t dolomitic limestone per hectare (i.e. 2.6 t CaO + MgO per 1 ha).
Each of the variants was carried out in three replica-tions under a stand (108 B7) and complementarily in 1 replication in a clearing (clear-felled area 108 A5). In establishing the experiment, soil samples were taken with a boring bar from a depth of 030 cm prior to limestone application from each of the experimental plots. The sam-ples were homogenized and analysed. Raw forest litter was removed before sampling. Then respective amounts of dolomitic limestone were applied.
In the course of the experimental period, soil samples were taken from each of the plots in a similar way, always in autumn.
All samples were individually homogenized and anal-ysed to monitor changes in soil reaction (pH/KCl, pH/H2O) and the exchangeable Ca and Mg content. Val-ues of soil acidity rectified by control (see tables) were obtained by conversion using hydrogen ion concentra-tion (not only by a hydrogen exponent).
After the experiment finished, single soil samples were taken from F horizons separately from particular plots (upper part humus detritus), H (intermediate part mull) and A (lower part to a depth of 30 cm humus horizon). The content of exchangeable Ca and Mg was analysed in these samples and soil reaction was deter-mined according to the methods of ÚKZÚZ (ZBÍRAL 1995). The whole experiment lasted for 6 years (4 years only in the clearing). All chemical analyses (including those mentioned above) were carried out in a laboratory of the ÚKZÚZ Branch Office in Opava.
RESULTS AND DISCUSSION
Data determination and their analyses can be divided into several parts:
1. Changes in soil reaction values (pH/KCl, pH/H2O) in the soil layer homogenized sample of a depth to 30 cm
Chemical composition of dolomitic limestone and its particle-size fractions
Particle-size fraction Calcium% CaO Magnesium Converted to %% MgO CaCO
3 MgCO3
Original sample (Variant A) 29.6 21.2
Fraction < 1 mm (Variant B) 29.3 21.4 52.3 44.8
Fraction > 1 mm (Variant C) 30.3 20.7 54.1 43.3
Particular variants of dolomitic limestone application
Variant Applied sample of (5.1 t per 1 ha)
A original (unscreened) material
B fraction < 1mm only
C fraction > 1mm only
D no application of dolomitic limestone (control)
Particle-size distribution of the original, i.e. unscreened sample of dolomitic limestone (used in Variant A)
Particle size Proportion (%)
> 4 mm 11.2
2.84 mm coarse fraction (used in Variant C) 3.0 21.9
1.02.8 mm 7.7
0.51.0 mm fine fraction (used in Variant B) 3.3 78.1
taken under a mature Norway spruce stand are given in Table 1 (measured non-rectified values or rectified values by means of respective control values obtained in variant D). Rectified differential values of pH increase or decrease related to the respective initial value, i.e. prior to the appli-cation of dolomitic limestone, are given in Table 1a.
1.1 Table 1 shows that regardless of an experimental vari-ant the non-rectified values of exchangeable soil acidity pH/KCl culminated already at the end of the 2nd year of the experiment including the control, i.e. non-limed, variant. This fact indicates that for the purpose of comparisons it will be more suitable to use values (obtained from Variants A, B, C) in a form rectified by control values (D).
Respec-tive data are in Tables 1 or 1a. They show that the maximum increase in pH/KCl values occurred in the 3rd6th experi-mental year. Absolute ma-ximum was reached in plots limed with the fine fraction (< 1 mm, Variant B) already in the 3rd and the 4th year. However, a decrease already occurred in the 6th year of the experiment.
The values calculated for plots limed with the original unscreened sample (Variant A) considerably ap-proached Variant B (fine fraction); they culminated in the last 6th year of the experiment. On the contrary, the effects of the coarse fraction sample (> 1 mm, Variant C) were virtually negligible (pH increase ranged between 0.00 and 0.17 only, i.e. below the level of accuracy of the
Table 1. Changes in soil reaction (pH) in the 0–30 cm soil horizon under a spruce stand in the course of a 6-year experiment with the application of dolomitic limestone (5.1 t per ha in Variants A, B and C; control Variant D); Q – unrectified values; R – values rectified by an increase in the control plot (D)
Variant Samples for analyses taken from experimental plots
Characteristics (particle-size before 1 year 2 years 3 years 4 years 6 years fraction) application after application of dolomitic limestone
pH/KCl A 3.17 3.37 3.77 3.30 3.35 3.58
Q B (≤ 1 mm) 3.10 3.33 3.60 3.40 3.40 3.41
C (> 1 mm) 3.13 3.10 3.43 3.03 2.95 3.21
D (control) 3.13 3.10 3.30 3.00 3.00 3.07
pH/KCl A 3.17 3.43 3.39 3.62 3.73 3.81
R B (≤ 1 mm) 3.10 3.38 3.31 3.86 3.86 3.55
C (> 1 mm) 3.13 3.13 3.21 3.17 3.06 3.30
D (control) 3.13 3.13 3.13 3.13 3.13 3.13
pH/H2O A 3.77 4.17 4.43 4.03 4.07 3.85
Q B (≤ 1 mm) 3.60 4.13 4.17 4.20 4.20 4.20
C (> 1 mm) 3.70 3.77 4.03 3.70 3.67 4.08
D (control) 3.73 3.80 3.90 3.60 3.67 3.98
pH/H2O A 3.77 4.02 4.01 4.55 4.24 3.65
R B (≤ 1 mm) 3.60 3.99 3.89 5.72 4.45 3.84
C (> 1 mm) 3.70 3.70 3.81 3.87 3.73 3.78
D (control) 3.73 3.73 3.73 3.73 3.73 3.73
[image:3.595.58.524.603.754.2]Note: No soil samples were taken after the 5th year of the experiment
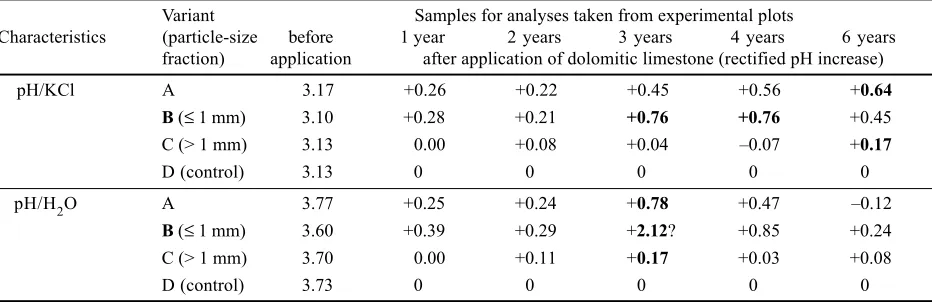
Table 1a. Increase in soil reaction (pH) in the 0–30 cm soil horizon under a spruce stand in comparison with the values before the application of dolomitic limestone (see Table 1) rectified by control (D)
Variant Samples for analyses taken from experimental plots
Characteristics (particle-size before 1 year 2 years 3 years 4 years 6 years fraction) application after application of dolomitic limestone (rectified pH increase)
pH/KCl A 3.17 +0.26 +0.22 +0.45 +0.56 +0.64
B (≤ 1 mm) 3.10 +0.28 +0.21 +0.76 +0.76 +0.45
C (> 1 mm) 3.13 0.00 +0.08 +0.04 0.07 +0.17
D (control) 3.13 0 0 0 0 0
pH/H2O A 3.77 +0.25 +0.24 +0.78 +0.47 0.12
B (≤ 1 mm) 3.60 +0.39 +0.29 +2.12? +0.85 +0.24
C (> 1 mm) 3.70 0.00 +0.11 +0.17 +0.03 +0.08
used methods, minimum value being even negative [0.07]).
1.2 A different situation is in active soil acidity pH/ H2O. Table 1 shows that non-rectified values culminated at the end of the 2nd year of the experiment in Variant A only whereas in other variants (B, C, D) culmination oc-curred at the end of the 6th year of the experiment (in Variant B, maximum value was the same from the end of the 3rd year). After rectification of the values (obtained from limed plots) by control values (Tables 1 or 1a) it is evident that according to our supposition the highest in-crease in pH/H2O (by 2.12[!?]) occurred in Variant B with the fine fraction at the end of the 3rd year.
At the same time, culmination and somewhat lower in-crease occurred in plots limed with the unscreened sam-ple (Variant A).
Virtually negligible, under the resolution level of the used methods, are increases in values from plots where only the coarse fraction was applied (Variant C pH in-crease by 0.000.17 only).
1.3 For the purpose of orientation, changes in soil re-action values (pH/KCl, pH/H2O) were also determined in a clearing covered with herb vegetation in the soil lay-er homogenized sample of a depth 30 cm see Table 4 (unrectified and rectified values) and Table 4a (increase in unrectified and rectified values related to initial val-ues).
1.3.1 Table 4 shows that irrespective of the experimental variant unrectified pH/KCl values also culminated in the clear-felled area at the end of the 2nd year of the expe-riment including the control (non-limed) variant. (A similar hardly explainable situation occurred also in plots situated under the stand.) Therefore, rectification of measured va-lues by control vava-lues was carried out in this case.
The highest increase in pH/KCl values (by 0.3, i.e. from 3.2 to 3.5) was achieved in plots treated with the screened fine fraction sample (Variant B) but also in plots limed with the original unscreened sample (Variant A from 3.3 to 3.6).
The lowest pH/KCl increase (only from 0.04 to +0.10) occurred in plots treated with the coarse fraction (Variant C).
In the course of the 4th year of the experiment, a de-crease in pH/KCl values occurred in the majority of limed variants on the clear-felled area.
1.3.2 Similarly, pH/H2O values in the clearing culmi-nated at the end of the 2nd year (or simultaneously in the following years see Table 4). Therefore, the values were rectified by control values also in this case; thus, culmi-nation occurred in the 3rd year after liming.
The highest increase in pH/H2O (by 0.60, i.e. from 3.9 to 4.5) was achieved in a plot limed with the fine fraction (Variant B) see Table 4a.
On average, the lowest pH/H2O increase (only by 0.04 to +0.20) was recorded in the coarse fraction (Variant C). Variant A treated with unscreened limestone provided virtually the same low values.
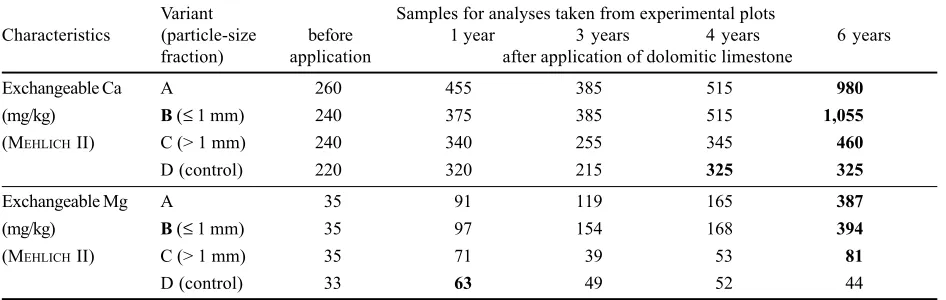
2. Changes in the content of exchangeable calcium (Ca) and magnesium (Mg) in the homogenized soil layer sample of a depth ≤ 30 cm under a spruce stand are given in Tab-le 2; in the majority of cases, the measured values are high-est in the last (i.e. in the 6th) year of the experiment with the exception of magnesium in the control variant where culmi-nation occurred one year after limestone application. There-fore the actual increase was also assessed according to differential values (i.e. from the values measured in particu-lar limed plots [A to C] rectified by respective values ob-tained from control, i.e. non-limed, plots [D]) see Table 2a. 2.1 Increase in exchangeable calcium culminated as late as in the 6th year of the experiment; the highest values were achieved in Variant B (or in Variants B and A); after the 1st year, maximum occurred in Variant A only. Values ob-tained in Variant C were markedly lower or even negligible. 2.2 Increase in exchangeable magnesium also culminat-ed in the 6th year of the experiment; the highest values were achieved exclusively in Variant B. However, the values obtained in Variant A differed much less than those in Variant C that were by an order lower (in one case even negative) and could also be evaluated as negligible.
[image:4.595.70.543.604.754.2]3. At the end of the experiment, after 6 years of the effect of dolomitic limestone in soil under the forest stand, selec-ted soil characteristics (Table 3) were studied in relation to
Table 2. Changes in the content of exchangeable calcium (Ca) and magnesium (Mg) in the 0–30 cm soil horizon under a spruce stand in the course of a 6-year experiment with the application of dolomitic limestone (5.1 t per ha in Variants A, B and C; control Variant D)
Variant Samples for analyses taken from experimental plots
Characteristics (particle-size before 1 year 3 years 4 years 6 years
fraction) application after application of dolomitic limestone
Exchangeable Ca A 260 455 385 515 980
(mg/kg) B (≤ 1 mm) 240 375 385 515 1,055
(MEHLICH II) C (> 1 mm) 240 340 255 345 460
D (control) 220 320 215 325 325
Exchangeable Mg A 35 91 119 165 387
(mg/kg) B (≤ 1 mm) 35 97 154 168 394
(MEHLICH II) C (> 1 mm) 35 71 39 53 81
3 soil horizons: F, H and A (approximately 01, 110, 10 30 cm). Differential values expressing the increase (or de-crease) in the given quantity were used again (Table 3a).
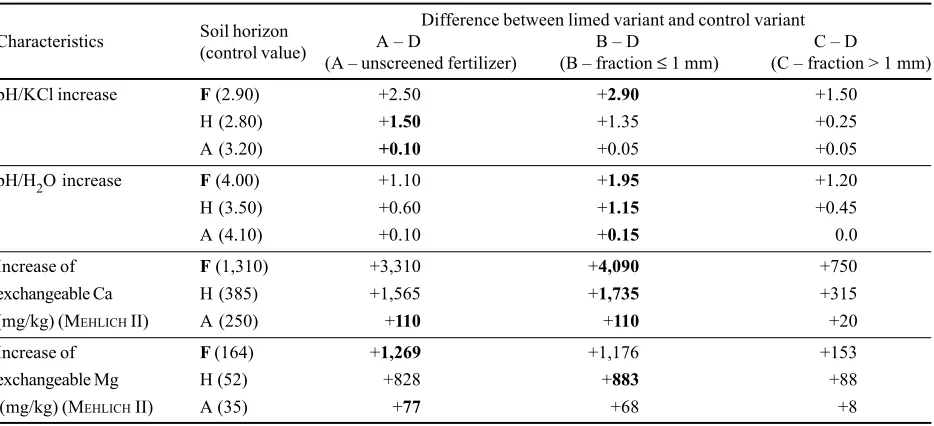
3.1 Increase in the pH/KCl value was always highest in the upper soil horizon F (pH increase by 1.52.9) with maximum values in plots limed with the fine fraction (Vari-ant B). The lowest increase occurred in the lowest A ho-rizon (pH increase by 0.050.10 only). Relatively small pH/KCl increase (pH increase by 0.251.5) was also found in the intermediate soil horizon H.
3.2 Increase in the pH/H2O value was highest also in this case in the upper soil horizon F (pH increase by 1.101.95) with maximum values in plots limed with the fine fraction (Variant B). Similarly, the smallest increase occurred in the lower A horizon (pH increase by 0.00.15 only). Relatively smaller pH/H2O increase was found in this case in the inter-mediate soil horizon H (pH increase by 0.451.15).
[image:5.595.60.525.85.349.2]3.3 Increase in exchangeable calcium was also highest in the upper soil horizon F (increase by 7504,090 mg/kg) with maximum values in plots limed with the fine fraction
Table 2a. Increase in the content of exchangeable calcium (Ca) and magnesium (Mg) from Table 2 related to values before the application of dolomitic limestone (Q) and rectified by an increase in the control plot (R)
Variant Samples for analyses taken from experimental plots
Characteristics (particle-size before 1 year 3 years 4 years 6 years
fraction) application after application of dolomitic limestone (increase)
Exchangeable Ca A 260 +195 +125 +255 +720
(mg/kg) Q B (≤ 1 mm) 240 +135 +145 +275 +815
(MEHLICH II) C (> 1 mm) 240 +100 +15 +105 +220
D (control) 220 +100 5 +105 +105
Exchangeable Ca A 260 +95 +130 +150 +615
(mg/kg) R B (≤ 1 mm) 240 +35 +150 +170 +710
(MEHLICH II) C (> 1 mm) 240 0 +20 0 +115
D (control) 220 0 0 0 0
Exchangeable Mg A 35 +56 +84 +130 +352
(mg/kg) Q B (≤ 1 mm) 35 +62 +119 +133 +359
(MEHLICH II) C (> 1 mm) 35 +36 +4 +18 +46
D (control) 33 +30 +16 +19 +11
Exchangeable Mg A 35 +26 +68 +111 +341
(mg/kg) R B (≤ 1 mm) 35 +32 +103 +114 +348
(MEHLICH II) C (> 1 mm) 35 +6 12 1 +35
D (control) 33 0 0 0 0
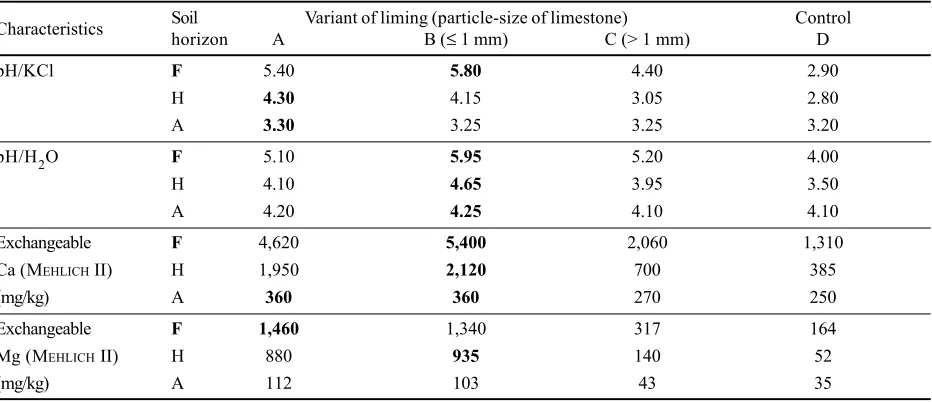
Table 3. Some characteristics of three soil horizons in plots under a spruce stand in Variants A–D after the termination of 6-year experiment with the application of dolomitic limestone
Characteristics Soilhorizon A Variant of liming (particle-size of limestone)B (≤ 1 mm) C (> 1 mm) ControlD
pH/KCl F 5.40 5.80 4.40 2.90
H 4.30 4.15 3.05 2.80
A 3.30 3.25 3.25 3.20
pH/H2O F 5.10 5.95 5.20 4.00
H 4.10 4.65 3.95 3.50
A 4.20 4.25 4.10 4.10
Exchangeable F 4,620 5,400 2,060 1,310
Ca (MEHLICH II) H 1,950 2,120 700 385
(mg/kg) A 360 360 270 250
Exchangeable F 1,460 1,340 317 164
Mg (MEHLICH II) H 880 935 140 52
[image:5.595.59.525.554.755.2](Variant B). Similarly, the lowest increase occurred in the lower A horizon (increase by 20110 mg/kg only).
Medium increase in exchangeable Ca values was also found in the intermediate H horizon (increase by 3151,735 mg/kg) with maximum values in Variant B (fine fraction).
3.4 Increase in exchangeable magnesium was highest in the upper soil horizon F (increase by 1531,269 mg/kg) with maximum values in plots limed with the unscreened
[image:6.595.73.540.83.296.2]sample (Variant A), however, it was immediately followed by plots treated with the fine fraction (Variant B). Similar-ly, the lowest increase occurred in the lower A horizon (increase by 877 mg/kg only). Medium increase in ex-changeable Mg was also found in the intermediate H ho-rizon (increase by 88883 mg/kg) with maximum values in Variant B (fine fraction).
Table 3a. Increase in some soil characteristics under a spruce stand from Table 3, situation 6 years after the application of dolomitic limestone in three soil horizons – expressed by the difference between limed variants (A, B, C) and the respective control variant (D)
Soil horizon Difference between limed variant and control variant
Characteristics (control value) A D B D C D
(A unscreened fertilizer) (B fraction ≤ 1 mm) (C fraction > 1 mm)
pH/KCl increase F (2.90) +2.50 +2.90 +1.50
H (2.80) +1.50 +1.35 +0.25
A (3.20) +0.10 +0.05 +0.05
pH/H2O increase F (4.00) +1.10 +1.95 +1.20
H (3.50) +0.60 +1.15 +0.45
A (4.10) +0.10 +0.15 0.0
Increase of F (1,310) +3,310 +4,090 +750
exchangeable Ca H (385) +1,565 +1,735 +315
(mg/kg) (MEHLICH II) A (250) +110 +110 +20
Increase of F (164) +1,269 +1,176 +153
exchangeable Mg H (52) +828 +883 +88
(mg/kg) (MEHLICH II) A (35) +77 +68 +8
Table 4. Changes in soil reaction (pH) in the 0–30 cm soil horizon in a clearing covered with herbs during a 4-year experiment with the application of dolomitic limestone (5.1 t per ha in Variants A, B and C; control Variant D); Q – unrectified values; R – values rectified by an increase in the control plot (D)
Characteristics Variant before application Samples for analyses taken from experimental plotsafter 1 year after 2 years after 3 years after 4 years
pH/KCl A 3.3 3.6 3.9 3.5 3.4
Q B (≤ 1 mm) 3.2 3.4 3.7 3.5 3.3
C (> 1 mm) 3.3 3.4 3.5 3.4 3.4
D (control) 3.2 3.2 3.4 3.2 3.2
pH/KCl A 3.3 3.60 3.45 3.50 3.40
R B (≤ 1 mm) 3.2 3.40 3.36 3.50 3.30
C (> 1 mm) 3.3 3.40 3.26 3.40 3.40
D (control) 3.2 3.20 3.20 3.20 3.20
pH/H2O A 4.0 4.3 4.4 4.2 4.1
Q B (≤ 1 mm) 3.9 4.4 4.5 4.5 4.2
C (> 1 mm) 4.0 4.2 4.3 4.2 4.2
D (control) 3.9 4.0 4.1 3.9 4.1
pH/H2O A 4.0 4.12 4.06 4.20 3.90
R B (≤ 1 mm) 3.9 4.18 4.11 4.50 3.96
C (> 1 mm) 4.0 4.05 4.02 4.20 3.96
D (control) 3.9 3.90 3.90 3.90 3.90
Note: If compared to the increase in the upper F ho-rizon, an increase in values in the intermediate H horizon (about 210 cm) reached only 1760, 3859, 4247 and 5875% in pH/KCl, pH/H2O, Ca and Mg, respectively.
4. The following problems remain more or less open: 4.1 What caused an increase in absolute pH/KCl and pH/H2O values in limed as well as control plots in the period of the 2nd or 3rd year of the experiment (calendar years 1989 or 1990). It is possible to suppose that external influences were involved mediated by the atmosphere or determined by the different course of weather in the given years (?). Laboratory and field procedures were identical and carried out by the same persons.
4.2 Another question could be evoked by the fact that in several cases when the most intensive effect of liming with the finest fractions was expected (Variant B), a some-what more marked effect was found when an unscreened sample was used for liming (Variant A) although the supe-riority was generally small and often rather symbolic. A logical explanation is, however, evident: the original sam-ple of dolomitic limestone used in Variant A contained pri-marily the fine fraction (more than 78%) and only a lower proportion of the coarse fraction (less than 22% see a table in Material and Methods). Therefore its effec-tiveness approaches the sample used in Variant B and this relatively small difference was (in some cases) obviously below the resolution level of the used methods.
SUMMARY AND CONCLUSION
Effects of the application of several fractions of dolo-mitic limestone (5.1 t per ha at the beginning of a 6-year
experiment conducted under a mature Norway spru-ce stand or in a clearing covered with herb vegetation) on selected soil properties can be summarized as fol-lows:
a) Increase in the values of exchangeable soil acidity pH/KCl culminated in the 3rd6th year of the experi-ment. Maximum effects (pH [3.10] increase by as much as 0.76) were achieved using a fine fraction for liming (particle size ≤ 1 mm). Effects of the coarse fraction (particle size > 1 mm) were negligible (pH increase [3.13] ranged between 0.07 and +0.17, i.e. virtually below the limit of accuracy of the used methods). b) Increase in the value of active soil acidity pH/H2O
culminated in the 3rd year of the experiment. Maxi-mum effects (pH increase [3.60] by 0.24 to 2.12[?]) were achieved using the fine fraction. Effects of the coarse fraction were negligible (pH increase [3.70] ranged between 0.00 and 0.17).
c) Changes in soil acidity in plots situated on a clearing covered with herb vegetation were generally somewhat smaller.
d) Increase in the content of exchangeable Ca and Mg culminated in the last 6th year of the experiment. Ma-ximum effects were achieved by liming with the fine fraction; the results obtained applying unscreened fer-tilizer were only a little lower. Minimum increases in the content of exchangeable Ca and Mg were found in plots limed with the coarse fraction.
e) Increase in the value of soil pH/KCl and pH/H2O as well as in the values of the content of exchangeable Ca and Mg six years after the application of dolomitic lime-stone was always highest in the upper horizon F
Table 4a. Increase in soil reaction (pH) in the 0–30 cm soil horizon in a clearing covered with herbs during a 4-year experiment (see Table 4) related to values obtained before the application of dolomitic limestone; Q – unrectified values; R – values rectified by control D
Characteristics Variant before application Samples for analyses taken from experimental plotsafter 1 year after 2 years after 3 years after 4 years
pH/KCl A 3.3 +0.3 +0.6 +0.2 +0.1
Q B (≤ 1 mm) 3.2 +0.2 +0.5 +0.3 +0.1
C (> 1 mm) 3.3 +0.1 +0.2 +0.1 +0.1
D (control) 3.2 0 +0.2 0 0
pH/KCl A 3.3 +0.30 +0.15 +0.20 +0.10
R B (≤ 1 mm) 3.2 +0.20 +0.16 +0.30 +0.10
C (> 1 mm) 3.3 +0.10 0.04 +0.10 +0.10
D (control) 3.2 0 0 0 0
pH/H2O A 4.0 +0.3 +0.4 +0.2 +0.1
Q B (≤ 1 mm) 3.9 +0.5 +0.6 +0.6 +0.3
C (> 1 mm) 4.0 +0.2 +0.3 +0.2 +0.2
D (control) 3.9 +0.1 +0.2 0 +0.2
pH/H2O A 4.0 +0.12 +0.06 +0.20 0.10
R B (≤ 1 mm) 3.9 +0.28 +0.21 +0.60 +0.06
C (> 1 mm) 4.0 +0.05 +0.02 +0.20 0.04
(≤ 12 cm)and smallest in the lowest horizon A (ap-proximately between 10 and 30 cm).
In conclusion, it is necessary to emphasize that the ap-plication of coarse fractions of dolomitic limestone (parti-cle size > 1 mm, application rate 5.1 t per ha) during the 6-year experimental period did not virtually affect the studied characteristics (pH, Ca, Mg). Application of fin-er fractions (< 1 mm) was relatively more effective, how-ever, their effects also decreased rapidly towards the lower-located soil horizons. While the values of ex-changeable Ca and Mg were highest in the last 6th year of measurement, pH values culminated earlier, most often about the 3rd year.
R e f e re n c e s
KLIMO E., VAVØÍÈEK J., 1991. Acidifikace a vápnìní lesních pùd v Beskydech. Lesnictví, 37: 6172.
MATERNA J., SKOBLÍK J., 1988. Vápnìní nutné opatøení pro omezení vlivu imisí na les. Lesn. Práce, 67: 387391.
NÌMEC A., 1938. Vliv vápnìní na vzrùst sazenic smrku v lesních kolkách. Lesn. Práce, 17: 209234.
PAVLÍÈEK V., MUSIL I., 1988. Nìkteré chemické a fyzikální aspekty ovlivòující úèinnost vápnìní v imisních oblastech. Lesn. Práce, 67: 397399.
PAVLÍÈEK V., MUSIL I., 2001. Vápnìní lesù vliv zrnitost-ních frakcí na nìkteré agrochemické vlastnosti pùdy. Praha, Odbor agrochemie, pùdy a výivy rostlin ÚKZÚZ 9 (in print). PODRÁZSKÝ V., 1990. Dosavadní výsledky výzkumu váp-nìní v imisních oblastech Jizerských hor, Krkono a Orlic-kých hor. Lesn. Práce, 69: 399404.
PODRÁZSKÝ V., 1991. Vliv vápnìní na vlastnosti lesních pùd a na odolnost lesních døevin vùèi pùsobení imisí. Lesnictví,
37: 161182.
PODRÁZSKÝ V., PEØINA V., 1989. Zahranièní zkuenosti s vápnìním lesních pùd. Lesn. Práce, 68: 117120. ZBÍRAL J., 1995. Analýza pùd I. Jednotné postupy. Brno,
SKZÚZ.
Received 9 November 2001
Vápnìní lesních pùd úèinnost pouitých zrnitostních frakcí
I. MUSIL1, V. PAVLÍÈEK2
1Èeská zemìdìlská univerzita, Lesnická fakulta, Praha, Èeská republika
2Ústøední kontrolní a zkuební ústav zemìdìlský, OAPVR, poboèka Opava, Èeská republika
ABSTRAKT: Pøíspìvek zkoumá vliv jednorázovì pouité zrnitostní frakce dolomitického vápence (v dávce 5,1 t/ha) na pùdní reakci (pH/KCl a pH/H2O) a na obsah výmìnného Ca a Mg (v pùdní vrstvì 030 cm, resp. v pùdních horizontech F, H, A) bìhem estiletého pokusu pod dospìlým smrkovým porostem a ètyøletého pokusu na holinì. Nárùst pH kulminoval ve tøetím, resp. ve tøetím a estém roce pokusu. Maximálního úèinku bylo dosaeno pøi aplikaci jemné frakce o velikosti zrn do 1 mm. Frakce hrubá o velikosti zrn nad 1 mm mìla úèinek prakticky zanedbatelný. Nárùst obsahu Ca a Mg kulmino-val a v posledním, estém roce pokusu. Maxima bylo dosaeno opìt pøi aplikaci jemné frakce. Vliv hrubé frakce byl rovnì prakticky zanedbatelný. Po esti letech se u vech sledovaných hodnot projevil maximální nárùst ve svrchním, úzkém hori-zontu F, zatímco smìrem dolù se nárùst velmi rychle snioval.
Klíèová slova: vápnìní lesù; dolomitický vápenec; zrnitostní frakce; acidita; iviny
Vliv pozemní aplikace nìkolika frakcí dolomitického vápence (dávka 5,1 t/ha, na poèátku estiletého pokusu pod mýtným smrkovým porostem, resp. na pasece po-rostlé bylinnou vegetací) na vybrané vlastnosti pùdní je moné shrnout takto:
a) Nárùst hodnot výmìnné pùdní acidity pH/KCl kul-minoval ve tøetím a estém roce pokusu. Maximál-ního úèinku (zvýení pH [ze 3,10] a o 0,76) bylo
dosaeno pøi vápnìní jemnou frakcí (velikost zrn do 1 mm). Vliv hrubé frakce (velikost zrn nad 1 mm) byl zanedbatelný (zvýení pH [ze 3,13] se pohybovalo mezi 0,07 a +0,17 prakticky zøejmì ji pod hranicí pøes-nosti pouitých metod).
dosaeno i zde pøi vápnìní jemnou frakcí. Vliv hrubé frakce byl více ne zanedbatelný (zvýení pH [ze 3,70] se pohybovalo v rozmezí 0,00 a 0,17).
c) Orientaèní výsledky zmìn pùdní acidity z ploch umístìných na pasece porostlé bylinnou vegetací byly celkovì ponìkud nií.
d) Nárùst obsahu výmìnného Ca i výmìnného Mg kulmi-noval a v posledním, estém roce pokusu. Maxima bylo dosaeno pøi vápnìní jemnou frakcí; jen o málo nií byly výsledky dosaené aplikací netøídìného hnojiva. Minimální pøírùsty obsahu výmìnného Ca a Mg byly u parcel vápnìných hrubou frakcí.
e) Zvýení hodnot pùdního pH/KCl i pH/H2O, jako i hodnot pùdního obsahu výmìnného Ca i Mg po
esti letech od aplikace dolomitického vápence bylo vdy nejvìtí v nejvýe poloeném horizontu F (do 1 2 cm) a nejmení v nejníe poloeném horizontu A (pøiblinì ji mezi 1030 cm).
Závìrem je nutné zdùraznit, e aplikace hrubích frakcí dolomitického vápence (se zrny o velikosti nad 1 mm v dávce 5,1 t/ha) bìhem estileté pokusné doby zkou-mané charakteristiky (pH, Ca, Mg) prakticky neovlivni-la. Aplikace jemnìjích frakcí (< 1 mm) byla relativnì úèinnìjí, avak i její pùsobení velmi rychle klesalo smìrem do níe poloených pùdních horizontù. Zatímco hodnoty výmìnného Ca a Mg dosahovaly nejvyích hodnot v posledním, tj. v estém roce mìøení, hodnoty pH kulminovaly døíve, nejèastìji kolem tøetího roku.
Corresponding author: