Topographical Proximity for Mining Network Alarm Data
Ann Devitt
Joseph Duffin
Robert Moloney
Ann.Devitt,Joseph.Duffin,[email protected]
Network Management Research Centre Ericsson R&D Ireland
Dublin 4, Ireland
ABSTRACT
Increasingly powerful fault management systems are required to ensure robustness and quality of service in today’s net-works. In this context, event correlation is of prime impor-tance to extract meaningful information from the wealth of alarm data generated by the network. Existing sequential data mining techniques address the task of identifying possi-ble correlations in sequences of alarms. The output sequence sets, however, may contain sequences which are not plausi-ble from the point of view of network topology constraints. This paper presents the Topographical Proximity (TP) ap-proach which exploits topographical information embedded in alarm data in order to address this lack of plausibility in mined sequences. An evaluation of the quality of mined sequences is presented and discussed. Results show an im-provement in overall system performance for imposing prox-imity constraints.
Categories and Subject Descriptors: H.2.8 [Database Management]: Database Applications—Data Mining
General Terms:Algorithms, Experimentation
Keywords:Topographical proximity, event correlation, min-ing sequential patterns, fault data, network configuration
1.
INTRODUCTION
Given the growing complexity of today’s networks, the task of ensuring robustness and maintaining quality of ser-vice requires increasingly powerful network management sys-tems. This steady increase in network size and complexity produces a corresponding increase in the volume of data, such as performance indicators or alarms, to be processed by management systems. In particular, the area of fault management remains a key problem for network operators, as the speed at which faults are handled has very immediate consequences for network performance. The complex,
inter-Permission to make digital or hard copies of all or part of this work for personal or classroom use is granted without fee provided that copies are not made or distributed for profit or commercial advantage and that copies bear this notice and the full citation on the first page. To copy otherwise, to republish, to post on servers or to redistribute to lists, requires prior specific permission and/or a fee.
SIGCOMM’05 Workshops, August 22–26, 2005, Philadelphia, PA, USA.
Copyright 2005 ACM 1-59593-026-4/05/0008 ...$5.00.
connected nature of the network means that a single fault may produce a cascade of alarms from affected network el-ements. Conversely, intermittent, self-clearing alarms may be raised without any attendant fault in the network. Event correlation provides a means of dealing with this large vol-ume of alarm data. Correlations define relations between alarm events that facilitate the process of alarm filtering, masking and prioritisation. While sequential data-mining techniques have evolved to identify possible useful correla-tions in alarm data, the task of identifying the subset of important and plausible correlations remains heavily depen-dent on the domain expertise of network equipment manu-facturers and operators. On the other hand, alarm data encodes substantial domain knowledge which may be ex-ploited to improve the mining process. In particular, indi-vidual alarms contain topographical information identifying the network elements which generated them. This paper ad-dresses the challenge of harnessing this latent domain knowl-edge in order to provide criteria for automatically evaluating the plausibility of mined alarm correlations.
Section 2 sets out current approaches to event correlation and sequential data-mining. Section 3 outlines the Topo-graphical Proximity algorithm which exploits topoTopo-graphical attributes of alarm data for mining sequential patterns in network alarm data. Section 4 describes experiments under-taken to provide a qualitative evaluation of the topographi-cal proximity approach for mining telecommunications alarm data. The results are presented and discussed in section 5.
2.
BACKGROUND
In the past, the task of network fault localization and management was performed by human experts. The size and complexity of today’s networks, however, mean that the levels of human intervention required to perform this function are prohibitively high. Currently, many systems employ event correlation engines to address this issue. The problem of automatically identifying events for correlation has been tackled from various perspectives. Model traversal approaches aim to represent the interrelations between the components of the network [8] or causal relations between possible events in the network [3] or a combination of the two [10]. Correlations are identified as alarms propogate through the model. Rule-based [6] and code-based [14] systems also model the relations between events in the system, specifying correlations according to a rule-set or codebook. Other AI techniques, such as neural networks [13] or decision trees, have also been applied to the task.
knowledge required to train the system. Neural networks, for example, can require no expert input whereas model-based techniques may be fully reliant on the insights of a human expert. The domain of sequential data mining ad-dresses the specific problem of identifying relationships or correlations between events in a raw dataset which is inher-ently sequential in nature, such as fault data which consists of a series of timestamped events. The output of this min-ing process may then be used as the input to a rule-, code-or model-based approach. The basic objective is to find
noteworthysequences of events, or sequential patterns, that suggest relationships between constituent events. In prac-tice, a noteworthy sequence often equates to a frequently occurring sequence in the data set. However, in the case of network alarm data, frequency as the sole measure of se-quence “noteworthiness” is not a valid measure as frequency may indicate redundancy. The research presented here is motivated by the need to establish novel criteria for pattern selection in sequential data mining.
Mining for sequential patterns can be viewed as a subset of the problem of mining for associations between dataset elements in general, constrained by the temporal aspects of the data. Much of the foundation work in sequential mining techniques shares a common historical origin in the Apriori association rule mining algorithm for transaction data [2]. Apriori is based on the assumption that a frequent set of elements must consist of elements which are themselves fre-quent. The algorithm generates a set of frequent sequences by iterating through a “generate and count” process, gen-erating candidate sequences of increasing length and prun-ing the set based on sequence support, i.e. normalised fre-quency. Candidates are generated by a process of merging two existing sequences of lengthn−1 to give a sequence of lengthn, as in example 1.
ABC+ABD=> ABCD (1) The GSP [9] and WINEPI [7] algorithms were the first to adapt the Apriori technique to mine for temporal associa-tion rules in sequential data. Both employ a sliding time window with a user-specified duration to traverse the input data, extracting sequences according to user-specified mini-mum and maximini-mum sequence duration constraints. The two algorithms do, however, differ significantly in design and im-plementation details. Other Apriori-based approaches aim to optimise performance within the same conceptual frame-work. MINEPI [7] is an extension of the WINEPI algo-rithm which optimises the space and time constraints by compressing event sequences to their minimal occurrence time window. FreeSpan [4] focuses on the candidate gen-eration process employing a database of projected sequence extensions to ensure that the system only generates candi-dates that exist in the data. Extensions of this algorithm modify the projected database structure and access to opti-mise the depth-first search of possible candidate sequences. SPADE [15] decomposes the search space and uses lattice-based search strategies to optimise performance. Other ap-proaches are designed to identify sequences according to cri-teria other than frequency such as periodicity [5], causality [11] or predictive power [12]. The research set out below is loosely based on an Apriori approach and introduces a novel criterion for sequence selection which evaluates se-quence plausibility and coherence in the context of network topology.
3.
TOPOGRAPHICAL PROXIMITY
The sequential mining algorithms outlined in section 2 are capable of efficiently identifying thousands of event se-quences in sequential input data. Therefore, post-processing remains an essential component of a useful system whereby sequences which are deemed to be uninteresting, because they are redundant or implausible, are eliminated from the output. This filtering may be automated using templates or performed by domain experts. The Topographical Prox-imity (TP) algorithm introduced in this paper constitutes a means of determining the plausibility of a correlation be-tween events in mined sequences at runtime of the min-ing process. The measure quantifies how closely alarm-generating elements are connected to each other in terms of the logical structure of a network. The algorithm is intended to be eclectic using any information available in alarms which relates to the multiple topologies of a net-work, from the topology of physical nodes to any of the multiple views of the management information tree. In prac-tice, the system uses the fully distinguished names (FDNs) of network entities, both nodes and links, to extrapolate information regarding the relative positioning of nodes in the containment hierarchy of the management information tree. The general assumption is that the closer the alarm-generating elements within this topographical realisation of the network, the more plausible, and hence interesting, the relationship between the alarms and the greater likelihood that there is some cause and effect relationship between them.
The algorithm is not reliant on a pre-defined network con-figuration as it exploits the topographical information en-coded in the alarms themselves. This information is eval-uated relative to a specification of node types and of the strength of possible relationships between node types. Con-nections are inferred at run-time between pairs of alarm-generating nodes in the data and a Topographical Proxim-ity (TP) measure is assigned based on the strength of the inferred connection. The TP measure is used to reject or promote candidate sequences on the basis of their plausibil-ity, i.e. the strength of their connection, thereby reducing the candidate sequence set and optimising the space and time constraints of the data mining process. The TP mea-sure may also be used at post-processing to rank sequences in terms of the connectedness of their constituent alarm events. Section 3.1 outlines the assumptions underlying the topographical proximity approach and details how the topo-graphical proximity measure is calculated. Section 3.2 sets out how the TP measure has been integrated into the se-quential mining process.
3.1
TP Calculation Algorithm
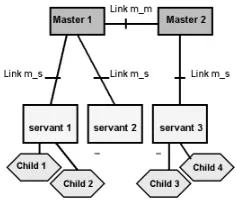
particu-Figure 1: Simplified Network Schema
lar, the source node FDN attribute identifies the node’s an-cestors within the containment hierarchy. Other attributes specify further topographical information, such as relevant links or resources. The relationships defined between source node types are categorised as node identity, adjacency, sis-terhood and subsumption. The type of relationship and the degree of certainty that there exists such a relationship between alarm-generating nodes in the network is defined according to the level of shared, reciprocal or disjunct topo-graphical information extracted from the two alarms, as set out in the table below.
Relationship category Information overlap
Identity Full Matching FDNs
Adjacency Reciprocal information
Subsumption, sisters Shared information
Unrelated nodes No shared information
Unrelated alarms Disjunct information
The TP calculation algorithm evaluates the logical dis-tance between two insdis-tances of alarm-generating network elements on the basis of the two source node types and the relationship type extrapolated from the topographical in-formation in the alarms. A finite set of TP values for the possible relationships between different node types was de-fined by domain experts and is stored in a relationship table for use at run-time. The value has a minimum of zero for nodes that have no logical connection in the network and a maximum of one for nodes with a clear and close rela-tionship in the network. At run-time, each alarm is parsed for all available topographical information. This is used to determine which relationship may hold between two alarm-generating nodes and an appropriate Topographical Prox-imity (TP) value from the relationship table is assigned, as set out in algorithm 1.
The closest relationship is node identity (T P = 1), e.g. two alarms originating from theM aster1 node in figure 1. The loosest connection is where two nodes have only a shared subnetwork in common (T P = 0.2), e.g. two alarms origi-nating from nodesChild1 andChild4 in figure 1. An ad-jacency relation holds between alarms originating on nodes
M aster1 andM aster2 if there is a reference toLinkM M,
T P = 0.9. If both alarms refer to the link, T P = 1. All other connections are assigned values (0≤T P ≤1) to re-flect the closeness of the relationship.
3.2
TP Mining Algorithm
The mining algorithm incorporating the Topographical Proximity measure derives from the MINEPI algorithm [7].
Algorithm 1calculateTP
INPUT:alarm1,alarm2: two alarm events OUTPUT:TPvalue
Identifynode1, source node type ofalarm1
Identifynode2, source node type ofalarm2
Identify relationship between node1 and node2, given
topographical information available
Look up TPvalue in the predefined relationship table. Return TPvalue for this relationship
It uses a sliding time window to traverse the data, generating candidate sequences of length nby combining two existing sequences of lengthn−1 and storing occurrences of all se-quences above a user-specified frequency threshold for sub-sequent iterations. However, where MINEPI is optimised for time, storing the most compact, or minimal, occurrences of all frequent sequences, the TP algorithm is optimised for se-quence connectedness, storing sese-quence occurrences whose TP value exceeds a given TP threshold parameter. The algorithm to calculate topographical proximity for candi-date sequences is set out in algorithm 2. The TP value for an occurrence of a candidate sequence is the mean of the TP values for the two existing sequence occurrences to be merged and the proximity value calculated for the first and last alarms of the new candidate. This latter TP cal-culation is necessary to evaluate the new connection in the candidate sequence, i.e. the connection which is not present in the subsequences.
The full candidate generation algorithm is set out in al-gorithm 3. Candidate sequences must conform to user-specified sequence duration, frequency and topographical proximity parameters. The added cost of the TP compu-tation is minimal as, for each occurrence of a new candidate sequence, only one new TP calculation is carried out. Fur-thermore, even this cost is offset by the reduction in search space of candidate sequences at each iteration achieved by imposing a minimum TP value threshold. The output to the mining process is a set of sequences which are both frequent and represent plausible connections in the network. Sec-tion 5 explores the impact of the topographical proximity measure on the accuracy of the mining algorithm.
Algorithm 2calculateSequenceTP
INPUT:seq,{alarm1, alarm2. . . alarmn} OUTPUT:TPvalue
if length(seq) == 2then
returncalculateT P(alarm1, alarm2) else
T Pseq1= Retrieve from memory T Palarm1···(n−1) T Pseq2= Retrieve from memory T Palarm2···n
T Pnew=calculateT P(alarm1, alarmn)
return T Pseq1+T Pseq2+T Pnew
3 end if
4.
EXPERIMENTS
[image:3.612.114.232.56.160.2]Algorithm 3TP mining algorithm
INPUT: seq1, seq2: 2 sequences of length n−1, e.g.
ABC and BCD
OUTPUT:newSeq: sequence of lengthn, e.g. ABCD for allo1 such thato1 isaoccurrence ofseq1 do
for allo2 such thato2isaoccurrence ofseq2 do
Posit occurrenceonewSeq from starto1 to endo2 if Duration onewSeq≤maximumDurationthen
T PnewSeq=calculateSequenceT P(onewSeq) if T PnewSeq≥T P thresholdthen
storeonewSeq end if
end if end for end for
if #occurrencesnewSeq≤f requencyT hresholdthen Prune newSeq
end if
meant that research to date has tended to focus on system performance in terms of computational complexity rather than accuracy. The experiment described below aims to ad-dress this shortfall with an evaluation of the quality of the output of the mining algorithm. A synthetic gold standard dataset was created by introducing synthetic alarms into real network alarm data. It was possible then to evaluate sys-tem performance in identifying sequences which are present in known quantities and distributions in the data. The ex-periment was run on a Pentium 4 3.2 GHz processor with 2 GB of RAM running Microsoft Windows XP Professional version 2002.
4.1
Performance Metrics
The metrics used to determine performance in the experi-ment reported below are the measures of precision and recall borrowed from the Information Retrieval domain. In the context of this mining experiment, the measures are defined as follows:
• Precision: the number of correctly identified target sequence instances relative to the total number of se-quence instances found by the system.
P recision=No. of correct instances found Total no. of instances found (2)
• Recall: the number of correctly identified target se-quences relative to the total number of inserted target sequences.
Recall= No. of correct instances found
No. of instances in the target set (3)
These two metrics may be combined to give a single in-dicator of system performance, the F Score, which may be interpreted as a measure of the accuracy and precision of the result set. F Score is calculated according to the following formula:
F Score= 2 * Precision * Recall
Precision + Recall (4)
These metrics focus on the performance of the mining al-gorithm in terms of its ability to identify patterns known to exist in the data while restricting these patterns to ones which represent plausible connections in a telecommunica-tions network.
4.2
Dataset
The basic dataset for each experiment consists of 96,991 individual radio access network (RAN) alarms from a live telecommunications network plus 10,538 inserted alarms.1
The alarm format conforms to 3GPP FM standards [1] and includes a timestamp with a granularity of milliseconds and thirteen attributes relating to four broad categories of alarm timing, event lifecycle, alarm type and alarm source infor-mation. The RAN contained 2 RNC nodes, 304 RBS nodes and 1800 cells.
4.2.1
Synthetic alarm sequences
The synthetic alarm sequences were designed to be unique in the data but yet correspond to known correlation patterns in telecommunications alarm data. The two sequences con-form to the timing and network element constraints of two common inter-event correlations identified by network ex-perts in telecommunications alarm data. All attributes, in-cluding topographical information, of the component alarms, however, have been assigned synthetic values which do not occur in the original dataset. Synthetic sequence A consists of four alarms on the same network node, three within 10 milliseconds followed by a fourth alarm after 200 seconds. Sequence B consists of two alarms on the same Master Node occurring 200 seconds apart.
4.2.2
Synthetic Dataset
The two synthetic sequences were introduced into the orig-inal dataset of 96,991 alarms. Synthetic sequences were in-serted at random within sub-blocks of 10,000 alarms, be-tween 100 and 200 times per sub-block. From a random start time, all sequences are interleaved with existing alarms ac-cording to the timing constraints specified for the synthetic alarm sequence. The resulting dataset comprises 107,529 alarms: 96,991 original alarms plus 10,538 synthetic alarms, 1,668 instances of Sequence A and 1,933 of Sequence B.
4.3
Test Cases
The sequence length, time window and minimum support system parameters for this experiment were dictated by the constraints on target sequence insertion into the original alarm data. Maximum sequence length was fixed at four alarms per sequence. The time window parameter was fixed at 240 seconds as both synthetic sequences have a duration of approximately 200 seconds. The minimum support pa-rameter, which specifies the required pattern frequency per block of 10,000 alarms, was tested with the range of 50–175 occurrences at intervals of 25 occurrences. For each of the six support threshold values, baseline system performance was calculated using the basic MINEPI algorithm,T P = 0, and seven further test cases were evaluated at 0.4≤T P ≤1.0, giving a total of 48 test cases. The aim was to investigate the interactions between the support and TP threshold sys-tem parameters and establish optimum parameter values for the identification of known target sequences in the data.
4.4
Procedure
The mining algorithm was run on the set of 107,529 alarms for the 48 test cases. Precision, recall and F Score values
1
0 0.4 0.5 0.6 0.7 0.8 0.9 1 0
1000 2000 3000 4000 5000 6000 7000
TP Threshold Freq=50 Freq=75 Freq=100 Freq=125 Freq=150 Freq=175
50 75 100 125 150 175 0
1000 2000 3000 4000 5000 6000 7000
Frequency Threshold
Number of Patterns Found
[image:5.612.166.444.54.204.2]TP=0 TP=0.4 TP=0.5 TP=0.6 TP=0.7 TP=0.8 TP=0.9 TP=1.0
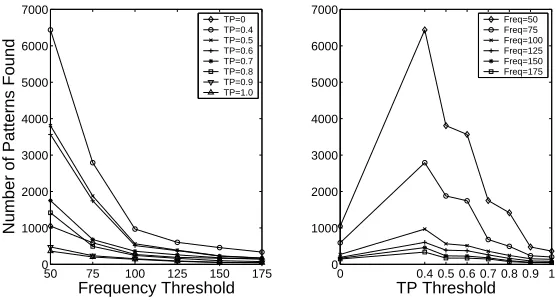
Figure 2: Number of Patterns Found attimeW indow= 240according to TP and Support Frequency thresholds
were calculated based on the number of occurrences of the synthetic target sequences found relative to the number of known occurrences in the synthetic dataset. The results are presented and discussed in section 5.
5.
RESULTS
The performance of the system is evaluated firstly in gen-eral terms relating to the size of the output sequence set identified for each test case and secondly with a precise qual-itative evaluation on the task of identifying known sequence instances in the data.
5.1
Performance Overview
The two plots in figure 2 give a general overview of system performance represented by the number of patterns found during the mining process for this dataset. In the absence of a gold standard, it is not possible to know thecorrect num-ber of patterns which a mining algorithm should identify. In order to merit the computation of the mining process, however, the output set should consist of a set of good se-quences which is significantly smaller than the input data set. The TP approach is designed to ensure that the output sequences are “good” in the sense of plausible within the network. Figure 2 examines how the system parameters of support and TP threshold impact on the size of the output sequence set. The first plot illustrates the expected outcome that at high support thresholds there is a marked reduction in the number of patterns identified in the data. Indeed, the number of patterns found at high support thresholds converges for all TP values. It is perhaps more interesting to look at the behaviour of the algorithm at low support thresholds:
• Low TP values (0.4≤T P ≤0.6): there is a significant increase in the size of the output set relative to the MINEPI baseline;
• Mid TP values (0.7≤T P ≤0.8) exhibit similar char-acteristics to the baseline performance;
• High TP values (T P ≥0.9) the output set is consis-tently smaller than the baseline.
These observations would suggest firstly that a low TP thresh-old is not sufficiently powerful to restrict the output se-quence set. This factor is offset by the quality of output sequences which should reflect some plausible connection
between constituent alarm-generating nodes. Secondly, for mid-range TP thresholds, baseline performance is achieved with the added benefit of plausible sequences. Finally, for high TP thresholds, the support parameter has little im-pact on the size of the output set. Therefore, infrequent sequences may be identified in the data without an atten-dant explosion in the number of patterns found. This would suggest that improvements in system performance may be achieved by refining the node and connection type defini-tions which determine TP assignment values at run-time. These definitions may also be customised to specific mining tasks.
5.2
Target Sequence Identification Task
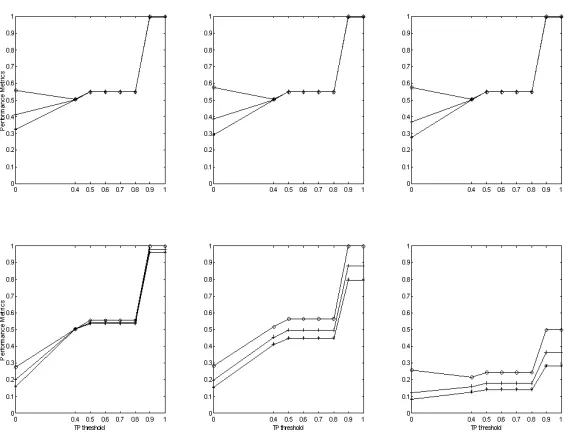
The six plots in figure 3 present system performance on the synthetic sequence identification task for each of the six support parameter values. There is a very clear trend across all support value thresholds: as the TP threshold in-creases, there is marked increase in precision, recall and F Score value with perfect performance, where all sequences are correctly identified, forT P = 0.9,1 at 50≤support≤125. There is a reduction in the performance measures for
support≥150. The decrease in recall forsupport= 150 rep-resents a reduction in the number of target sequences found. This result reflects the random nature of the sequence in-sertion process, where not all blocks of 10,000 alarms con-tain the same number of sequences and individual sequences may not pass the support threshold for some processing blocks. There is a marked reduction in performance for
Figure 3: Performance metrics attimeW indow= 240,T P ={0,0.4,0.5,0.6,0.7,0.8,0.9,1},100≤SupportF requency≤
175. Precision: -*-, Recall: -O-, F Score: -+-.
of the permutations of the target sequences in this data. This gives further support to the hypothesis that even loose topographical proximity constraints will ensure that mined sequences converge with sequence types defined by network analysts. Furthermore, there is no apparent trade-off be-tween precision and recall values for this approach suggest-ing that the minsuggest-ing process is both selective and accurate, maintaining tight control on candidate sequence promotion while exploring the full range of sequence instances.
6.
CONCLUSIONS
The main contribution of this paper is to introduce the Topographical Proximity (TP) measure for mining alarm data for event correlations. This measure exploits the topo-graphical information encoded in alarms to validate all can-didate sequences at run-time with respect to the plausibility of the possible correlation they represent. The second sig-nificant contribution is to provide a qualitative evaluation of the performance of the mining algorithm. The evalua-tion results would strongly suggest that the performance of the mining algorithm improves with the inclusion of the TP measure.
7.
REFERENCES
[1] 3GPP. 3rd generation partnership project technical specification group services and system aspects.
Telecommunication management. Fault Management. Part 2: Alarm Integration Reference Point (IRP), Information Service (IS), (Release 6) 3GPP TS 32.111-2 V6.3.0, 3GPP, 2004. [2] R. Agrawal, T. Imielinski, and A. N. Swami. Mining
associations between sets of items in massive databases. In Proc. of ACM-SIGMOD 1993 International Conference on Management of Data, pages 207–216, May 1993.
[3] R. Gopal. Layered model for supporting fault isolation and recovery. InProc. of NOMS’00, Hawaii, 2000.
[4] J. Han, J. Pei, Y. Yin, and R. Mao. Mining frequent patterns without candidate generation: A frequent-pattern tree approach.Data Mining and Knowledge Discovery, 8(1):53–87, 2004.
[5] E. O. Heierman, G. M. Youngblood, and D. J. Cook. Mining temporal sequences to discover interesting patterns. In Proceedings of KDD 2004, Workshop on mining temporal and sequential data, 2004.
[6] G. Liu, A. K. Mok, and E. J. Yang. Composite events for network event correlation. InIM’99, pages 247–260, 1999. [7] H. Mannila, H. Toivonen, and A. I. Verkamo. Discovery of
frequent episodes in event sequences.Data Mining and Knowledge Discovery, 1:259–289, 1997.
[8] D. M. Meira and J. M. S. Nogueira. Modelling a
telecommunication network for fault management applications. InProc. of NOMS’98, pages 723–732, 1998.
[9] R. Srikant and R. Agrawal. Mining sequential patterns: Generalizations and performance improvements. InProc. of EDBT’96, 1996.
[10] M. Steinder and A. S. Sethi. Non-deterministic diagnosis of end-to-end service failures in a multi-layer communication system. InProc. of ICCCN’01, pages 374–379, Arizona, 2001. [11] R. Sterritt. Discovering rules for fault management. InProc. of
ECBS’01, pages 190–196, 2001.
[12] G. M. Weiss. Predicting telecommunication equipment failures from sequences of network alarms. In W. Kloesgen and J. Zytkow, editors,Handbook of Knowledge Discovery and Data Mining. Oxford University Press, 2002.
[13] H. Wietgrefe, K.-D. Tuchs, K. Jobmann, G. Carls, P. Frohlich, W. Nejdl, and S. Steinfeld. Using neural networks for alarm correlation in cellular phone networks. InProc. of IWANNT 1997, 1997.
[14] S. A. Yemini, S. Kliger, E. Mozes, Y. Yemini, and D. Ohsie. High speed and robust event correlation.IEEE
Communications Magazine, 34(5):82–90, 1996.