Imaging of Fluid in the Temporomandibular Joint
Kenneth A. Bel1
,1.2
Jerome P
.
Jones
,
1K
e
nneth D
.
Miller
,
1and
De
e
na AI-R
e
f
a
i
1PURPOSE: To assess the value of an added gradient echo in the same pulse sequence with a
T1-weighted spin echo for determining the presence of an abnormal fluid collection in the
temporo-mandibular joint with no additional imaging time. MATERIALS AND METHODS: Using a standard T1-weighted sequence used in cine temporomandibular joint imaging, a readout gradient reversal was added and the resulting gradient echo collected. This image was compared with standard T1 -and T2-weighted sequences, a short inversion recovery imaging sequence, and a small flip angle fast low-angle shot gradient-echo sequence. RESULTS: The T1-weighted spin echo preceeding
the added gradient echo is not affected by the gradient reversal, but the additional gradient echo
adds T2* contrast information that displays fluid as bright as and compares favorably with other fluid detection sequences. CONCLUSION: The added gradient-echo technique adds sensitivity for
the detection of an abnormal increase in fluid in the temporomandibular joint without adding to
the overall imaging time of a routine T1-weighted sequence.
Index terms: Temporomandibular joint, magnetic resonance; Magnetic resonance, technique
AJNR 14:375-381, Mar/ Apr 1993
Magnetic resonance (MR) imaging has been
shown by many investigators to be useful in
evaluating temporomandibular joint (T MJ)
dys-function (1-44)
.
Particularly helpful are
"cine"
studies where each image of a set is collected
with the patient posed at a different degree of
jaw opening (3-5, 20, 27). This image set is
viewed in a cine display for evaluation of joint
motion. Since several images may comprise a
set, it is very desirable to keep the acquisition
time for each image reasonably small while
re-taining adequate image quality. In particular,
im-age contrast must be sufficient to evaluate the
condylar marrow signal (to detect bone
abnor-malities such as avascular necrosis) and to detect
the presence of abnormal fluid accumulations in
the TMJ (which might account for patient
dis-comfort as the jaw is opened). Thus
,
sensitivity
Received December 13, 1991; accepted contingent on revision March 31, 1992; revision received June 22.
1 Department of Radiology, Alton Ochsner Medical Foundation, New Orleans, LA 70121.
2
Address reprint requests to Jerome P. Jones, Department of Radiol-ogy/MRI Building, Alton Ochsner Medical Foundation, 1516 Jefferson
Highway, New Orleans, LA 70121.
AJNR 14:375-381, Mar/Apr 1993 0195-6108/93/1402-0375
©
American Society of Neuroradiology375
to both fat and fluid is very desirable within
the
constraints of short
imaging
time.
The water-sensitive T2-weighted
spin-echo
and short inversion recovery imaging
(STIR)
se-quences require too long a repetition time
(TR)
for reasonable scan times in
cine
studies
.
Both
T1-weighted spin-echo and small tip angle
gra-dient-echo sequences allow
short scan times (on
the order of 1 minute)
,
with T1-weighted
se-quences giving strong marrow signal while
the
gradient-echo sequences give a relatively
strong
water signal. Running both these
sequences gives
the desired range of
image contrasts
through
the
range of jaw motion, but having
to
run
two
sequences at each cine pose doubles the
exami-nation time
.
This increase
in examination
time
can
be
avoided by combining both the
spin echo and
gradient
echo
into a single
sequence.
A basic
single-echo
spin-echo
sequence
is
modified
to
produce an additional gradient
echo by
simply
reversing
the
readout
gradient after
the spin
ech
o
has been
collected and
measuring
the gradient
echo which forms
(see Fig
.
1
).
This added
gra-d
i
ent-echo
(AGE) sequence simultaneously
pro-duces
the strong marrow
sign
al
on
t
he
T
Standard Sequence Added Gradient Echo (AGE) 180
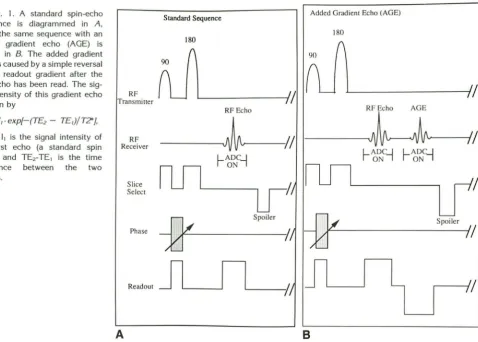
180 Fig. 1. A standard spin-echo
sequence is diagrammed in A, while the same sequence with an added gradient echo (AGE) is shown in
B.
The added gradient echo is caused by a simple reversal of the readout gradient after the first echo has been read. The sig-nal intensity of this gradient echo is given byRF
Transmiller L---~
/
~
n_---f
( u
l
//
RF Echo RF Echo AGE
12 = 11·exp[-(TE2 - TE,)/T?J,
where 11 is the signal intensity of the first echo (a standard spin echo), and TE2-TE, is the time difference between the two echoes.
RF
Receiver
--~~//
A
Slice Select
Phase
Readout
water signal from the gradient echo
.
Even better,
both
echoes
are obtained in the same scan time
as a
single
T1-weighted image having the same
repetition time (TR)
,
matrix size, and number of
acquisitions. To our knowledge, such a simple
technique has not been reported--that is, one
which mixes standard spin echoes with gradient
echoes
(other
sequences produce only one or the
other).
Materials and Methods
All imaging was performed on
either of two 1.5-
T
MR
systems (Sieme
ns M
edica
l
Systems, Iselin
,
NJ). Our basic
approach was to determine the image contrast
b
e
havior
of
the AGE
seq
uenc
e a
nd
then apply it to clinical studies.
Initi
a
lly
, a
phantom conta
ining
oil, water, and water doped
with
a small amount of
copper nitrate was imaged with
standard
T1- and T2-weighted sequences
,
the AGE
se-quence
,
a ST
IR
sequence, a
nd
a small flip angle
gradient-echo sequence,
fast low-angle shot (FLASH).
Th
e
TR
,
TE,
and other parameter values used were the same as
antici-pated
for
use in clinical T MJ
studies
.
(Since
two 1.5-
T
systems which
are different
models
were
used
,
the
exact
values
of TR
and
TE varied from one system
to the other.
The
exact
values used
are
listed in the figure
captio
ns
.
)
Spoiler
~---~;;
B
After
some
initial
drawbacks
were
solved,
the AGE
se-quence
was incorporated
into
our
routine
cine
TMJ
imaging
protocol, with
208 examinations
being performed
(and
continuing
to be performed). In addition, those TMJ
studies
in
which abnormal
fluid accumulation was clearly
sug-gested by AGE were followed up
with standard
closed-mouth T2-weighted
,
STIR, or gradient-echo sequences
known
to
be
sensitive
to
fluids (17 of
the
208
examina-tions). The images were then compared for
their
contrast
properties
and
in
one
particular
case, surgical
verification
was
also availab
le.
Results
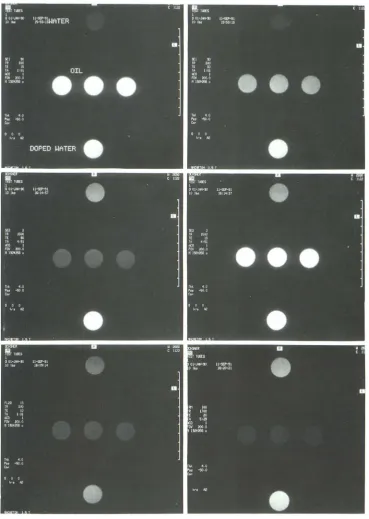
Figure 2 shows the results obtained from the
phantom of test tubes. Plain water was found to
produce its strongest signal on the T2-weighted,
FLASH
15°,
and STIR sequences
,
while oil
pro-duced its strongest signal on
the
T
1-weighted and
AGE images
.
Thus, with these
fluids,
the AGE
image was T1-weighted
,
at least for the TR and
TE values used here.
Figure
3 shows a T1-weighted and AGE image
[image:2.615.81.560.76.418.2]sim-ilar to the Tl-weighted image in appearance
.
In
particular, there is no strong signal from within
the joint space; the normal tissues produce little
signal on either image.
Figure 4 shows the results from a study in
which the patient had a surgically verified cyst in
the TMJ. All the sequences used with the
phan-tom were run with this patient's jaw closed and
resulted in images consistent with a cyst. Of
particular interest is the observation that the AGE
image shows the cyst with the same type of
Fig. 2. Images from the phan-tom study. The upper row shows
the two images from an AGE
se-quence; the T1-weighted image
(300/15/1; TRITE/acquisitions) on the left and the AGE image (300/30/1) on the right. The mid
-dle row shows the two echoes of a T2-weighted sequence ( 1500/ 15,90/1), and the bottom row
shows a FLASH 15° image (300/ 10/1) on the left and a STIR image on the right (1700/20/1 with a Tl of 100 msec).
[image:3.614.58.427.73.592.2]be-Fig. 3. A set of closed-mouth images in a normal patient study. Four T1-weighted (350/28/1) images are shown on the left and
four AGE (350/40/1) images on the right, each presented as two adjacent sections from each side of the patient. Note that the condylar
marrow (arrows) tends to be bright on T1-weighted images and dark on AGE images. Fluid in the temporomandibular joint is not normally observed on either image.
cause the normal T MJ tissues are much more
inhomogeneous than fluid, and thus do not
pro-duce as strong a gradient-echo signal (compare
Fig. 3 and Fig
. 4).
Figure 5 is a case typical of the 16 other cases
in which the AGE image suggested abnormal fluid
collection. This patient complained of limited
mo-tion due to pain as her mouth opened. Again
, the
AGE image shows the same sense of contrast
properties as the T2-weighted and other
fluid-sensitive images, although the contrast is not as
strong. Note also the small pocket of fluid buildup
just anterior to the meniscus; such buildups are
normally not observed and could account for the
patient's pain on opening.
Discussion
AGE has been found to be a useful technique
for obtaining images
sensitive
to TMJ fluid
in
cine
studies
.
It
is
added to a T
1-weighted
spin-echo sequence
, so it allows the usual Tl-weighted
images to be obtained. In
addition, it allows
track-ing
of the motion of the fluid during jaw opening,
with no
change
in
total examination
time or
spatial
resolution.
AGE also makes no unusual
demands
upon
the gradient
system and uses
no
additional
radio
frequency power;
however
,
it
should be noted
that AGE does have some
prop-erties that should be considered before imple
-mentation: 1) fewer sections can be collected per
TR due to the second echo; 2) the AGE image is
both phase and frequency reversed, requiring an
offline 180° rotation of the image before
presen-tation (to produce correct labeling)
;
3) the AGE
image is often too faint for otherwise low
signal-to-noise imaging; and 4) the AGE image is more
motion-sensitive than standard spin-echo images.
The contrast properties of AGE are essentially
those of a standard spin echo, but multiplied by
the T2* decay from the first (Tl-weighted) echo
to the gradient echo.
AGE was implemented so
that the added gradient echo occurred 10-12
msec (depending upon which MR unit was used)
after the standard Tl-weighted spin echo. Both
the
signal
and contrast of this added
gradient-echo image are the same as the conventional T
1-weighted spin echo multiplied by any T2*
con-trast effects generated in the
10-12 msec between
echoes. This additional T2* contrast is very
im-portant because it
is what
causes
most
tissues
around a joint to produce minimal signal. Only
the
homogeneous
tissues
such as
fat
and
fluids
retain appreciable signal,
so they stand out
quite
clearly on
the
AGE
images.
Since both
fat
and
water tend to
be
bright
on AGE
images,
they
[image:4.612.55.559.78.326.2]echo (which
shows fat much brighter than
water)
or from a fat-suppression technique
such as fat
presaturation
.
The AGE
technique
may also be helpful
in
several other possible applications
, such as
other
types of cine-posing examinations, spine imaging
to differentiate osteophytes from disk
material,
imaging of other joints, or locating
hemosiderin
Fig. 4. Images from a patient diagnosed as having a cyst (arrow) which was surgically verified as
secondary to synovial osteochon
-dromatosis. The top row images are the T1-weighted and AGE im
-ages (350/28,40/1 ), the middle
row images are those from the T
2-weighted sequence (2000/28,90/
1 ), and the bottom row are FLASH
15° (300/18/1) and STIR images (1700/34/1 with Tl = 100 msec).
deposits
in
the brain.
In fact
,
any application
[image:5.612.56.423.80.614.2]Fig. 5. Images from a patient with temporomandibular joint pain on jaw opening. The top row images are closed-mouth T1-weighted
(350/25/1 ), T2-weighted (2000/90/1 ), and AGE images (350/37 /1) as viewed from left to right. The middle row images are all AGE
images (350/37/1) at closed, moderately opened, and full open positions (left-to-right), while the bottom row images are the
T1-weighted images (350/25/1) at the same section position and degrees of opening. The meniscus is seen to be anteriorly dislocated (curved arrows) and a fluid collection in the anterior part of the inferior joint space is also observed (straight arrows).
for axial spine images
,
thin section imaging, and/
or half Fourier imaging due to poor
signal-to-noise with resultant poor detectability of
struc-tures of interest. AGE also has the severe
artifac-tual distortions that any gradient-echo sequence
can hav
e
with patients who have dental braces
or other metallic implants within the field of view.
Despite these drawbacks
,
AGE may have a wide
range of uses. The AGE technique is easily ap
-pli
e
d to any basic sequence
:
standard spin echo
(as illustrated in this report), inversion recovery
,
or even a primary gradient-echo sequence such
as FLASH; however
,
the clinical role for such
AGE combinations has not yet been considered
.
References
2. Avrahami E, Schreiber R, Benmair J, Paltiel Z, Machtey J, Horowitz
I. Magnetic resonance imaging of the temporo-mandibular joint and
meniscus dislocation. Br J Radio/1986;59: 1153-1158
3. Burnett KR, Davis CL, Read J. Dynamic display of temporoman dib-ular joint meniscus by using "fast-scan" MR imaging. AJR 1987;
149:959-962
4. Conway WF, Hayes CW, Campbell RL, Laskin DM. Temporomandib
-ular joint motion: efficacy of fast low-angle shot MR imaging. Radiol
-ogy 1989; 172:821-826
5. Drace JE, Enzmann DR. Defining the normal temporomandibular
joint: closed-, partially open-, and open-mouth MR imaging of asymp
-tomatic subjects. Radiology 1990;177:67-71
6. Drace JE, Young SW, Enzmann DR. TMJ meniscus and bilaminar
zone: MR imaging of the substructure-diagnostic landmarks and
pitfalls of interpretation. Radiology 1990;177:73-76
7. Harms SE, Wilk RM. Magnetic resonance imaging of the temporo
-mandibular joint. Radiographies 1987;7:521-542
8. Harms SE, Wilk RM, Wolford LM, Chiles DG, Milam SB. Tempor
o-mandibular joint: magnetic resonance imaging using surface coils. Radiology 1985;157:133-136
9. Hansson L-G, Westesson P-L, Katzberg RW, et al. MR imaging of the
temporomandibular joint: comparisons of images of autopsy speci
-mens made at 0.3 T and 1.5 T with anatomic cryosections. AJR
1989;152: 1241-1244
10. Hasse AN, Christiansen EL, Alder ME. The temporomandibular joint.
Radio/ C/in North AM 1989;27:301-314
11. Helms CA, Doyle GW, Orwig D, McNeill C, Kaban L. Staging of internal derangements of the TMJ with magnetic resonance imaging:
preliminary observations. J Craniomandibular Oisord 1989;3:93-99
12. Helms CA, Gillespy T Ill, Sims RE, Richardson ML. Magnetic r
eso-nance imaging of internal derangement of the temporomandibular joint. Radio/ C/in North Am 1986;24: 189-192
13. Helms CA, Kaban LB, McNeill C, Dodson T. Temporomandibular joint: morphology and signal intensity characteristics of the disk at
MR imaging. Radiology 1989; 172:817-820
14. Helms CA, Kaplan P. Diagnostic imaging of the temporomandibular
joint: recommendations for use of the various techniques. AJR 1990;
154:319-322
15. Herzog S, Mafee M. Synovial chondromatosis of the TMJ: MR and CT findings. AJNR 1990;11:742-745
16. Kaplan PA, Helms CA. Current status of temporomandibular joint imaging for the diagnosis of internal derangements. AJR 1989; 152:
697-705
17. Kaplan PA, Tu HK, Williams SM, Lydiatt DD. The normal temporo
-mandibular joint: MR and arthrographic correlation. Radiology 1987;
165:177-178
18. Katzberg RW. Temporomandibular joint imaging. Radiology 1989;
170:297-307
19. Katzberg RW, Bessette RW, Tallents RH, et al. Normal and abnormal temporomandibular joint: MR imaging with surface coil. Radiology
1986;158:183-189
20. Katzberg RW, Westesson P-L, Tallents RH, et al. Temporomandibular joint: MR assessment of rotational and sideways disk displacements.
Radiology 1988; 169:7 41-7 48
21. Kircos L T, Ortendahl DA, Mark AS, Arakawa M. Magnetic resonance
imaging of the TMJ disc in asymptomatic volunteers. J Oral .Maxil
-lofac Surg 1987;45:852-854
22. Kneeland JB, Carrera GF, Ryan DE, Jesmanowicz A, Froncizw W,
Hyde JS. MR imaging of a fractured temporomandibular disk pr
os-thesis. J Comput Assist Tomogr 1987;11:199-200
23. Kneeland JB, Ryan DE, Carrera GF, Jesmanowicz A, Froncizw W,
Hyde JS. Failed temporomandibular joint prostheses: MR imaging.
Radiology 1987; 165:179-181
24. Lieberman JM, Bradrick JP, lndresano AT, Smith AS, Ballone EM.
Dermal grafts of the temporomandibular joint: postoperative appear
-ance on MR images. Radiology 1990; 176: 199-203
25. Nance EP Jr, Powers TA. Imaging of the temporomandibular joint.
Radio/ C/in North Am 1990;28: I 0 19-I 03 I
26. Pollei SR, Schellhas KP. Magnetic resonance imaging of the temp
o-romandibular joint. Semin Ultrasound CT MR 1990; 11 :346-36 I
27. Quemar JC, Bernard AM, Akoka S, Romdane H, Simon J, de Certaines JD. Magnetic resonance imaging of the TMJ: identification of anatomic elements by controlled movement and application to normal and pathologic clinical situations. J Craniomandibular Oisord 1989;3:20-24
28. Rao VM, Babaria A, Manoharan A, et al. Altered condylar morphology associated with disc displacement in TMJ dysfunction: observations
by MRI. Magn Reson Imaging 1990;8:23 1-235
29. Rao VM, Farole A, Karasick D. Temporomandibular joint dysfunction:
correlation of MR imaging, arthrography, and arthroscopy. Radiology
1990; 174:663-667
30. Roberts D, Schenck J, Joseph P, et al. Temporomandibular joint:
magnetic resonance imaging. Radiology 1985; 154:829-830 31. Schellhas KP. Internal derangement of the temporomandibular joint:
radiologic staging with clinical, surgical, and pathologic correlation.
.Magn Res Imaging 1989;7:495-515
32. Schellhas KP, Wilkes CH. Temporomandibular joint inflammation:
comparison of MR fast scanning with T 1-and T2-weighted imaging techniques. AJNR 1989; I 0:589-594
33. Schellhas KP, Wilkes CH, EI-Deeb M, Lagrotteria LB, Omlie MR.
Permanent Proplast temporomandibular joint implants: MR imaging of destructive complications. AJR 1988;151 :731-735
34. Schellhas KP, Wilkes CH, Fritts HM, Omlie MR, Heithoff KB, Jahn
JA. Temporomandibular joint: MR imaging of internal derangements
and postoperative changes. AJNR 1987 ;8: 1093-11 0 I
35. Schellhas KP, Wilkes CH, Fritts HM, Omlie MR, Heithoff KB, Jahn
JA. Temporomandibular joint: MR imaging of internal derangement
and postoperative changes. AJR 1988; 150:381-389
36. Schellhas KP, Wilkes CH, Omlie MR, et al. The diagnosis of temp o-romandibular joint disease: two-compartment arthrography and MR.
AJNR 1988;9:579-588
37. Schellhas KP, Wilkes CH, Omlie MR, et al. The diagnosis of temp
o-romandibular joint disease: two-compartment arthrography and MR.
AJR 1988; 151 :341-350
38. Schwaighofer BW, Tanaka TT, Klein MV, Sartoris DJ, Resnick D. MR imaging of the temporomandibular joint: a cadaver study of the value of coronal images. AJR 1990; 154: 1245- 1249
39. Shellack FG, Pressman BD. Dual-surface-coil MR imaging of bilateral temporomandibular joints: improvements in the imaging protocol.
AJNR 1989; 10:595-598
40. Walter E, Huls A, Schmelzle R, Kuper K, Kalender WA. CT and MR imaging of the temporomandibular joint: Radiographies 1988;8: 327-348
41. Westesson P-L, Katzberg RW, Tallents RH, Sanchez-Woodworth RE, Svensson SA, Espeland MA. Temporomandibular joint: comparison of MR images with cryosectional anatomy. Radiology 1987;164:59 42. Wilk RM, Harms SE. Temporomandibular joint: multislab, thr
ee-dimensional Fourier transformation MR imaging. Radiology 1988;
167:861-863
43. Wilk RM, Harms SE, Wolford LM. Magnetic resonance imaging of the
tempormandibular joint using a surface coil. J Oral .Maxillofac Surg
1986;44:935-943
44. Wright SM, Wright RM. Bilateral MR imaging with switched mutually