Many animal organ systems possess a functional capacity that is 1–10 times the average load placed upon them by normal physiological demands (Alexander, 1981; Weibel et al. 1991). This multiple of average load is often referred to as a safety factor. The advantage of maintaining a large safety factor is that the excess or spare capacity can be used in periods when demands on the system increase. The disadvantage of maintaining a substantial safety factor is presumably related to the costs of maintaining and operating excess tissue in times when that tissue is not operating at full capacity.
A better understanding of how and why animals maintain specific safety factors might be gained by examining the safety factors of specific organs by themselves; however, these organs often operate in concert with other organs or organ systems. Thus, it is often not clear whether a large safety factor in one organ is important for cooperating with other organs that may also have increased metabolic demands or whether that organ alone is responsible for maintaining whole-body physiological output. For example, in mice maintained at room temperature, the small intestinal capacity for nutrient uptake is 3–5 times the physiological load placed upon it by the average daily
intake of nutrients (Hammond et al. 1994). When mice increase their sustained metabolic rate (SusMR) in response to cold acclimation and/or lactation, however, food intake (nutrient load) increases by up to five times over control values, the mass of the small intestine increases by up to three times and total small intestinal uptake capacity increases by up to 1.5 times (Hammond et al. 1994). Thus, the safety factor is diminished from 3–5 to approximately 1. In these mice, the exhaustion of the small intestinal safety factor for glucose is coincident with the highest measured SusMR for cold and lactation. These data have shown that small intestinal size and capacity are highly responsive to changes in energy input or assimilation (e.g. Hammond et al. 1994). In addition, other organs such as the kidney also increase in mass with elevated energy demands in white mice (Toloza et al. 1991; Hammond and Diamond, 1992, 1997; Konarzewski and Diamond, 1994; Hammond et al. 1994), raising the question of whether their functional capacity is similarly matched to changes in energy input or energy assimilation at high energy demands. While there has been a correlation between small intestine mass and whole-organ functional capacity for nutrient uptake under
JEB1492
In endothermic vertebrates, long-term increases in metabolic energy demand are often associated with increases in food intake and accompanied by increases in organ mass. Wide-scale increases in organ mass have often been attributed to a metabolic response to increased energy intake and utilization. On a constant diet, however, increased food intake is also associated with increased protein intake. We hypothesized that, while increased food intake itself may be responsible for increases in digestive tract mass, the consequent increased protein intake would be the factor responsible for increased kidney mass and function. Thus, we exposed male and female mice to diets differing in protein level (7 %, 15 % or 46 % casein by mass) at different acclimation temperatures (5 °C or 23 °C). Within an acclimation temperature, food intake rate remained constant over the entire range of dietary protein level, and protein intake rate increased as dietary content increased. The mice in the cold-acclimation group
increased food intake rate by 48–120 % over those in the warm-acclimation group. Liver, kidney and stomach mass increased with protein intake rate, while digestive tract and other vital organ masses increased only in response to increased energy intake rate. Blood urea nitrogen levels increased with protein intake rate. Glomerular filtration rates increased with increases in dietary protein level in male mice but not female mice. Finally nitrogen filtration rate increased with protein intake rate for mice on the high-protein diet. We suggest that it is primarily the increased protein intake rate rather than the increased food intake rate that results in the changes in kidney and liver mass and kidney function observed to occur in situations of high energy demand.
Key words: kidney, protein intake, organ mass, nitrogen filtration rate, mouse.
Summary
Introduction
THE EFFECTS OF INCREASED PROTEIN INTAKE ON KIDNEY SIZE AND
FUNCTION
KIMBERLY A. HAMMOND* ANDDONALD N. JANES
Department of Biology, University of California, Riverside, CA 92521, USA *e-mail: [email protected]
some circumstances, it is not clear that there is a direct relationship between mass and functional capacity for other organs or organ systems.
The kidney is one of the most energetically demanding organs in a mammalian body (Krebs, 1950; Martin and Fuhrman, 1955). On a mass-specific basis, the rate of oxygen consumption of the kidney in mice at room temperature is between 1.5 and 20 times that of other organs (Martin and Fuhrman, 1955). Increases in kidney mass coinciding with increased SusMR are particularly dramatic. Konarzewski and Diamond (1994) found that, when ambient temperature was gradually decreased from 23 °C to −15 °C, mice increased their food intake, increased the mass of the digestive system and increased kidney wet mass by 70 %. There may be a greater energy or functional ‘tax’ on the kidney in animals living at such cold temperatures associated with the removal of metabolic waste products that result from higher levels of metabolic output. The kidney has two primary functions: waste excretion and water regulation. Because the mice in the Konarzewski and Diamond (1994) study were not water-stressed, it is reasonable to suggest that waste excretion requirements increase with elevated SusMR as the functional capacity of the kidney to remove these waste products from the body increases.
One of the waste compounds excreted by the kidney is urea, a waste product of protein metabolism. In most studies of temperature-related (i.e. energy-demand-related) organ hypertrophy, the diets used have had similar protein contents for animals at each experimental temperature (Toloza et al. 1991; Hammond and Diamond, 1992; Konarzewski and Diamond, 1994). Thus, an elevated SusMR causes an increased food intake to meet energy needs, which causes a concomitantly increased protein intake. Increased protein intake is known to cause renal hypertrophy and an increase in glomerular filtration rate (GFR; Klahr, 1989), so we hypothesized that the increased kidney mass associated with increased SusMRs may be a result of the increased protein intake rate itself rather than a by-product of the high rate of energy assimilation resulting from the metabolic processes (i.e. thermogenesis or milk production) associated with those high energy demands. To test this hypothesis, we acclimated mice to two different temperatures and fed them three diets with different protein levels to determine the comparative effects of elevated SusMR and protein intake on kidney size and function. We chose two estimates of kidney function or capacity. First, we used GFR because it is an indication of the rate at which the kidney is filtering plasma and, as stated above, increases with kidney hypertrophy. As an estimate of the kidneys’ accommodation to increased protein intake, we used blood urea nitrogen level (BUN). The level of urea in the blood, under steady-state conditions, should remain relatively constant. If BUN rises, it is an indication that the relative amount of circulating nitrogen or urea has changed, and changes in BUN may be correlated with changes in kidney mass. An increase in urea production, however, may not have negative metabolic effects if urea or nitrogen filtration rate has
also increased to remove the excess nitrogen from the blood. Therefore, the final estimate of kidney function we made was nitrogen filtration rate, which is the product of GFR and BUN.
Materials and methods
Thirty male and thirty female virgin Swiss-Webster laboratory mice Mus musculus L. (Charles Rivers Laboratories, Wilmington, MA, USA), 70–90 days old, were divided into three groups on the basis of dietary protein level (7 %, 15 % or 46 % casein by mass; Table 1). Within each protein treatment, mice were further divided into two acclimation-temperature treatments (23 °C or 5 °C; hereafter referred to as warm and cold acclimation, respectively). There were a total of six treatment groups. Each group contained five male and five female mice. The different protein diets were isocaloric to each other with carbohydrate (sucrose) used to balance protein (ICN Biochemicals). All mice were initially maintained on their respective diets and housed at 23 °C. After 1 week, half the mice were moved to a cold room at 5 °C for 2 weeks and maintained on the same diets. Body mass, food intake rate I (g day−1) and fecal output rate O (g day−1) were measured on each of the last 3 days of the 2 week period, and digestibility was calculated as follows:
digestibility = [(I−O)/I] × 100 . (1) At the end of the 2 week temperature-acclimation period, glomerular filtration rate was measured in each mouse using a single-injection technique (Stacy and Thorburn, 1966) as follows. An initial 10µl blood sample was taken from a leg vein, after which approximately 5 MBq of 51Cr-labelled EDTA in 0.3 ml of sterile Ringer’s solution was injected intraperitoneally. Subsequent blood samples (5–20µl) were taken from leg veins 10, 20, 40, 60, 80, 100 and 120 min after the injection of isotope. Blood was centrifuged at 1200 g for 5 min, the hematocrit measured, and the radioactivity of a known volume of plasma (2–10µl) counted in a Beckman LS 6500 scintillation counter. Linear regressions of loge(cts min−ml−1) versus time were calculated, and the slope b (h−1) and y-intercept a (Bq ml−1) were used to calculate GFR (ml h−1):
[image:2.609.311.562.84.216.2]GFR = (R×b)/loge−1a , (2) Table 1. Dietary constituents of test diets
7 % 15 % 46 %
protein protein protein
Carbohydrate (sucrose) (%) 63.1 55.0 24.0
Fat (cottonseed oil) (%) 7 7 7
Protein (purified high 6.9 15 46
nitrogen casein) (%)
Fiber (Alphacel, non- 17 16 17
nutritive bulk) (%)
Salt mixture (%) 4 4 4
Brewer’s yeast (%) 2 2 2
where R is the amount (Bq) of the radioactive isotope injected. After completion of GFR measurements, mice were killed by intraperitoneal injection of an overdose of sodium pentobarbitol (100 mg kg−1), and 200µl of blood was collected from the infraorbital sinus for measurement of blood urea nitrogen level (BUN). The stomach, small intestine, large intestine, cecum, spleen, liver, kidneys, heart and lungs were removed. The small intestine was gently flushed with Ringer’s solution using a gavage needle, and the stomach, cecum and large intestine were cut open and also flushed with Ringer’s solution. Organs were briefly blotted on a paper towel, weighed to the nearest 0.1 mg, dried to constant mass at 50 °C, and re-weighed. Blood was centrifuged at 1200 g for 5 min, and BUN was measured in triplicate using a colorimetric assay (Sigma Kit no. 535-A). Finally, GFR was converted to a daily rate multiplied by BUN to calculate the daily nitrogen filtration rate of the kidney.
Statistics
Our data consist of two independent variables (acclimation temperature and dietary protein level) and many dependent variables (food intake rate, digestive efficiency, body mass, kidney, gut and other organ masses, blood urea nitrogen level and glomerular filtration rate). As originally designed, we used a 2×2×3 three-factor analysis of variance (ANOVA) (two levels of sex, two levels of acclimation temperature and three levels of dietary protein level) to test for significant effects of acclimation temperature and protein content and their interaction. This ANOVA revealed that there were significant differences between males and females in many variables so, for further analysis, we separated the sexes. In addition, within each sex, there was a 35–50 % range in individual body masses. Therefore, we used body mass as a covariate for each sex. In most cases, body mass was not a significant covariate; when body mass was a significant covariate for a particular variable, it did not cause a qualitative difference in the results. Therefore, the data presented here are for a 2×3 two-way ANOVA for each sex. Unless stated otherwise, the F and P values cited throughout the text are from these two-way ANOVAs. Treatment and error degrees of freedom are used as subscripts for each F value (denominator degrees of freedom are between 22 and 29 because some measurements were missing for some individual mice).
For each sex, we routinely tested nine a priori pairwise comparisons (all orthogonal) in addition to the main effects of acclimation temperature and dietary protein level. Those nine comparisons were the following: within each acclimation temperature, between the three dietary protein levels (or six in all), and between the two acclimation temperatures for each dietary protein level (three in all). We tested these a priori differences using arithmetic means (SAS Institute, 1985). Individual a priori pairwise means comparisons are made by reporting the ad hoc t-statistics corresponding to the two-tailed
P values. In these comparisons, we used the root mean square
(corrected for the sample sizes of the two means in question) as the denominator for the total ANOVA model so the
comparison is made in the context of the ANOVA model itself (SAS Institute, 1991).
Values are presented as means ±S.E.M.
Results
There were statistically significant differences in body mass between males and females across all treatment groups (males 36.3±0.5 g, females 31.4±0.5g; F1,48=47.83, P=0.0001). The three-factor ANOVA showed significant differences between males and females for all data except digestibility, so data for the two sexes will be considered separately. For both males and females, body mass did not differ between experimental groups, so all data are presented without correction for body mass.
Food intake rate and digestibility
For males and females, food intake rate (g day−1) in the cold-treatment group was 48 % and 120 % higher, respectively, than in the warm-acclimation group (F1,24=189 for males and
F1,24=202.8 for females, P<0.0001; Table 2), but did not differ between protein levels. Despite the fact that food intake rate was higher at colder temperatures, there was no difference in digestibility between different acclimation temperatures or between different protein groups (76.6±0.46 %).
Protein intake rate increased in the cold-acclimated animals that ate more food. Because the protein level of the diets varied between 7 and 46 %, animals in the high-protein groups ingested more protein, despite the fact that all groups within an acclimation-temperature treatment had similar food intake rates (Table 2).
Internal organ size Vital organs
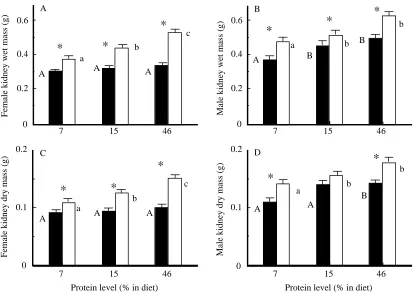
Kidney wet mass increased significantly with acclimation to both cold temperature and increased dietary protein level (Fig. 1A,B). The acclimation-temperature-induced increase in kidney mass was larger for females (37 %; F1,29=13, P<0.0001) than for males (22 %; F1,29=42.3, P=0.0001). Kidney wet mass increased by 26–32 % with acclimation to high dietary protein levels (F2,29=27.7 for males and F2,29=25.4 for females,
P<0.0002). In females, there was a statistically significant
interaction between acclimation temperature and dietary protein level (F2,29=10.9, P=0.0004) for kidney wet mass because all of the increase in size due to increased dietary protein level and intake rate occurred only in the cold-acclimated group. For males, dietary protein level affected the size of both cold- and warm-acclimated mice similarly.
In both males and females, liver wet and dry mass responded to both high-protein diets and to low acclimation temperature (Table 3), but the pattern of the response was different between the sexes. In general, acclimation to high-protein diets increased liver size in cold-acclimated females only (not in acclimated females), but in both cold- and warm-acclimated males.
Acclimation to cold temperatures caused an increase of
10–39 % in female liver wet mass (F1,29=37, P<0.0001) and of 14–36 % in liver dry mass (F1,29=45.6, P<0.0001). The significant increase in liver mass for cold-acclimated females was driven by 17 and 20 % increases in liver dry and wet mass, respectively, in animals eating the highest protein level diet (dry mass, F2,29=6.6, P=0.005; wet mass, F2,29=4.8, P=0.018). For males, acclimation to cold temperatures caused a significant increase in liver wet mass over that in warm-Table 2. Mean daily food and protein intake rates of male and female mice acclimated to either 5 °C or 23 °C and fed a diet with
one of three different protein levels
Females Males
5 °C 23 °C 5 °C 23 °C
7 % 15 % 46 % 7 % 15 % 46 % 7 % 15 % 46 % 7 % 15 % 46 %
Food intake rate (g day−1) 8.03* 8.00* 8.04* 3.82 3.77 3.34 7.91* 8.56* 8.33* 4.40 3.94 4.26
(0.39) (0.36) (0.58) (0.27) (0.30) (0.27) (0.35) (0.51) (0.35) (0.44) (0.14) (0.62)
Protein intake rate (g day−1) 0.55a,* 1.21b,* 3.70c,* 0.26A 0.57A 1.53B 0.55a,* 1.28b,* 3.83c,* 0.31A,* 0.59B,* 1.96C,*
(0.027) (0.054) (0.027) (0.018) (0.045) (0.012) (0.024) (0.077) (0.016) (0.03) (0.021) (0.012)
Within a sex and temperature, letters that are different indicate statistically significant differences between means. Mice acclimated to 5 °C have lowercase letters and mice acclimated to 23 °C have uppercase letters.
Asterisks indicate statistically significant differences between cold- and warm-acclimated animals within a dietary protein level. Values are means with S.E.M. given in parentheses (N=5).
7 15 46
0 0.2 0.4 0.6
Female kidney wet mass (g)
7 15 46
0 0.2 0.4 0.6
7 15 46
0 0.1 0.2
Protein level (% in diet)
7 15 46
0 0.1 0.2
Protein level (% in diet)
A A A
a
b
c
a b
b
A B
B
A A A
a
b
c
*
*
*
*
*
*
*
*
*
*
*
A B
C D
A A
B
a b
b
Female kidney dry mass (g)
Male kidney wet mass (g)
[image:4.609.41.561.98.201.2]Male kidney dry mass (g)
[image:4.609.91.506.272.567.2]acclimated males; however, means separation tests did not show that the increased liver mass was significant in the cold-acclimated mice at any one level of protein intake rate (wet mass, F1,29=7.3, P=0.013; dry mass, F1,29=3.9, P=0.06). Liver size (wet and dry mass) of both cold- and warm-acclimated males increased with dietary protein level (wet mass,
F2,29=4.4, P=0.024; dry mass, F2,29=5.9, P=0.009).
Heart mass remained largely the same in the face of increased dietary protein intake rate, but for both males and females it did increase with acclimation to cold temperatures (Table 3). For females, the cold-acclimation increases in heart mass were 22–38 % and 23–33 % for wet and dry mass, respectively (wet mass, F1,29=26.8, P<0.0001; dry mass,
F1,29=25.3, P<0.0001). For males, the cold-acclimation
increases in heart mass were 10–34 % and 12–35 % for wet and dry mass, respectively (wet mass, F1,29=14.9, P=0.0008; dry mass, F1,29=15, P=0.0007).
Finally, lung mass also remained the same in the face of increased dietary protein intake rate, but lung wet mass increased by 10–26 % for both males and females acclimated to cold temperatures (males, F1,29=19.5, P=0.0002; females,
F1,29=17.4, P=0.0003).
Digestive tract organ size
[image:5.609.49.566.85.499.2]Table 3 contains the data for most organ masses including the digestive tract. There is a general tendency towards an increase in organ mass with decreased acclimation temperature and no change in organ mass with dietary protein level. The Table 3. Mean body and organ masses for female and male mice acclimated to either 5 °C or 23 °C
Females Males
5 °C 23 °C 5 °C 23 °C
Measured variable 7 % 15 % 46 % 7 % 15 % 46 % 7 % 15 % 46 % 7 % 15 % 46 %
Body mass (g) 33.34 29.36 30.60 33.30 30.03 31.90 35.47 36.79 34.90 34.70 38.61 37.16
(0.79) (0.22) (0.49) (2.23) (0.96) (1.24) (1.58) (0.96) (0.61) (0.81) (1.92) (1.10)
Small intestine wet mass (g) 1.812 1.923* 1.966* 1.696 1.469 1.619 1.810 1.892* 1.897 1.596 1.548 1.683 (0.045) (0.044) (0.040) (0.095) (0.076) (0.047) (0.082) (0.071) (0.084) (0.085) (0.056) (0.104)
Small intestine dry mass (g) 0.397* 0.347* 0.392* 0.327 0.277 0.340 0.369 0.392 0.388 0.347 0.347 0.390 (0.023) (0.006) (0.011) (0.017) (0.017) (0.009) (0.022) (0.011) (0.019) (0.012) (0.029) (0.021)
Stomach wet mass (g) 0.206a 0.205a 0.259b,* 0.196A 0.175A 0.206A 0.199a 0.218a,b 0.249b 0.189A 0.199A 0.222A (0.013) (0.006) (0.014) (0.020) (0.007) (0.010) (0.012) (0.020) (0.009) (0.008) (0.010) (0.008)
Stomach dry mass (g) 0.054 0.050 0.059 0.054 0.046 0.056 0.050 0.060 0.062 0.050 0.055 0.058
(0.005) (0.002) (0.003) (0.005) (0.002) (0.003) (0.002) (0.005) (0.004) (0.003) (0.004) (0.002)
Cecum wet mass (g) 0.114 0.107* 0.120* 0.105 0.088 0.098 0.113 0.121 0.146* 0.095 0.118 0.096
(0.011) (0.003) (0.002) (0.008) (0.008) (0.005) (0.011) (0.011) (0.014) (0.009) (0.016) (0.007)
Cecum dry mass (g) 0.030 0.026 0.026 0.030 0.024 0.028 0.029 0.033 0.031 0.026 0.035 0.028
(0.002) (0.001) (0.002) (0.003) (0.003) (0.001) (0.003) (0.002) (0.002) (0.003) (0.004) (0.003)
Large intestine wet mass (g) 0.261 0.250* 0.299* 0.244 0.203 0.213 0.257 0.273 0.318* 0.244 0.245 0.222 (0.014) (0.013) (0.014) (0.022) (0.008) (0.012) (0.010) (0.016) (0.014) (0.013) (0.012) (0.009)
Large intestine dry mass (g) 0.079 0.069 0.082 0.075 0.065 0.070 0.077 0.090 0.090 0.083 0.087 0.072
(0.004) (0.004) (0.004) (0.007) (0.004) (0.005) (0.001) (0.008) (0.004) (0.005) (0.009) (0.004)
Liver wet mass (g) 1.626a 1.569a,* 1.917b* 1.474A 1.336A 1.375A 1.723a,* 1.738a,b,* 1.980b 1.478A 1.631A,B 1.741B (0.031) (0.055) (0.086) (0.088) (0.055) (0.031) (0.103) (0.086) (0.087) (0.107) (0.027) (0.101)
Liver dry mass (g) 0.515a,* 0.474a,* 0.581b,* 0.450A 0.411A 0.427A 0.505a 0.533a,b 0.596b 0.456A 0.519A,B 0.537B (0.012) (0.015) (0.021) (0.024) (0.017) (0.008) (0.032) (0.023) (0.015) (0.036) (0.010) (0.025)
Heart wet mass (g) 0.187* 0.183* 0.214* 0.154 0.139 0.154 0.213* 0.215* 0.195 0.140 0.169 0.178
(0.008) (0.007) (0.011) (0.009) (0.008) (0.017) (0.020) (0.015) (0.008) (0.006) (0.017) (0.016)
Heart dry mass (g) 0.047* 0.046* 0.054* 0.038 0.036 0.041 0.055* 0.054* 0.050 0.036 0.043 0.046
(0.002) (0.002) (0.002) (0.002) (0.002) (0.004) (0.005) (0.004) (0.002) (0.001) (0.003) (0.005)
Lung wet mass (g) 0.221 0.215* 0.215* 0.200 0.177 0.171 0.224 0.221* 0.224* 0.202 0.176 0.181
(0.007) (0.014) (0.007) (0.014) (0.005) (0.010) (0.015) (0.008) (0.012) (0.009) (0.008) (0.003)
Lung dry mass (g) 0.053 0.051* 0.051* 0.050 0.045 0.043 0.057* 0.057* 0.052* 0.050 0.049 0.045
(0.003) (0.003) (0.002) (0.006) (0.001) (0.002) (0.006) (0.004) (0.003) (0.003) (0.003) (0.001)
Within a sex and temperature, letters that are different indicate statistically significant differences between means. Mice acclimated to 5 °C have lowercase letters and mice acclimated to 23 °C have uppercase letters.
exception for changes with dietary protein level is for stomach mass (discussed below).
In females, all compartments of the digestive tract (stomach, small intestine, cecum and large intestine) showed a tendency towards increased mass with cold acclimation. This increase was not significant, however, at every dietary protein level in any organ. Stomach mass increased by 16 % in cold-acclimated females, but this was significant only at a dietary protein level of 46 % (F1,29=9.2, P=0.006). Female small intestine, cecum and large intestine wet mass increased on average by 17–23 % with cold acclimation. These differences were statistically significant for the 15 % and 46 % but not for the 7 % dietary protein level groups (small intestine, F1,29=37, P<0.0001; cecum, F1,29=8.7, P=0.007; large intestine, F1,29=18.1,
P=0.0003).
Small intestine dry mass was on average 20 % greater in females acclimated to cold temperatures (F1,29=27.4,
P<0.0001). This was true for all levels of dietary protein level.
For the other parts of the female digestive tract (stomach, cecum and large intestine), there was no significant increase in dry mass with acclimation to cold temperatures.
Males responded to cold-temperature acclimation similarly to females, but with less dramatic changes. There was no significant difference in male stomach wet mass in response to cold acclimation temperature (F1,29=3.7,
P=0.07). As for females, small intestine wet mass increased
by an average of 16 % in cold-acclimated animals (F1,29=15,
P=0.0007), but this difference was significant only at a
dietary protein level of 15 %. Cecum and large intestine wet masses also increased with cold acclimation by 19–23 % (cecum, F1,29=5.9, P=0.02; large intestine, F1,29=5.9,
P=0.0001), but this difference was significant only at a
dietary protein level of 46 %. Cold acclimation did not cause a significant difference in dry mass in any component of the male digestive tract.
The only component of the digestive tract that was affected by dietary protein level was the stomach. For both males and females, stomach wet mass increased by 21–35 % in cold-acclimated animals exposed to the highest (46 %) dietary protein level (females, F2.29=6.2, P=0.007; males, F2,29=6.3,
P=0.006). Stomach dry mass did not change in response to
different levels of dietary protein for either sex.
7 15 46
0 20 40 60
Female GFR (ml h
1)
7 15 46
0 20 40 60
a a
b
A A
B
7 15 46
0 4 8 12
a
a
b
A A
B
7 15 46
0 4 8 12
a a
b
A
B
B
7 15 46
0 0.1 0.2 0.3 0.4
Protein level (% in diet)
A A
A
a a
b
7 15 46
0 0.1 0.2 0.3 0.4
Protein level (% in diet) A
A
B
a a
b
A B
C D
E F
Male GFR (ml h
1)
Female BUN
(mmol ml
1 plasma)
Male BUN
(mmol ml
1 plasma)
Female NFR (g day
1)
Male NFR (g day
[image:6.609.201.556.345.731.2]1) Fig. 2. Glomerular filtration rate
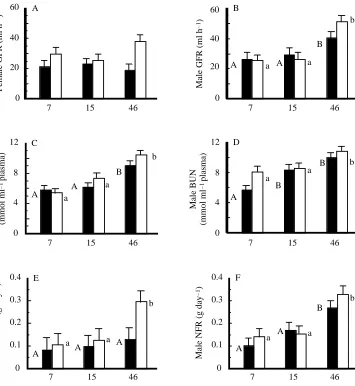
Estimates of kidney function
All plots of glomerular filtration rate (GFR) were highly linear (regression coefficients, r2, values ranging between 98.5 and 99.6 %). The only significant differences between the lines were for the values of the slope, which is used in the estimate of GFR.
For females, GFR did not differ among experimental groups (25.8±2.1 ml h−1, Fig. 2A). Blood urea nitrogen level (BUN) was 43 and 74 % higher in the high-protein group than in the medium- and low-protein groups (F2,23=17.1, P<0.0001, Fig. 2C), but did not differ between acclimation-temperature groups. Nitrogen filtration rate (g day−1) was 104 % higher in mice fed the highest protein diet than in the other two groups (F2,22=3.58, P<0.04; Fig. 2E).
Male GFR was approximately 69 % higher in the high-protein group than in the other two high-protein groups (F2,22=10.1,
P=0.0008; Fig. 2B), but did not differ between
acclimation-temperature groups. Male BUN was 22 and 50 % higher in the high-protein group than in the medium- and low-protein groups (F2,23=11.3, P=0.0004; Fig. 2D), but did not differ between acclimation-temperature groups (P=0.072). As for females, nitrogen filtration rate was 111 % higher in the mice fed the highest protein diet than in the other two protein groups (F2,21=17.13, P<0.0001; Fig. 2F).
Discussion
The primary goal of this study was to determine whether elevated protein intakes have different effects on kidney size and function from the high energy intakes and assimilation directly resulting from elevated SusMR. Although both SusMR and protein intake rate have been shown to affect kidney mass and function (Toloza et al. 1991; Hammond and Diamond, 1992; Konarzewski and Diamond, 1994; Hammond et al. 1994; Klahr, 1989), the two factors have not been investigated independently.
The food intake rate we observed in cold-acclimated mice was approximately 48–120 % greater than that of warm-acclimated mice and did not vary among groups fed diets differing in protein level. Thus, the increased food intake rate of the cold-acclimated mice corresponded to their increased SusMR, and mice were eating to meet energy requirements rather than trying to regulate protein intake rate. As a result of the constant food intake rate across the protein treatment groups, protein intake rate was dramatically higher in the group fed a high-protein diet (Table 2). When food intake rate increased in cold-acclimated animals, protein intake rate also increased. The specific questions addressed in this study are: (1) does an increased protein intake rate resulting from increased energy challenges and higher food intake rates have an effect on kidney size and function, and (2) does the effect on kidney size occur independently of increases in size of the digestive tract and other vital organs?
Effects of protein intake on kidney size and function
Both cold acclimation temperature and high-protein intake
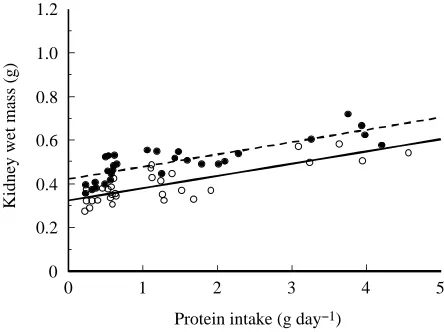
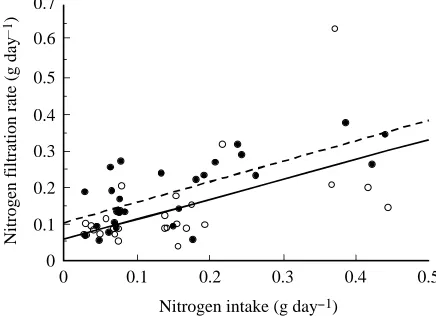
rates increase kidney size. Dietary protein level also has a strong effect on BUN and total daily nitrogen filtration rate. Dietary protein level has a smaller effect on GFR, although this effect is significant only in male mice (and see below). Clearly, the strongest effects on both size and function occur with a combination of high protein intake and cold acclimation temperatures when animals are forced to eat the largest amounts of protein and subsequently to cope with the nitrogenous waste products resulting from that protein load. The observation that increased protein intake rate causes kidney hypertrophy and increased function (GFR) has been made previously in other rodents (e.g. Murray et al. 1993; Trinh-Trang-Tan et al. 1993; Klahr, 1989), but not under circumstances where energy demand was increased far above normal levels. Kidney size (mass) increases linearly with protein intake rate such that protein intake rate explains between 65 and 66 % of the variation in kidney mass (Fig. 3). In addition, the total daily nitrogen filtration rate increases with dietary protein (nitrogen) intake (Fig. 4). Fig. 4 shows that the kidneys filter approximately 55 % of the nitrogen that the mice eat per day. The intercept on Fig. 4 is not expected to be zero for either males or females, because nitrogen filtration with no protein intake rate is not negligible; however, because the intercept is not zero, the actual daily nitrogen filtration rate is much higher than 55 %. Regardless of the actual percentage of dietary protein that is filtered, it is clear from Figs 3 and 4 that, even with increased BUNs, the kidneys have accommodated to the increasing nitrogen load placed on the system by the increased protein intake rate.
An additional factor to consider in the interpretation of these data is that the 7 % protein diet is close to being protein-deficient. Generally, rodents can be maintained on 4.5–6 % protein (National Research Council, 1995), so the mice on the low-protein diet were not protein-deficient. Another factor of concern is that, because fecal nitrogen losses are the same
0 1 2 3 4 5
0 0.2 0.4 0.6 0.8 1.0 1.2
Protein intake (g day 1)
Kidney wet mass (g)
Fig. 3. Relationship between kidney wet mass, Mk(g), and protein
intake rate, Ip (g day−1), in male (filled circles) and female (open
circles) white mice. The linear regression for males (broken line) is Mk=0.421+0.056Ip (r2=0.66, P<0.01). The linear regression for
[image:7.609.329.551.73.239.2]regardless of the percentage of protein in the diet, the low-protein diets may have a lower apparent low-protein digestibility than do the higher-protein diets (Robbins, 1993). Thus, the mice fed the 7 % protein diets may have had a lower relative nitrogen absorption rate than the mice on the 15 % protein diet; the slope in Fig. 4, showing 55 % filtration of dietary nitrogen intake, may be artificially low because the apparent protein digestibility of that diet is overestimated. The regressions in Fig. 4 assumes a 100 % protein digestibility. A more realistic assumption for protein digestibility on a 15 % protein diet of 95 % (Nutritional Research Council, 1995; Robbins, 1993) would increase the estimate of dietary nitrogen filtered from 55 to 58 %. If we assume an even lower protein digestibility of 90 % for the mice on the low-protein diet, the estimate for dietary nitrogen filtered increases to 60 %.
The difference between the response of males and females to high dietary protein level and, to a lesser extent, to cold acclimation is reflected by many of the data. Both absolute values of kidney mass and function and the patterns of change differ between the sexes. For instance, regardless of their relative organ masses, kidney mass of females at 23 °C did not increase with increasing protein level, whereas male kidney mass at both acclimation temperatures increased with increasing protein level (Fig. 1). Overall, however, the general trends of kidney mass and function measured by nitrogen filtration rate at high levels of dietary protein are the same between the two sexes.
Measurements of GFR were somewhat problematic for several reasons. First, females and males differed in their response to protein level: only males showed significant differences in GFR among the protein levels. Yang and Birkhahn (1993) have reported that after skeletal trauma female rats displayed less nitrogen loss and probably a lower body turnover of nitrogen than did male rats. From these
results, they suggest that the use of protein and subsequent nitrogen turnover is different between the sexes. If it is true that there are different sex-specific responses, then perhaps the differences we observed in GFR between males and females are to be expected. However, we cannot verify that hypothesis. Second, only at the highest protein level did male mice exhibit a significantly elevated GFR (Fig. 2). Pitts (1944) found that three different protein levels caused stepwise increases in GFR in dogs (61, 74 and 86 ml min−1for three diets with increasing protein levels). However, these results are from a single animal, and the actual protein levels of the diets were not reported. Third, although our GFR values were within the 95 % confidence limits of the value predicted by the allometric equation of Yokota et al. (1985), they were considerably higher than those measured in previous studies (cf. mean values of 29.3±1.67 ml h−1, N=58, for all the data in the present study and 12 ml h−1in Haines and Farmer, 1991). Our mean GFR values might be expected to be higher than those of other studies because the mice fed the high-protein diet and acclimated to cold temperatures had an extremely high protein intake rate, but even the GFRs of the mice fed the low-protein diet are relatively high. Because we do not know whether our overall high GFR values are an artifact of our measurement technique and because of the variability in measured GFR caused by different measurement techniques (all of which provide only estimates of the ‘true’ GFR), these results should be interpreted cautiously.
Independence of changes in kidney size and function
Finally, we turn our attention to our second question: are changes in kidney mass and function a result of increased whole-body sustainable metabolic output or of increased protein intake rate and nitrogen waste removal? Recall that our measured increase in protein intake rate does not result from an increase in food intake rate (Table 2). We did not find a protein-induced increase in the mass of any digestive organ except the stomach or in any other vital organ measured except the liver and kidney. In the liver, the same pattern of changes between males and females arises as in the kidney (as discussed above). Our data show that the size of the liver increases in a manner similar to that of the kidney. Because the production and excretion of urea are linked, it should not be unexpected that the masses of these two organs should change simultaneously with changes in dietary protein load. However, because the liver does not generally change in size with large-scale changes in food intake rate (Hammond et al. 1994; Konarzewski and Diamond, 1994), we did not expect this result. It is clear that increased protein intake rate affects kidney, liver and stomach mass differently from other organs, but it is not initially clear whether these changes are actually
independent of the anatomical and physiological changes that
occur in other organs, especially the small intestine. In order to determine whether these changes are independent, we compared data from two specific experimental groups.
Within a protein treatment group, food intake rate increased with cold acclimation (Table 2). Therefore, we still could not
0 0.1 0.2 0.3 0.4 0.5
0 0.1 0.2 0.3 0.4 0.5 0.6 0.7
Nitrogen intake (g day1)
Nitrogen filtration rate (g day
[image:8.609.55.273.76.234.2]1)
Fig. 4. Relationship between nitrogen intake rate, In (g day−1), and
nitrogen filtration rate, NFR, for male (filled circles) and female (open circles) white mice. The linear regression for males (broken line) is NFR=0.104+0.56In (r2=0.50, P=0.0001). The linear
regression for females (solid line) is NFR=0.056+0.55In (r2=0.33,
rule out the possibility that it was the increased protein intake rate that caused the increased kidney mass rather than just increased whole-body metabolic waste excretion resulting from increased metabolic activity associated with thermogenesis. To separate the effects of acclimation temperature and protein level, we compared kidney wet and dry mass, GFR, BUN and nitrogen filtration rates between two groups: 23 °C/15 % protein and 5 °C/7 % protein. These two groups had dissimilar metabolic demands (one cold-acclimated and one warm-acclimated) and food intake rates but almost identical protein intake rates (Table 4), enabling us to examine the effect of food intake rate (i.e. SusMR) without changing protein intake rate. Statistical comparisons between the two groups for each variable were made within the context of the whole experimental design by using the error mean square of the whole model in the denominator of a t-test (see Statistics section above). This comparison was made for males and females separately. In males, there were no differences in GFR, BUN, nitrogen filtration rate or kidney mass between the two groups, indicating that the changes in kidney mass and BUN were due to the increased protein intake rate and not to a generalized metabolic response to increased assimilation of energy or energy challenge
per se. In females, there were also no differences in GFR, BUN
or nitrogen filtration rate, but kidney mass was greater in the cold-acclimation group (wet mass increased by 18 %, P<0.05; dry mass increased by 17 %, P<0.01), indicating that some of the increases in kidney mass were due to increased metabolic energy assimilation and energy challenges.
On the basis of the results discussed above, it seems probable that, within the context of our experimental design, increased kidney function as estimated by BUN, GFR and nitrogen filtration rate is due largely to increased protein intake rate. For the kidney as a whole, it is clear that some of the short-term adaptation is due strictly to protein intake rate. Obviously, nitrogen filtration rate is only one of many measurements that are necessary to determine the functional output and capacity of the kidney. Therefore, measuring other organ-level variables, such as energy utilization (e.g. Na+/K+
-ATPase activity), may provide additional insights. Because we obtained different results for males and females, however, we still cannot separate the effects of increased metabolic output and increased protein intake rate on kidney size. In addition, there do appear to be sex-specific differences in adaptation to increased protein levels and increased metabolic demand that are more complex and dynamic than our experimental design could test. For instance, at medium to high levels of dietary protein, males have larger kidney masses and higher GFRs, BUNs and nitrogen filtration rates than females of similar size and with similar protein intake rates. This implies that variables such as hormonal balance and other sex-specific whole-body variables may have an impact on kidney (and other organ) function and capacity. Overall, we suggest that increased food intake rate comes with costs to the animal of the maintenance of energy-utilizing pathways and of other metabolic output pathways such as urea metabolism and metabolic waste excretion.
This finding is important for understanding the costs associated with the maintenance of high levels of SusMR. Ingestion of more food in response to high levels of energy demand does aid in meeting metabolic costs. It is apparent that increased food intake rate is easily accommodated by the digestive system in general (Hammond and Diamond, 1997), but there are also other costs associated with increased nutrient intake (here protein) that may be incurred in other organ systems such as the kidney. These costs are often, but not always, reflected in larger organ size, but may also be reflected in a loss of the functional reserve capacity of other organs. The significance of this ‘hidden’ loss in functional reserve capacity for animals in challenging situations deserves more attention.
[image:9.609.49.567.98.232.2]We thank Bronwyn McAllan for her assistance with the glomerular filtration method. We would like to thank Cathy Butchko for her tireless help in this project and Vaughan Shoemaker for his valuable insight and discussion of the manuscript. This project was supported by NIH award HD30745-05 to K.A.H. and Jared Diamond.
Table 4. Comparisons of measurements of kidney size and function between animals with dissimilar food intake rate and energy
demands, but almost identical protein intakes
Females Males
23 °C 5 °C 23 °C 5 °C
Measured variable 15 % 7 % P 15 % 7 % P
Food intake rate (g day−1) 3.77±0.30 8.03±0.39 0.0001 3.94±0.14 7.91±0.35 0.0001
Protein intake (g day−1) 0.566±0.045 0.554±0.027 NS 0.592±0.021 0.546±0.024 NS
Kidney wet mass (g) 0.3350±0.0084 0.3850±0.0121 0.0143 0.4886±0.0272 0.4650±0.0128 NS Kidney dry mass (g) 0.0944±0.0036 0.1090±0.0024 0.0081 0.1417±0.0078 0.1412±0.0080 NS
BUN (mmol l−1plasma) 6.26±0.84 5.87±0.75 NS 8.42±0.71 8.12±0.75 NS
GFR (ml h−1) 23.3±6.1 29.4±3.4 NS 29.8±2.2 25.4±4.1 NS
Nitrogen filtration rate 0.102±0.045 0.106±0.051 NS 0.173±0.029 0.142±0.029 NS (g day−1)
References
ALEXANDER, R. MCN. (1981). Factors of safety in the structure of
animals. Sci. Prog. Oxf. 67, 109–130.
HAINES, H. ANDFARMER, J. N. (1991). Glomerular filtration rate and plasma solutes in BALB/c mice infected with Plasmodium berghei. Parasitol. Res. 77, 411–414.
HAMMOND, K. A. ANDDIAMOND, J. M. (1992). An experimental test for a ceiling on sustained metabolic rate in lactating mice. Physiol. Zool. 65, 952–977.
HAMMOND, K. A. ANDDIAMOND, J. (1997). Maximal sustained energy budgets in humans and animals. Nature 386, 457–462.
HAMMOND, K. A., KONARZEWSKI, M., TORRES, R. ANDDIAMOND, J. (1994). Metabolic ceilings under a combination of peak energy demands. Physiol. Zool. 68, 1479–1506.
KLAHR, S. (1989). Effects of protein intake on the progression of renal disease. A. Rev. Nutr. 9, 87–108.
KONARZEWSKI, M. ANDDIAMOND, J. (1994). Peak sustained metabolic rate and its individual variation in cold-stressed mice. Physiol. Zool. 67, 1186–1212.
KREBS, H. A. (1950). Body size and tissue respiration. Biochim. biophys. Acta 4, 249–269.
MARTIN, A. W. ANDFUHRMAN, F. A. (1955). The relationship between
summated tissue respiration and metabolic rate in the mouse and dog. Physiol. Zool. 28, 18–34.
MURRAY, B. M., CAMPOS, S. P., SCHOENLM, M. ANDMACGILLIVRAY,
M. H. (1993). Effects of dietary protein intake on renal growth: possible role of insulin-like growth factor-I. J. Lab. clin. Med. 122, 677–685.
NATIONAL RESEARCH COUNCIL (1995). Nutrient Requirements of
Laboratory Animals, 4th edition. Washington, DC: National Academy Press.
PITTS, R. F. (1944). The effects of infusing glycine and of varying the
dietary protein intake on renal hemodynamics in the dog. Am. J. Physiol. 142, 355–365.
ROBBINS, C. T. (1993). Wildlife Feeding and Nutrition, 2nd edition. San Diego, CA: Academic Press.
SASINSTITUTE(1985). SAS/STAT User’s Guide, 5th edition. Cary, NC: SAS Institute.
SASINSTITUTE(1991). System for Linear Models, 3rd edition. Cary, NC: SAS Institute.
STACY, B. D. AND THORBURN, G. D. (1966). Chromium-51 ethylenediaminetetraacetate for estimation of glomerular filtration rate. Science 152, 1076–1077.
TOLOZA, E., LAM, M. ANDDIAMOND, J. (1991). Nutrient extraction by
cold-exposed mice: a test of digestive safety margin. Am. J. Physiol. 261, 608–620.
TRINH-TRANG-TAN, M. M., ANTRAS, J., LEVILLAIN, O. ANDBANKIR, L. (1993). Adaptation of the medullary thick ascending limb to dietary protein intake. Exp. Nephrol. 1, 158–167.
WEIBEL, E. R., TAYLOR, C. R. ANDHOPPELER, H. (1991). The concept of symmorphosis: a testable hypothesis of structure–function relationship. Proc. natn. Acad. Sci. U.S.A. 88, 10357–10361. YANG, Q. ANDBIRKHAHN, R. H. (1993). Metabolic rate and nitrogen
balance after skeletal trauma in female and male rats. Nutrition 9, 433–438.
YOKOTA, S. D., BENYAJATI, S. AND DANTZLER, W. H. (1985).