DIRECTIONAL SENSITIVITY OF MICROPHONIC
POTENTIALS FROM THE PERCH EAR
BY OLAV SAND
Institute of Zoophysiology, University of Oslo, Oslo, Norway
{Received 25 October 1973)
INTRODUCTION
The sacculus and lagena (pars inferior) form the part of the ear generally believed to be involved in hearing in teleosts (Dijkgraaf, 1950, 1952). Shearing movements of the sensory hairs are mediated by the existence of heavy otoliths in close contact with the maculae. Due to their larger density the otoliths will lag behind the motion of the hair cells when the fish is vibrated in a sound field. The unaided otolith/haircell system is therefore sensitive to the kinetic part of the sound (Chapman & Sand, 1974). However, fish possessing a gas-filled swimbladder may utilize this organ as a pressure/ displacement transformer, and such fish will respond to sound pressure, although the hair cells are still sensitive to particle motion. Evidence for an accessory role of the swimbladder in fish hearing generally, even in groups with no specialized association between the bladder and the ear, has recently been provided (Chapman & Hawkins, 1973; Sand & Enger, 1973; Chapman & Sand, 1974). The aspects offish hearing which will be considered in this paper are peripheral frequency analysis, directional hearing and the ability of re-radiated swimbladder pulsations to stimulate different parts of the ear.
It has been suggested that an auditory function of the swimbladder is contra-dictory to directional hearing in fish. Most fish have a single swimbladder, and since a single pressure receptor is insufficient to locate a sound source, fish would be unable to detect the direction of a pressure wave (van Bergeijk, 1964). Earlier behavioural studies supported this view (Reinhardt, 1935; von Frisch & Dijkgraaf, 1935), but these investigations were conducted in small tanks or at extremely shallow depth in the field. The acoustical conditions were therefore very complicated and difficult to predict (Parvulescu, 1964, 1967). However, directional responses could be elicited if the distance to the sound source was less than a few cm, but in these cases detection by cutaneous receptors was suggested. On the other hand, recent studies by Olsen (1969 a, b) on herring {Chtpea harengus) and cod {Gadus morkua) and by Schuijf, Baretta & Wildshutt (1972) on wrasse (Labrus bergyltd) were undertaken under free-field conditions in the sea, and clearly demonstrated that these species (which possess a swimbladder) can distinguish between different sound-source directions at a range of several metres. The herring was reported to detect differences in sound direction of less than 450 for frequencies from 20 to 6000 Hz, whereas the corresponding figure for wrasse at 115 Hz (the only frequency tested) was less than 70°, and possibly as good as io°. Chapman (1973), working on the cod, found that the masking of tone signals by white noise was reduced when the tone and noise were transmitted from different directions, thus confirming that even fish with a swimbladder may possess well-developed directional discrimination.
Sound pressure is a scalar quantity, while particle motion is a vector. Reception of the direction of a pressure wave therefore requires comparison of arrival time, in-tensity or phase between at least two pressure detectors. However, for a plane sound wave the particle displacement will be normal to the wave front, and a single kinetic vector detector is therefore sufficient to determine the sound direction. Each hair cell has an axis of maximal sensitivity (Flock & Wersall, 1962), and groups of hair cells with different orientation will thus constitute such a detector. By comparing the out-put from each group, the direction of the sound source could be determined directly. However, the amplified particle motions re-radiated from the swimbladder might mask the incident sound at the two ears, but this masking effect could be reduced by an arrangement of the haircells which made these insensitive to radial displacements emanating from the swimbladder. The maculae of the pars inferior are situated in an approximately vertical plane, and the orientation pattern of the saccular hair cells in the burbot {Lota lota) (Wersall, Flock & Lundquist, 1965) and the goldfish (Caras-sius auratus) (Hama, 1969) indicates maximal sensitivity for vertical displacements of the otolith. On the other hand, complex movements of the otoliths might be expected when a fish is vibrated linearly in a sound field, and the directional sensitivity of different parts of the fish ear can not easily be predicted from morphological data.
sound-Horizontal vibrator
Ball bearing
10 cm
/ n
C
4=
n »u ^
rtr-«fi
« o
U»UWJ
^
1rn \
v•—y—'
3 /Velocity transducer
Text-fig. 1. Drawing of the vibration table; lateral (A), frontal (B) and top side (C) view. See text for details.
induced swimbladder pulsations would produce, and this result therefore supports the theory of an auditory function of the swimbladder. However, in some cases the optimal sensitivity was obtained for other vibration directions, and the authors con-cluded that a possible explanation for the ability of fish to detect the direction of a sound source could be that different hair cells have different axes of maximal sensi-tivity to vibration.
The recording technique used by Enger et al. (1973) was rather crude, and the exact recording loci were not determined. The electrodes were coarse, and the activity of a large number of hair cells, probably including cells from both ears, was recorded simultaneously. Furthermore, the stimuli were restricted to horizontal vibrations only, whereas the fact that the natural surroundings of most fish is a three-dimensional medium makes it interesting to measure the sensitivity to vertical vibrations as well. The present investigation was thus undertaken to record microphonic potentials from different parts of the pars inferior in perch {Perca fluviatilis) as a function of vibrations in the horizontal and vertical plane. The stimulation technique used was developed from that described by Enger et al. (1973). The perch was chosen as experimental animal because of its rigid skull and skeleton, which facilitated the vibration of the fish, and because its limited auditory frequency range (Wolff, 1967) nearly coincided with the working range of the vibrating table.
MATERIALS AND METHODS Fish
Sacculus
Lagena
1 cm
Text-fig. 2. Sketch of the head of a 20 cm long perch with the dorsal part of the skull opened and the brain removed. Recordings were obtained from four electrode positions for each ear, as indicated by black and white dots for the right ear.
Basel), and thereafter clamped by five pairs of steel rods in a special Perspex holder. The first pair had a V-shaped incision which firmly held the skull just above the eyes. The structure of the fish holder is shown in Text-fig. 1.
40
2 20
u
•§ 10
= 8
CL
e 6
.1 4
90° 180° Vibration angle
270° 360°
Text-fig. 3. Vibration amplitude of the fish holder during horizontal vibrations of 70 Hi as a function of the angle between the long axis of the fish and the vibration direction. The measurements were obtained using three transducers. Two were sensitive in the horizontal plane, parallel to (#) and at right angles to (O) the long axis of the fish, while one was sensitive to vertical vibrations (A).
and posterior electrode positions, whereas only a mid position was used when record-ing from the lagena.
During the experiments water was run over the gills. Respiration and blood circula-tion of course ceased after the brain had been removed but the water flow kept the preparation cool. Microphonic potentials could be recorded for several hours without any marked decrease in amplitude.
Stimulation
A drawing of the vibration table is shown in Text-fig. 1. The table was mounted on a 50 x 40 x 2 cm slab of iron, and consisted of a 32 x 29 x 1-2 cm plate of aluminium which rested on adjustable (excentric) ball bearings. The fish holder was attached to a rotatable disc of aluminium, i-ocm thick and 26 cm in diameter, which was centred on the table. The disc was readily locked in any position, relative to the table. The table was vibrated either by a horizontal (Derritron, VP 2MM) or a vertical (Echonic, WA-3020) vibrator. During horizontal vibrations the angle between the fish and the direction of vibration was varied, whereas the position of the fish was fixed when it was vibrated vertically. The head of the fish was then just above the vertical vibrator, and the upper set of ball bearings was loosened. The vibrators were fed by amplified signals (20 W power amplifier, locally built) from a sine-wave oscillator (Heathkit, IG-82).
The movement of the table was measured by three velocity transducers (SM-2, Sensor, Netherlands) attached to the disc in three perpendicular directions, close to the head of the fish. One of the transducers was sensitive in the vertical direction,
whereas the other two were sensitive in the horizontal plane, along the long and short axes of the fish, respectively. The motion of the table was thus completely described. The vibration amplitude never exceeded 2 x io~* cm.
Signals from the transducers were fed into separate amplifiers (locally built) and voltmeters (Briiel & Kjaer, 2409) for amplification and measurement. Text-fig. 3 presents a set of vibration measurements at 70 Hz during horizontal vibration and rotation of a fish. The vibration velocity values (rms) are here, and throughout the paper, recalculated to displacement values. The ratio between the horizontal vibration component parallel to the driving force and the horizontal component normal to this was about 45, thus giving nearly linear horizontal movements. The ratio between the horizontal and vertical vibration was about 10.
The table showed rather similar behaviour up to about 200 Hz, above which frequency the ratio between horizontal and vertical vibrations dropped drastically. Below 30 Hz the vibrations became markedly distorted, and 30-250 Hz was thus the practical frequency range for the experiments involving rotation of the fish in the horizontal plane.
During vertical vibration of the table the ratio between vertical and horizontal vibrations was close to 10, but distortions here occurred below 100 Hz. Only 200 and
100 Hz were therefore tested in this type of experiments.
Recording of microphonic potentials
The electrode manipulator (Narishige, C-i) was fixed to the rotatable disc by a rigid bridge suspension (Text-fig. 1). Due to the low mass and the rigid suspension of the manipulator, the relative movement between the fish and electrode was probably very slight. The electrodes were NaCl-filled glass pipettes with tip diameters of 10—15/*. Microphonic potentials from the fish were amplified by a pre-amplifier (Tektronix, 122), displayed on an oscilloscope (Tektronix, RM 565) for photographing (Grass Kymograph Camera, C 4) and measured with a vacuum tube voltmeter (Briiel & Kjasr, 2409). Microphonic potentials in this paper are given in dB re 1 /iVrrns.
RESULTS
The microphonic potentials recorded from the pars inferior during vibration of the fish were twice the frequency of vibration, but the two peaks corresponding to one vibration cycle could be of different amplitude. To facilitate comparison between different recordings, the microphonic potentials were therefore measured by an integrating a.c. voltmeter. The amplitude of the potentials was a function of both the stimulus strength and the direction of vibration. Two types of experiments were conducted, namely measurement of relative vertical and horizontal sensitivity of the microphonic potentials for the different electrode positions, and recording of micro-phonic potentials evoked by horizontal vibration during horizontal rotation of the fish.
Ratio between vertical and horizontal sensitivity of the microphonic potentials
• 2-9 5-5 100
w w w w AAAAAAAA
20 tns I
Background 5.5 |0.0
o
AA/WWW
Text-fig. 4. Microphonic potentials (upper trace of each recording) obtained from the lagena during vertical and horizontal vibrations of 200 Hz (lower trace of each recording). The electrode position w u the same throughout the series, and the vibration amplitudes (cm x io~*) are indicated on the figure. Note that vertical vibrations were the most efficient in evoking microphonic potentials.
electrode position was the same for the two vibration modes. During the horizontal vibration the angle between the direction of vibration and the fish was chosen to be optimal for evoking microphonic potentials. It is seen that a much higher stimulus intensity was necessary for horizontal than for vertical vibrations to generate the same amplitude of the microphonic potentials.
In Text-fig. 5 these potentials are presented as a function of the vibration amplitude, and the displacement amplitude necessary to evoke microphonic potentials just above the electric background noise is taken as a measure of the microphonic sensitivity for the particular kind of vibration. The higher these threshold values are, the lower is the microphonic sensitivity. It is seen that for the case presented in Text-fig. 5, the microphonic sensitivity was about 5-8 times greater for vertical than for horizontal vibrations. Measurements of this type were performed on 5 lagenae for 100 and 200 Hz, and the average ratio between the vertical and horizontal microphonic sensitivity was 2 9 (S.D. = o-8) and 5-6 (s.D. = 1-9), respectively.
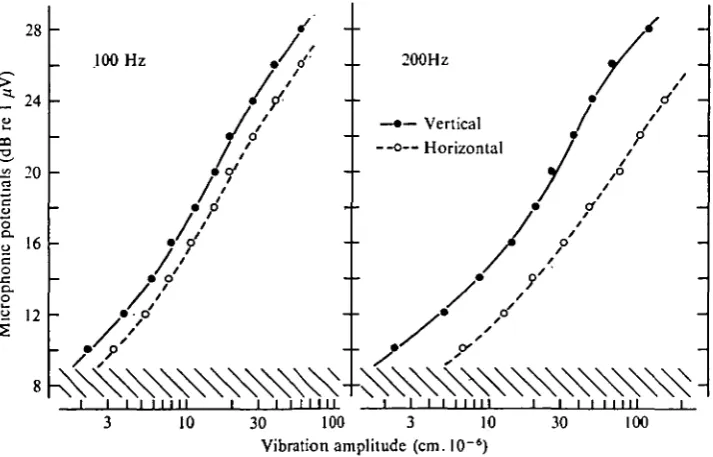
In contrast to this high microphonic sensitivity to vertical vibrations, which was obtained when recording from the lagena, the anterior part of the sacculus gave a different picture. This is seen from Text-figs. 4 and 6, which are based on directly comparable data from two different fish. Text-fig. 6 shows recordings of microphonic potentials for a fixed electrode position from the anterior part of the sacculus, and the microphonic sensitivity to vertical and horizontal vibrations was clearly rather similar. Text-fig. 7 gives the microphonic potentials evoked by the two different vibration modes as a function of the vibration amplitude, in a comparable way as in the example
28
24
20
o
CL 16
c o
o
12
8
-• — Vertical O-— Horizontal
*
o / / ,o
m
/
o o
3 10 30 100 Vibration amplitude (cm. 10"')
Text-fig. 5. Microphonic potentials from the lagena as a function of vibration amplitude. Recording locus is the same as in Text-fig. 4. Level of electric background noise is indicated by hatched area. Note that the horizontal vibration amplitude required to evoke microphonic potentials just above the electric background noise was 5-8 times greater than the corresponding vertical vibration amplitude.
from the lagena shown in Text-fig. 5. It is seen that the microphonic sensitivity was nearly identical for horizontal and vertical vibrations. Similar series of measurements were obtained from nine sacculi for 100 and 200 Hz, and the mean ratio between the microphonic sensitivity to vertical and horizontal vibrations was 1-2 (S.D. = 03) and 1-i (S.D. = 0-4), respectively.
04 1-5
/W\A/VW
4-6 Background
wwwv\
A / W W W
AAA/WW
20 msText-fig. 6. Microphonic potentials recorded from the anterior part of the sacculus during vertical and horizontal vibrations of 200 Hz. The recordings are directly comparable to those in Text-fig. 4. Note that the efficiency of horizontal and vertical vibrations in evoking micro-phonic potentials was about the same.
30
26 >.
a 22
I
18o o.
I 14
n. o
10
A*
—•— Vertical Jt —o— Horizontal /
/
1 3 10 30 Vibration amplitude (cm. IO~6)
100
890
100 Hz
OLAV SAND
200 Hz
AA/WVWW
Background
4-8
vwwww
I
20 ms
[image:10.451.51.408.367.595.2]Text-fig. 8. Recordings of microphonic potentials (upper trace of each recording) from the posterior part of the sacculus in response to vertical and horizontal vibrations (lower trace of each recording) of 100 and 200 Hz. The vibration amplitudes (cm x io~*) are indicated on the figure. The recordings are from the same electrode position. Note that the relative effect of horizontal and vertical vibrations is frequency dependent.
28
J2 20
o o.
a. o
16
.s 12
100 Hz
10 30 100 3 10 Vibration amplitude (cm. 10"')
30 100
•
I
I
Ant Mid Post Lag
X
s
'A
VA
Text-fig, io. Comparison of the mean ratios between the microphonic sensitivity to horizontal (hatched columns) and vertical (open columns) vibrations for the anterior (Ant) mid (Mid) and posterior (Post) parts of the sacculus, and for the lagena (Lag). The ratios are indicated by the relative heights of the columns within each pair. The figure does not give any information about differences in absolute sensitivity between the different parts of the ear.
vibrations, this difference in response grew considerably when the frequency was increased by one octave. Text-fig. 9 presents the microphonic potentials as a function of vibration amplitude for the two frequencies and stimulation modes. It is seen that for 100 Hz the ratio between horizontal and vertical vibration amplitudes giving a microphonic response just above the level of electrical background noise was about 1-5, whereas this ratio increased to 29 at 200 Hz.
Background
vAAAAA/ \AAAAA
Text-fig. 11. Microphonic potentials (upper traces) recorded from the anterior part of the sacculus on the right side during horizontal vibrations of 70 Hz (lower traces). The vibration amplitude was 3-0 x io~* cm. The angle between the long axis of the fish and the vibration direction is indicated on each recording. Note that the potentials were a function of the vibration direction.
Directional sensitivity of the microphonic potentials evoked by horizontal vibrations
For horizontal vibrations of constant amplitude the microphonic potentials were a function of the angle between the fish and the vibration direction. Text-fig. 11 presents a series of recordings from the anterior part of a sacculus from the right side during 70 Hz vibration. It is seen that variation of the vibration angle has a marked effect on the microphonic potentials. In this particular case maximal potentials were obtained at vibration angles around 200 and 2000, whereas the potentials reached minimum values at n o ° and 2900. The maximal microphonic potentials were about 12 dB above the minimum values. Similar recordings from the left sacculus gave a corresponding picture, but the optimal angles were here 3350 and 155°, whereas minimal potentials were evoked at angles of 650 and 245°. Text-fig. 12 presents the recordings from this fish in a polar coordinate diagram, which gives the amplitude of the microphonic potentials as a function of the horizontal vibration angle. As expected from Text-fig. 3, maximal microphonic potentials occurred at angles within rather wide sectors, and a sharp decline of the potentials was seen towards the angles giving minimum microphonic responses. The angle between the axis of optimal microphonic sensitivity for the right and left otoliths was 45 °, which approximates to the angle between the two otoliths.
Text-fig, ia. Polar diagram giving microphonic potentials recorded from the right (•) and left (O) sacculus as a function of the horizontal vibration angle. Same fish and recording conditions as in Text-fig. 11. Note that maximal microphonic responses are evoked by vibration directions deviating about 200 from the long axis of the fish.
As shown in the previous section, the lagena was predominantly sensitive to vertical vibrations. However, horizontal vibrations also evoked microphonic potentials, and these showed axes of optimal and minimal microphonic sensitivity in a similar way as shown for the sacculus. Only three complete series of measurements of this type were obtained from the lagena, and none of these showed an axis of optimal horizontal microphonic sensitivity which deviated more from the long axis of the fish than did the corresponding values from the sacculus.
DISCUSSION
A fish in water is acoustically nearly transparent, and in a sound field it will there-fore vibrate with the same phase and amplitude as the surrounding medium. Vibration of the fish in air will thus provide good simulation of the effect caused by water-borne sound. However, since the vibration stimuli have no pressure component, the pressure/ displacement transforming ability of the swimbladder will not be activated, and by changing the angle between the fish and the direction of vibration, well denned directional stimuli are readily obtained.
Auditory effect of vibrations radiating from the swimbladder
Due to the high compressibility of gas compared to water, the surface of a gas-filled swimbladder will undergo much larger displacements when exposed to sound than would the water particles in the absence of the bladder. In an unspecialized fish like the perch, which has no mechanical linkage between the swimbladder and the ear, these amplified displacements will reach the ear through the intervening body tissues. The swimbladder-induced vibrations stimulating the ear will therefore have a radial direction to the bladder. For all the recording loci the sacculus showed maximal horizontal sensitivity when it was vibrated approximately parallel to its own long axis. This axis has an orientation which ensure nearly optimal horizontal stimula-tion of the saccular macula by vibrastimula-tions radiating from the swimbladder (Text-fig. 12 and PI. 1, fig. 1).
horizontal vibrations, while responses from the posterior part were most easily evoked by vertical vibrations. If the orientation pattern of the saccular hair cells in burbot and goldfish is valid for perch, i.e. the hair cells are vertically oriented, the observed ability of horizontal vibrations to evoke saccular microphonic potentials needs an explanation. The movements of the otoliths are not necessarily linear when the fish is exposed to sound. Torques acting on the stone during the forced vibrations may arise from the unsymmetrical shape of the otolith in combination with its suspension and the surrounding liquid. The result will be rotational or rocking movements of the otolith, and a horizontal driving force may thus be translated into vertical otolith movements.
The present study showed that the lagena, and to a lesser degree the posterior part of the sacculus, were mainly sensitive to vertical vibrations, while the vibrations radiating from the swimbladder will have a nearly horizontal direction at the ear. For 200 Hz the lagena was measured to be 5-6 times, or 15 dB, more sensitive to vertical than to horizontal vibrations. However, since it was impossible to generate pure horizontal vibrations, this ratio may well be underestimated. At 100 Hz the measured ratio was 2-9 or 9 dB. The auditory gain due to the swimbladder effect is probably not more than 20 dB at 200 Hz, and the effect will decrease towards lower frequencies (Sand & Enger, 1973; Chapman & Sand, 1974). It is thus not unreasonable to suppose that the lagena is about equally affected by the incident and the re-radiated sound if the sound direction is vertical to the fish. This is in contrast to the anterior part of the sacullar macula, which seems to be mainly stimulated by swimbladder vibrations, whereas the incident sound has relatively little effect.
Mechanical frequency catalysis
According to the hypothesis described above, linear driving forces may be trans-lated into complicated rotational movements of the otoliths during vibration of the fish. For the lagena and the posterior part of the sacculus the ratio between vertical and horizontal sensitivity was noted to be frequency dependent. Since the sensitivity axes of the hair cells are independent of frequency, this observation is interpreted as indication of a frequency-dependent pattern of otolith movements during sound stimulation. From this it follows that the part of the macula which is maximally stimulated by the otolith may change with frequency, which constitutes a possible basis for peripheral frequency analysis in fish. The evidence for this theory is sparse and unsatisfactory, but techniques are today available which may be used to measure the vibration pattern of otoliths directly (see for instance Michelsen, 1971). It is suggested that future work should employ such techniques to explore the present notion of a frequency-dependent pattern of otolith movements.
direction of the forced otolith vibrations is not fixed, and it is difficult to imagine how the mechanism for mechanical frequency analysis outlined above may be operating.
Directional hearing
Enger et al. (1973) suggested that different hair cells in the ear may have different axes of maximal sensitivity to vibration, and that this would provide a possible neuro-logical explanation for the ability of fish to detect the direction to a sound source. However, they only studied the effect of horizontal vibrations, and their data did not conclusively support their theory. For fish possessing a swimbladder the main problem would be possible masking of the incident sound by the amplified vibrations re-radiating from the bladder. Since the lagena is mainly sensitive to vertical vibrations, the swimbladder will influence this part of the ear much less than the sacculus. Although the effect of vertical sound on the sacculus is heavily masked by re-radiated swimbladder pulsations, especially at the anterior end, the incident sound may be efficient in stimulating the lagena directly. By comparing the nervous output from the lagena and the anterior part of the sacculus, the fish should then be able to get direc-tional information about the vertical position of the sound source. Since no evidence exists to confirm that such a mechanism is operating in practice, the theory presented above must be considered tentative. The same must be stressed for the development of the theory below, where a possible mechanism for directional sensitivity in the horizontal plane is suggested.
that the threshold for detection of the direction of a sound should be higher than for simply detecting the sound itself.
This hypothesis for directional hearing in fish is oversimplified. For instance, how the fish may avoid confusion due to directional ambiguity is not discussed at all. On the other hand, it is demonstrated that different parts of the maculae in the pars inferior have different axes of optimal sensitivity, and it is concluded that these differences in sensitivity may be utilized in directional hearing. Such a model would be very simple for fish lacking a swimbladder, but even in fish which take auditory advantage of a swimbladder this model provides a possible explanation of the ability of these fish to detect the direction of a sound source.
The behavioural data on directional hearing in fish is too sparse to support the model presented above. It is therefore suggested that future behaviouristic experi-ments should be conducted to test the following assumptions. For a fish possessing a swimbladder the threshold for simply detecting a sound should be lower than the threshold for detecting the sound direction. It should also be easier to detect direction at low frequencies, where the effects of the swimbladder are less. Furthermore, the capacity of a fish to determine the vertical direction of a sound source should be at least as good as the ability to detect the horizontal direction.
In regard to the directional sensitivity in the horizontal plane, it is possible, on the basis of the data given in this paper, to make a tentative estimate of the power of angle separation. If each of the number 8-shaped microphonic response curves pre-sented in Text-fig. 12 is simplified to consist of two touching circles of diameter a, the difference in response between the two ears is easily calculated. The angle between the long axes of the two 8-shaped figures is 2a, and the angle between the long axis of the fish and the direction of vibration is <j>. Within the sectors 270° + a < <f> < (900 —a) and 90° + a < (j> < (2700 —a) the difference in response is given by:
Fx = a cos (<f> — a) — a cos (?^ + a) = za sin a sin <j>. (1)
Within the sectors 9 00- a < <j> < 90° + a and 2700 — a < <f> < 2700 + a the difference is given by:
F% = a c o s ( 0 - a ) + a cos(0 + a) = 2a cos a cos 0. (2)
It is reasonable to propose that the power of angle separation is optimal for the sectors where a small change of vibration angle gives maximal change of the difference in response between the ears; or, in other words, for the vibration angles where the numerical value of the derivative of F is maximal.
-3-^ = 2a sin a cos <}>, (3)
dF2 . , , .
-j-2= = —za cos a sm <p. (4)
a<p
For perch the value of a was about 200, which gives:
AT?
—^ x o-68a cos <{>, (5)
§ « - i'98a sin $. (6)
It is seen that the derivative of F has maximum values for o°, 1800 and 900, 2700. Furthermore, because the numerical value of dF^dcj) at its maxima is greater than the maximal dFJd<f> value, this should imply that for horizontal sound waves the power of angle separation in perch is optimal for sound directions side on to the fish.
SUMMARY
1. Microphonic potentials were recorded from the lagena and from different parts of the sacculus in the perch during horizontal and vertical vibration of the fish in air. This stimulation technique gives a good simulation of sound stimulation in water.
2. The lagena was predominantly sensitive to vertical vibrations, whereas the anterior part of the sacculus was equally sensitive to vertical and horizontal vibrations. A gradient is seen along the sacculus, in that the more posterior positions show a tendency towards greater relative vertical sensitivity. By comparing the nervous output from the lagena and from the sacculus the fish might thus get information about the vertical direction of the sound source.
3. The amplitude of the saccular microphonic potentials evoked by horizontal vibrations was a function of the vibration direction. Maximal responses were obtained when this direction deviated about 200 from the long axis of the fish, which is approxi-mately parallel to the long axis of the sacculi. The difference in response between the two ears might be utilized to give directional information about the horizontal position of the sound source.
4. Sound-induced pulsations radiating from the swimbladder will be efficient in evoking saccular microphonic potentials. This causes masking of the difference in response between the two ears, but directional information may still be obtained. It is proposed that the power of angle separation in the horizontal plane should be optimal for sound waves side on to the fish, and that a fish possessing a swimbladder may be able to detect the sound direction with higher accuracy in the vertical than in the horizontal plane.
5. The relative effect in evoking microphonic potentials of vertical compared to horizontal vibrations was frequency dependent, and it is concluded that the pattern of otolith movements during sound stimulation may also change with frequency. This phenomenon constitutes a possible basis for peripheral frequency analysis in fish.
I am greatly indebted to Mr C. J. Chapman, Dr P. S. Enger, Dr A. D. Hawkins and Mr T. B. Mele for critical comments and positive suggestions for improving the manuscript. I thank Mr H. O. Torsen for technical advice, and Dr R. Hoi is acknowledged for help in obtaining the radiographs of living perch.
REFERENCES
ANDERSEN, R. A. & ENGER, P. S. (1968). Microphonic potentials from the sacculus of a teleost Fish.
Camp. Biochem. Pkytiol. 37, 879-81.
VON BEKESY, G. (i960). Experiments in Hearing. New York: McGraw-Hill.
VAN BERGEIJK, W. A. (1964). Directional and nondirectional hearing in fish. In Marine Bio-Acoustics (ed. W. N. Tavolga), pp. 281-99. Oxford: Pergamon Press.
VAN BERGEIJK, W. A. (1967). Discussion of critical bands in hearing of fishes. In Marine Bio-Acoustics, vol. 2 (ed. W. N . Tavolga), pp. 244-5. Oxford: Pergamon Press.
37I-9O-Journal of Experimental Biology, Vol. 60, No. 3
Plate 1
CHAPMAN, C. J. & SAND, O. (1974). Field studies of hearing in two species of flatfish Pleuroneetet
platetsa (L.) and Umanda limanda (L.) (Family Pleuronectidae). Comp. Biochem. Pkyriol. 47 A,
37I-85.
DIJKGRAAF, S. (1950). Untersuchungen (iber die Funktionen des Ohrlabyrinths bei Meeresfischen.
Pkytiol. Comp. Oecol. a, 81-106.
DIJKORAAF, S. (1952). Bau und Funktionen der Seitenorgane und des Ohrlaburinths bei Fischen.
Experientia 8, 205-16.
ENGER, P. S. (1963). Unit activity in the fish auditory system. Acta pkytiol. scand. 59, suppl. 1-48.
ENGER, P. S., HAWKINS, A. D., SAND, O. & CHAPMAN, C. J. (1973). Directional sensitivity of saccular
microphonic potentials in the haddock. J. exp. Biol. 59, 425-34.
FLOCK, A. & WERSAIX, J. (1962). A study of the orientation of the sensory hairs of the receptor cells in the lateral line organ of fish, with special reference to the function of the receptors. J. Cell Biol. 15.
19-27-VON FRISCH, K. & DIJKGRAAF, S. (1935). KOnnen Fische die Schallrichtung wahmehmen? Z. vergl.
Pkytiol. aa, 641-55.
FURUKAWA, T. & ISHII, Y. (1967). Neurophysiological studies on hearing in goldfish. J. Neuropkysiol. 30,
1377-403-HAMA, K. (1969). A study on the fine structure of the saccular macula of the gold fish. Z. Zellfortch.
mikrotk. Anat. 94, 155-71.
LOWENSTEIN, O. & ROBERTS, T. D. M. (1951). The localization and analysis of the responses to vibra-tion from the isolated elasmobranch labyrinth. A contribuvibra-tion to the problem of the evoluvibra-tion of hearing in vertebrates. J. Pkytiol., Land. 114, 471-89.
MICHELSEN, A. (1971). The physiology of the locust ear. II. Frequency discrimination based upon resonances in the tympanum. Z. vergl. Pkytiol. 71, 63-101.
MYRBERG, JR., A. A., HA, S. J., WALEWSKI, S. & BANBURY, J. C. (1972). Effectiveness of acoustic
signals in attracting epipelagic sharks to an underwater sound source. Bull. mar. Set. Gulf Caribb. aa, 926-49.
NELSON, D. R. & JOHNSON, R. H. (1972). Acoustic attraction of Pacific reef sharks: Effect of pulse intermittency and variability. Comp. Biochem. Pkytiol. (A) 4a, 85-95.
OL8EN, K. (1969a). Directional hearing in cod (Gadut morkua L.). 8th I. F. Meeting, Lowestoft. 12 pp. 0L8BN, K. (19696). Directional responses in herring to sound and noise stimuli. Int. Coun. Explor. Sea.,
1969/B20, 8 pp.
PAHVULESCU, A. (1964). Problems of propagation and processing. In Marine Bio-Acouttia (ed. W. N . Tavolga), pp. 87-100. Oxford: Pergamon Press.
PARVULESCU, A. (1967). Acoustics of small tanks. In Marine Bio-Acouttict (ed. W. N. Tavolga), vol. 2, pp. 7-13. Oxford: Pergamon Press.
REINHARDT, F. (1935). Uber Richtungswahrnehmung bei Fischen, besonders bei der Elritze (Phoxinut
laevit L.) und beim Zwergwels (Amhirut nebulotut Raf.). Z. vergl. Pkytiol. aa, 570-603.
SAND, O. & ENGER, P. S. (1973). Evidence for an auditory function of the swimbladder in the cod.
J. exp. Biol. 59, 405-14.
SCHUIJF, A., BARETTA, J. W. & WiLDSCHUT, J. T. (1972). A field investigation on the discrimination of sound direction in Labrut bergylta (Pisces: Perciformes). Neth. J. Zool. aa, 81-104.
TAVOLGA, W. N. (1971). Sound production and detection. In Fith Pkytiology, vol. v (ed. W. S. Hoar and D. J. Randall), pp. 135-205. New York: Academic Press.
WERSALL, J., FLOCK, A. & LUNDQUIST, P. G. (1965). Structural basis for directional sensitivity in cochlear and vestibular sensory receptors. Cold Spring Harb. Symp. quant. Biol. 30, 115-32. WOLFF, D. L. (1967). Das HorvermSgen des Flussbarsches (Perca fluviatilit L.). Biol. Zbl. 86, 449—60.
EXPLANATION OF PLATE