www.ocean-sci.net/7/141/2011/ doi:10.5194/os-7-141-2011
© Author(s) 2011. CC Attribution 3.0 License.
Ocean Science
Long-term spatial variations in the Baltic Sea wave fields
T. Soomere and A. R¨a¨amet
Institute of Cybernetics at Tallinn University of Technology, Tallinn, Estonia Received: 23 October 2010 – Published in Ocean Sci. Discuss.: 5 November 2010 Revised: 5 February 2011 – Accepted: 7 February 2011 – Published: 18 February 2011
Abstract. This study focuses on spatial patterns in linear trends of numerically reconstructed basic wave properties (average and extreme wave heights, wave periods) in the Baltic Sea under the assumption of no ice cover. Numeri-cal simulations of wave conditions for 1970–2007, using the WAM wave model and adjusted geostrophic winds, revealed extensive spatial variations in long-term changes in both av-erage and extreme wave heights in the Baltic Sea but almost no changes in the basinwide wave activity and wave peri-ods. There has been a statistically significant decrease in the annual mean significant wave height by more than 10% be-tween the islands of ¨Oland and Gotland and in the south-ward sea area, and a substantial increase to the south-west of Bornholm, near the coast of Latvia, between the ˚Aland Archipelago and the Swedish mainland, and between the Bothnian Sea and the Bothnian Bay. Variations in extreme wave heights (defined as the threshold for 1% of the highest waves each year) show similar patterns of changes. In sev-eral areas the trends in average and extreme wave heights are different. Such a complicated pattern of changes indicates that (i) different regions of the Baltic Sea basin have expe-rienced widespread but essentially different changes in wind properties and (ii) many seemingly controversial trends and variations established in wave properties at different sites in the recent past may reflect the natural spatial variability in the Baltic Sea wave fields.
1 Introduction
Studies into wind wave climate are gaining more impor-tance in the context of global climate change. Surface waves are a major driver of processes in the surface layer of the
Correspondence to: T. Soomere
entire ocean and especially in the nearshore and coastal ar-eas. The flux of wave energy towards the coasts is responsi-ble for many processes in the nearshore, ranging from long-term accumulation, erosion and degradation that gradually shape the coasts to various marine-induced hazards and dis-asters. A comprehensive understanding of the properties of the approaching waves and their potential changes is the ma-jor knowledge necessary for sustainable management of both offshore activities and the coastal region. Moreover, the wave climate is one of the most sensitive indicators of changes in the wind regime and local climate in semi-enclosed sea areas (Weisse and von Storch, 2010). For example, the potential for the increase in wave heights in the North Sea (18%) is much larger than that of the wind speed (7% for the 99th percentile, Grabemann and Weisse, 2008). Changes in wave climate even in terms of shifts in the stormy season to months with no ice cover may lead to most severe destruction of vul-nerable beaches of partially ice-covered seas as has been no-ticed in the eastern Baltic Sea (Orviku et al., 2003; Ryabchuk et al., 2011).
ignoring the ice conditions will lead to certain deviations of the resulting wave properties and statistics from the actual one. There is, however, no commonly accepted method to estimate wave statistics in seasonally ice covered domains (Kahma et al., 2003). As our basic goal is to identify (the pat-terns of) changes that stem from wave generation conditions (that is, the changes that would be evident if there would be no ice cover at all), we choose to consider the hypothetical situation with no ice cover.
Recent research has highlighted greatly variable patterns in the driving factors of the Baltic Sea wind waves (Jaagus et al., 2008). The average wind speed over most of this basin (especially in its southern part) has increased over the last decades (Pryor and Barthelmie, 2003), while a decrease has been documented in the region of the Western Estonian Archipelago and on the southern coast of the Gulf of Finland (Keevallik and Soomere, 2004; Kull, 2005).
The reaction of wave fields to such changes is not obvious and it is not unexpected that the observed changes in the wave properties are quite different in different parts of the Baltic Sea. The annual mean wave heights have increased drasti-cally at both the eastern and western coasts of the northern Baltic Proper (Broman et al., 2006; Soomere and Zaitseva, 2007; Soomere, 2008). The wave activity shows no consider-able changes at the Lithuanian coasts (Kelpˇsait˙e et al., 2008) but has decreased substantially at the south-eastern coast of the Gulf of Finland (Narva-J˜oesuu, R¨a¨amet et al., 2010).
Another wave field characteristic of similar importance is the wave height in strong storms. The storminess in the en-tire region gradually decreased over the first half of the 20th century, increased rapidly in the 1980s and 1990s (Alexan-dersson et al., 1998) and probably decreased again at the very end of the 20th century (Alexandersson et al., 2000; Helminen, 2006). These changes apparently become evident in properties of wind waves. Wave heights in strong storms are usually characterised in terms of the thresholds for 5% and 1% of the highest waves in each calendar year (called the 95th percentile and 99th percentile, respectively). There is implicit evidence about an increase in wave heights in ex-treme storms (Soomere et al., 2008) and in those wave condi-tions that occur together with high water level and cause the most extensive coastal destructions in this microtidal basin (Orviku et al., 2003, 2009; T˜onisson et al., 2008). Relevant data sets exist only for a selection of sites (Suursaar and Kul-las 2009; R¨a¨amet et al., 2010; Suursaar, 2010).
In winter frequent stormy winds and the presence of heavy ice often complicate both visual wave observations and in-strumental measurements in the northern Baltic Sea. Float-ing devices are usually removed well before the ice season (Kahma et al., 2003). As a consequence, the measured wave time series do not contain data from the windiest period that frequently occurs just before the ice cover is formed. Global wave data sets such as KNMI/ERA-40 Wave Atlas (09.1957– 08.2002, Sterl and Caires, 2005) have a too coarse spatial
resolution (1.5◦×1.5◦) for an adequate representation of the Baltic Sea conditions.
We make an attempt to fill this gap by means of high-resolution numerical reconstruction of wave properties over almost four decades. Most of similar attempts in the past cover relatively short periods of a few years (Papli´nska, 1999, 2001; J¨onsson et al., 2002) or concentrate on spe-cific areas (Blomgren et al., 2001; Cie´slikiewicz and Her-man, 2002; Soomere, 2003, 2005). A few results of long-term reconstructions of wave fields over the entire Baltic Sea have recently been reported in the international litera-ture (Cie´slikiewicz and Papli´nska-Swerpel, 2008; Kriezi and Broman, 2008). However, as yet no comprehensive descrip-tion of numerically simulated changes in the wave fields has been presented.
Our study deals with spatial patterns of long-term varia-tions in the basic wave properties such as the annual mean wave height and period, and properties of waves in strong storms. The analysis is based on a numerical reconstruc-tion of the wave fields for 1970–2007 with the use of a high-resolution version (grid step about 3 miles) of the wave model WAM driven by surface-level winds derived from geostrophic wind data. We start from the description of the model setup and definition of the forcing fields. Unlike Mar-tucci et al. (2010), we discuss both the magnitude and the extent of spatial variations in the linear trend in the annual mean and extreme wave heights together with their statisti-cal significance.
2 Wave model and wind forcing
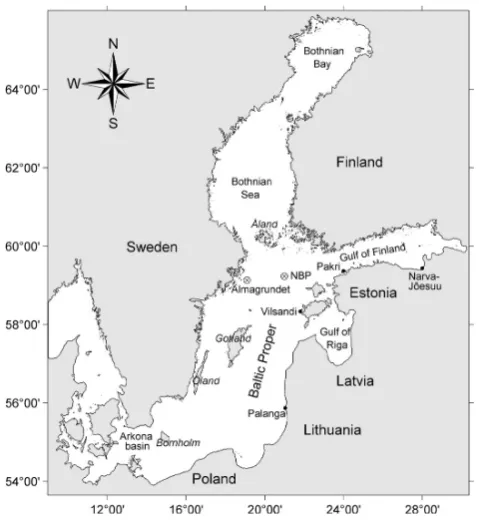
Fig. 1. Location scheme of the Baltic Sea and a selection of wave
measurement and observation sites in the Baltic Proper and the Gulf of Finland.
The model output gives at each grid point at chosen times the following parameters: significant wave height, mean wave direction, mean and peak periods, drag coefficient, fric-tion velocity, wind stress fields and two-dimensional (2-D) wave spectrum. In this study we only analyse the wave height and to a limited extent wave periods. The model was run un-coupled from the North Sea wave fields on a grid that was truncated in the narrowest parts of the Danish Straits. The hindcast was performed in shallow-water mode with depth refraction (but without depth-induced breaking) in order to match realistic wave propagation patterns over the highly variable bathymetry of the relatively shallow Baltic Sea.
The bathymetry was based on data by Seifert et al. (2001) and adjusted as described in Soomere (2001). The calcu-lation was undertaken over a regular rectangular grid with a resolution of about 3×3 nautical miles. This resolution is somewhat finer than that used in other calculations in the recent past (J¨onsson et al., 2002, 2005; Cie´slikiewicz and Papli´nska-Swerpel, 2008; Kriezi and Broman, 2008). The entire grid contains 239×208 points (11 545 seapoints) and extends from 09◦360E to 30◦180E and from 53◦570N to 65◦510N.
At each seapoint 1008 components (24 equally spaced di-rections and 42 frequencies from 0.042 Hz (23.9 s) to about 2 Hz (0.5 s) of the 2-D spectrum were computed. The ex-tended frequency range up to 2 Hz was used to ensure real-istic wave growth in low wind conditions after calm periods.
Such situations are frequent in the Baltic Sea. The propaga-tion and source time step were both set to 180 s to ensure nu-merical stability of the integration scheme. The wave prop-erties were recorded hourly for the entire period of calcula-tions.
The central question in the modelling of long-term changes in the wave field is the homogeneity of wind infor-mation. Most of high-resolution contemporary wind data sets for the Baltic Sea basin (e.g. MESAN since 1996 (H¨aggmark et al., 2000) or the wind fields calculated with the local atmo-spheric models such as HIRLAM) either cover a relatively short time interval or are inhomogeneous in time owing to changes in the numerical scheme. An analysis of the qual-ity of modelled wave fields showed that the qualqual-ity of wind data obtained from different sources largely varied over the Baltic Sea, whereas the winds derived from the geostrophic wind data showed on average the best performance (R¨a¨amet, 2010). Somewhat surprisingly, even high-quality reconstruc-tions of wind fields for two strong storms in this sea in 2001 and 2005, developed by the ECMWF in a 0.25◦×0.25◦ reso-lution (L. Cavaleri and L. Bertotti, personal communication, 2009), led to the same quality of wave hindcast results as the use of geostrophic winds (R¨a¨amet, 2010).
The simulations described below were performed with the use of wind fields constructed on the basis of geostrophic winds. This theoretical wind system represents the equilib-rium air flow patterns (an exact balance between the Coriolis effect and the pressure gradient force) corresponding to the large-scale atmospheric pressure patterns. These fields, al-though they smooth out a large number of local variations in wind properties, are free of local disturbances to the air flow by coastal topography and errors in ground wind speed measurements. The key arguments for their use are that they are highly homogeneous in time and that they represent the impact of global wind patterns which are mostly responsible for the wave climatology.
The geostrophic wind components with a moderate spatial resolution of 1◦×1◦provided by the Swedish Meteorological and Hydrological Institute (SMHI) were first interpolated to a medium resolution (about 6 nautical miles) grid. The data are available once in 6 h before September 1977 and once in 3 h since then. The geostrophic wind speed was multiplied by 0.6 and the direction turned 15◦anticlockwise to yield an approximation of the wind at the 10 m level.
ratio of the 10 m level wind speed to the geostrophic wind speed and the angle between the relevant wind vectors may substantially vary in different regions, seasons and wind di-rections in this basin. The presence of two-peak distributions of strong winds in some parts of the Baltic Proper (Soomere, 2003) may add a certain inaccuracy to the resulting wind field. Also, many Baltic Sea storm patterns exhibit strong ageostrophic features (Soomere et al., 2008). As the listed distortions of the forcing conditions occur regularly in simi-lar wind situations, their impact on the qualitative appearance of the spatial patterns of long-term changes in wave proper-ties apparently is quite limited.
The resulting wind information was used as the input to the wave model. The wind properties were set constant during the relevant 3 or 6 h time intervals starting from the measure-ment instant (e.g., the 6 h wind at 12:00 was considered as valid from 12:00 to 18:00). This approach does not affect the long-term statistics but may result in a delay of the properties of the modelled wave fields compared with their measured values. Wind data in a medium resolution (6 miles) were spatially interpolated to the higher resolution wave modelling grid internally in the WAM model.
A detailed description of the performance of the model against instrumental wave measurements and visual wave ob-servations is given in R¨a¨amet et al. (2009, 2010), R¨a¨amet and Soomere (2010) and R¨a¨amet (2010). The model (i) un-derestimates to a certain extent wave heights in the range of 0.7–1.5 m but (ii) adequately represents the distribution of the higher waves, (iii) gives qualitatively similar results in terms of short-term variations in the visually observed an-nual mean wave heights, (iv) provides satisfactory match of the timing and maximum heights in high wave events and (v) reproduces well the overall statistics of wave conditions (incl. the relevant probability distributions) and their seasonal variations.
On average, the model apparently underestimates the long-term average wave height and in many cases failed to repro-duce the duration of rough seas. Although this underestima-tion evidently is connected with the overall low spatial and temporal resolution of the geostrophic wind data because of a non-linear manner of wave growth under varying wind con-ditions, it is obviously related neither to the change in the time step for the wind data since 1977 nor to the interpo-lation in time of the wind fields. The underestimation may partially stem from the particular choice of the coefficient (0.6) in the procedure of reduction of the geostrophic winds. This choice was mostly verified by comparison of the mea-sured and modelled wave heights in relatively rough seas (see Figs. 3 and 4 of R¨a¨amet and Soomere, 2010). A certain bias in the estimates of the long-term magnitude of wave intensity, however, is obviously insignificant in terms of the changes in wave properties described below.
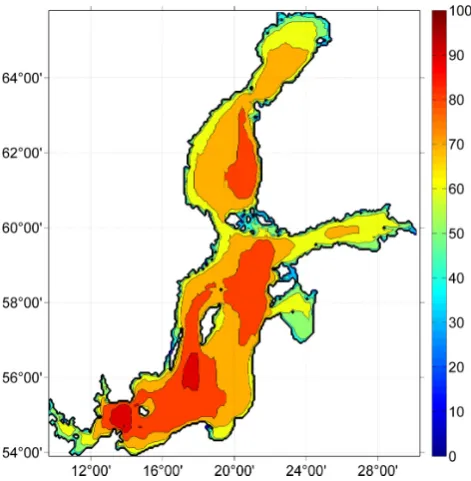
Fig. 2. Numerically simulated average significant wave height (colour bar, cm; isolines plotted after each 10 cm) in the Baltic Sea in 1970–2007 (from R¨a¨amet and Soomere, 2010).
3 Spatial distributions of long-term wave properties
The basic features of the spatial pattern of numerically sim-ulated average wave heights in the Baltic Sea for 1970–2007 have been discussed by R¨a¨amet and Soomere (2010). There-fore we provide here only a short overview of these features. As expected from the properties of predominant winds in the area, the distribution of the long-term average signifi-cant wave height (Fig. 2) is asymmetric with respect to the axes of the two largest sub-basins – the Baltic Proper and the Bothnian Sea. The open part of the Bothnian Sea has quite high wave intensity, comparable to that in the north-ern Baltic Proper. The eastnorth-ern part of the Bothnian Sea has clearly higher waves (>0.8 m on average) than its western area.
In the northern Baltic Proper the wave activity is the high-est along the coasts of the Whigh-estern Estonian Archipelago and Latvia. The average wave heights are relatively low along the coasts of Lithuania, Kaliningrad district of Russia and north-eastern Poland. This is somewhat unexpected as these areas have a relatively long fetch. The Gulf of Finland hosts clearly smaller wave activity, with the average wave heights about 0.7 m only at its entrance and in its central part and about 0.6 m in the rest of the gulf, consistently with an es-timate for a sea area in the neighbourhood of Tallinn Bay (0.56 m, Soomere, 2005). The largest values of the average wave height only slightly exceed 0.6 m in the Gulf of Riga.
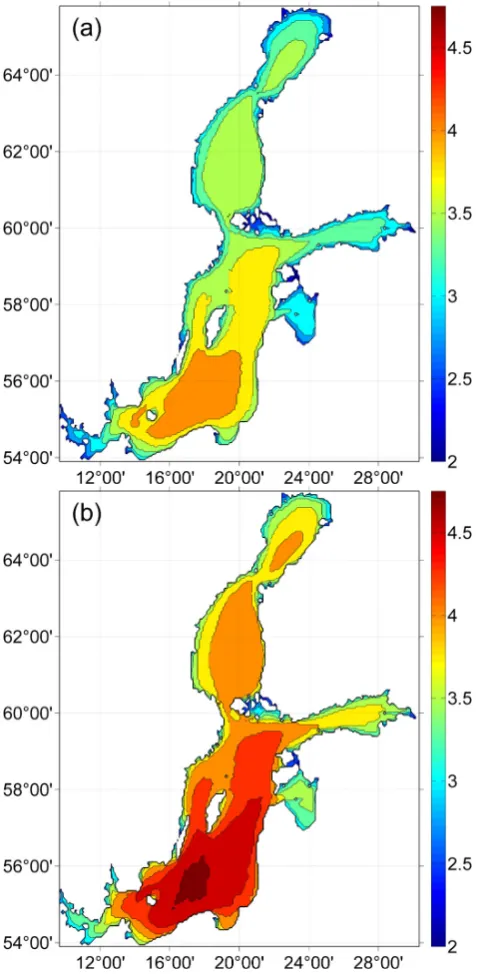
Fig. 3. Numerically simulated mean (a) and peak (b) periods (s;
isolines plotted after each 0.5 s) in the Baltic Sea in 1970–2007.
is quite different for the southern and northern parts of the Baltic Proper. In average, the wave heights are the largest south of Gotland and east of ¨Oland (around 56◦N, 18◦E), and in the Arkona basin.
The modelled wave periods match well the measured pe-riods: while typical peak periods according to measurements are 4–6 s in the open sea (Soomere, 2008), the average peak periods from simulations are about 4 s. Relative spatial vari-ations in the average periods over the Baltic Sea basin are
of the same order of magnitude as similar variations in wave heights. The distributions of periods to some extent match those for the wave height: in both cases they are asymmet-ric, with the greatest values in the eastern part of the Baltic Proper and the Bothnian Sea. The predomination of south-westerly winds in this area (Mietus, 1998) suggests that the largest wave periods should usually occur in the northern Baltic Proper. The long-term maxima of both peak and mean periods (Fig. 3), however, are found in the southern Baltic Proper. The probable reason for such a location of the peak is that this region has a very long fetch in several directions (es-pecially in the western and N-NW direction) and frequently receives relatively low-frequency swells generated in remote sea areas.
4 Patterns of long-term changes in average wave properties
The existing evidence about changes in the overall wave in-tensity is highly controversial and reveals largely different trends in various parts of the Baltic Sea (Broman et al., 2006; Soomere and Zaitseva, 2007; Kelpˇsait˙e et al., 2008; Soomere, 2008). We calculated the relevant trends in the following manner. For each of the 11 545 sea points, first the annual mean significant wave height was calculated from the simulated hourly values. This quantity hereafter is called (overall) wave intensity (or activity). A linear trend was then found for these 38 estimates of the annual wave intensity for each year. The change in the wave height was calculated as the difference between the values for this trendline for the beginning and end years of the simulations. The resulting value of the change is equivalent to a product of the slope of the trendline and the length of the time series. Finally, the statistical significance of the changes for each sea point was found with standard methods in terms of the relevant p-value. Note that here the significance characterises the match of the annual values of significant wave height with the rel-evant trendline. Therefore, a high significance indicates that the time series of the annual wave activity can be represented well by a linear model rather than the existence of a signifi-cant increase or decrease in the wave height.
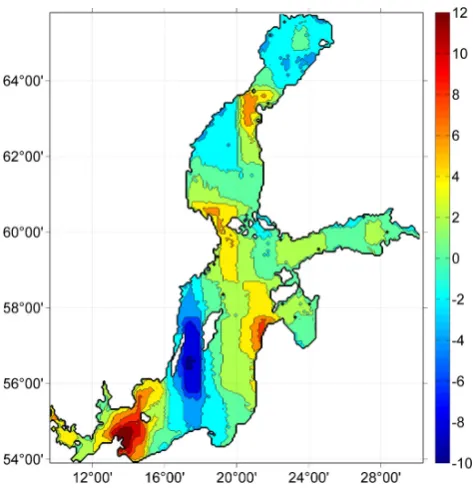
Fig. 4. Long-term changes in the annual average significant wave
height (cm, based on the linear trend, isolines plotted after each 2 cm) for 1970–2007.
Bay. There is also a slight increase in wave activity in both the Gulf of Riga and Gulf of Finland.
Interestingly, the spatial pattern of the described changes is largely uncorrelated with the areas of high and low wave in-tensity. The area of high waves in the Arkona basin exhibits an increase in wave heights while the wave activity in the neighbouring similar area is decreasing at almost the same rate (about 10 cm, that is, up to 15% in 40 yr). Another area of intense waves near Latvia also reveals an increase in wave heights. The areas subject to significant changes in wave heights to the south and north of the Bothnian Sea host an average wave intensity. Somewhat unexpectedly, the model shows almost no changes for the north-eastern Baltic Proper and along most of the Polish coast.
There is a remarkable match between the areas that show high values of the pointwise calculated statistical signifi-cance of the modelled changes (Fig. 5) and the domains that exhibit substantial positive and negative changes in the wave heights (Fig. 4). This match suggests that the wave regime in the five discussed areas has experienced clear changes over the simulation interval. The significance is the highest, about 99%, for the area to the south of Bornholm. The other four areas have typical values of this measure over 90%.
The numerically simulated temporal changes in wave pe-riods (not shown) follow the pattern of changes in wave heights: periods have become longer in the eastern part and shorter in the western part of the Baltic Proper. These changes, however, are quite small, maximally a couple of tenths of seconds and thus can be neglected in practical
Fig. 5. Statistical significance (%) of the changes presented in Fig. 4
in terms of 100×(1–p), where p is the relevant p-value for the particular sea point.
applications. In other words, the performed calculations suggest that quite substantial variations in long-term wave heights have taken place but no noteworthy increase in the typical wave periods has occurred in the Baltic Sea over the last four decades.
5 Wave properties in strong storms
Recent research into long-term variations in the largest waves (Suursaar and Kullas, 2009; R¨a¨amet et al., 2010; Suursaar, 2010) has shown quite limited changes for selected locations along the Estonian coast. Some results, derived from sim-ple fetch-based wave models and one-point forcing (Suur-saar and Kullas, 2009; Zaitseva-P¨arnaste et al., 2009), indi-cate a pronounced increase in the 90th percentile and 99th percentile for a location near the coast of the Western Es-tonian Archipelago, whereas Suursaar (2010) has identified a decrease in the annual mean wave height on the northern coast of Estonia.
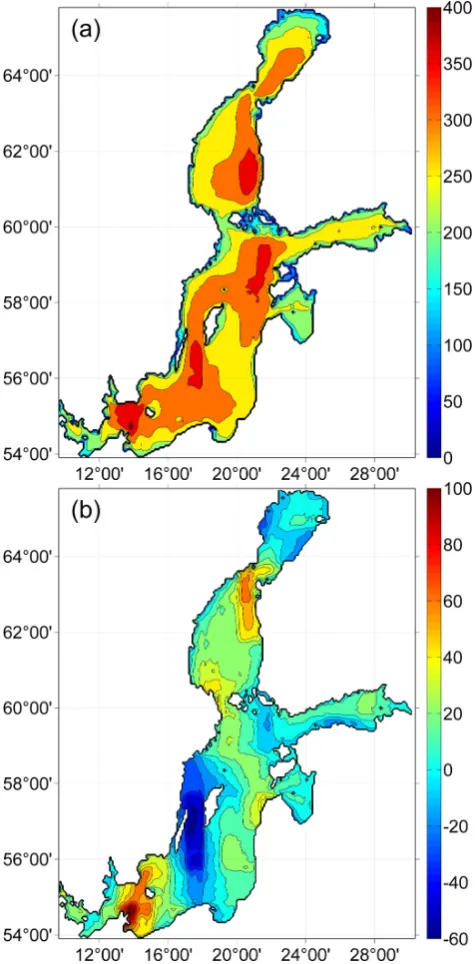
Fig. 6. (a) Numerically simulated 99th percentile of significant
wave height (cm; isolines plotted after each 50 cm) and (b) its change according to the linear trend in the Baltic Sea in 1970–2007 (cm; isolines plotted after each 10 cm).
below. These values were calculated over the entire set of hourly wave heights for each year. An estimate of the long-term value of the relevant wave height was then found as an average over the annual values. Finally, the pattern of trends in extreme wave heights and its statistical significance was calculated pointwise similarly to the trends in average wave intensity.
The highest extreme waves occur in the areas with the highest overall wave intensity: in the Arkona basin, south of Gotland, in the north-eastern Baltic Proper and in the east-ern Bothnian Sea (Fig. 6a). It is an expected outcome, hav-ing the same reasons as those discussed earlier for the aver-age wave heights. Firstly, these areas have the longest fetch. Secondly, the geostrophic winds are relatively strong in the south-eastern part of the Baltic Sea. The changes in extreme wave heights are almost identical to the changes in average wave heights (Fig. 6b). Consistently with the results of Su-ursaar and Kullas (2009) and SuSu-ursaar (2010), a notable de-creasing trend in 99th percentiles occurs near the North Esto-nian coast (which is opposite to a gradual increasing trend in the average wave height) and a slight increase in the heights of extreme waves in the nearshore of the Western Estonian Archipelago.
6 Conclusions
The described features indicate that certain substantial changes in both average wave intensity (in terms of the an-nual mean significant wave height) and extreme wave condi-tions (understood as the wave height occurring with a prob-ability of 1–5%) have occurred over the Baltic Sea since the 1970s. Interestingly, there is a very minor change in the spa-tially averaged wave height and almost no temporal changes in the wave periods.
However, major changes in both average and extreme wave properties have taken place in different regions. An in-crease in wave activity in the Arkona basin is not unexpected because the wind speed in this area has grown markedly over the last decades (Pryor and Barthelmie, 2003, 2010). A de-crease of the same magnitude in the neighbouring sea area to the north-east of Bornholm is, however, counter-intuitive and further research is necessary to confirm this result of wave modelling. Such a complicated pattern of spatial changes is not completely unexpected as many studies have shown that the magnitudes of the trends in wave properties can greatly vary in different sea areas (Weisse and von Storch, 2010; Martucci et al., 2010, among others). It is, however, notable that a steep decrease in wave heights may occur in open sea areas adjacent to those hosting an equally steep increase in wave heights.
Ironically, most of the wave observation and measurement sites from where long-term data is available (on the eastern coast of the Baltic Sea, on the coasts of the Baltic Proper and in the Gulf of Finland, Fig. 1) are located in areas where the simulations revealed almost no long-term changes in wave properties. We are looking forward to digitising the historical wave data from Latvian coastal observation sites which may confirm the simulated long-term changes.
of wave conditions are realistic (R¨a¨amet et al., 2009). More-over, it is natural to assume that a large part of long-term changes in wave fields are tightly related to similar changes in the air pressure patterns and the geostrophic winds even in areas where ageostrophic components or specific wave gen-eration conditions (Pettersson et al., 2010) are at times or in places decisive. Therefore, the performed simulations evi-dently capture realistically the slopes of the relevant trends in wave parameters.
One of the advantages of using the geostrophic wind data is that it implicitly accounts for the presence of ice cover (although the generalized nature of this data obvi-ously smoothes out many details of air–sea interaction). Our approach of completely ignoring the ice cover in the wave model means, however, that the established patterns of changes may be artificial in areas covered with ice dur-ing a large part of the year (such as the Bothnian Bay). The key distortion to instantaneous wave properties in ice-free re-gions of a partially ice-covered basin stems from the potential decrease in the fetch length for some regions and an associ-ated overestimation of the wave heights and periods. Given the predominant wind direction from the SW in the northern Baltic Proper (Mietus, 1998) and the typical presence of sea ice in this area, it is very unlikely that the related distortions would qualitatively affect the established patterns in most of the Baltic Proper.
A key message from the described results is that many seemingly controversial trends and variations established in wave properties at different sites to a large extent reflect the natural spatial variability in the Baltic Sea wave fields. In this context, it is highly intriguing that in some areas the trends in the long-term average wave heights and in the highest wave properties are different.
Although it is obvious that the described changes are driven by wind fields, the background reasons and future ex-tension of the resulting spatio-temporal variability in wave properties remain largely concealed. Clearly, a simple in-crease in the wind speed or a gradual turn in the predominant wind direction over the entire basin is not sufficient to pro-duce such an extensive and strong pattern of variations in wave conditions. The reaction of the sea surface to changing wind conditions is generally a nonlinear process and the re-sponse in terms of the wave field not necessarily exactly fol-lows the changes in the wind field similarly to the quite weak correlation between the temperatures of the air and surface water in the Black Sea (Shapiro et al., 2010).
A remarkable feature is the match between the areas that show high statistical significance of the modelled changes and the domains that exhibit substantial positive and nega-tive changes in the wave heights. This feature suggests that different regions of the Baltic Sea basin have experienced widespread but essentially different changes in certain wind properties. For example, during the last 40 yr there has been a significant increase in the frequency of south-western winds and a decrease in southern and eastern winds all over Estonia
(Kull, 2005). Such a change may be responsible for a large part of the increase in wave activity in the northern Baltic Proper as it leads to a systematic increase in the typical fetch length in this basin. This alteration, though, cannot explain the rapid variations in wave heights in the southern Baltic Sea.
Acknowledgements. The research was supported by targeted financing by the Estonian Ministry of Education and Research (grants SF0140077s08 and SF0140007s11), the Estonian Science Foundation (grant No. 7413) and the BONUS+ project BalticWay (financed by the BONUS EEIG). The authors are deeply grateful to the Swedish Meteorological and Hydrological Institute, especially to Barry Broman, for providing geostrophic wind data for the Baltic Sea basin.
Edited by: A. Sterl
References
Alexandersson, H., Schmith, T., Iden, K., and Tuomenvirta, H.: Long-term variations of the storm climate over NW Europe, Global Atm. Ocean System, 6, 97–120, 1998.
Alexandersson, H., Tuomenvirta, H., Schmith, T., and Iden, K.: Trends of storms in NW Europe derived from an updated pres-sure data set, Clim. Res., 14, 71–73, 2000.
Andrejev, O., Myrberg, K., Alenius, P., and Lundberg, P. A.: Mean circulation and water exchange in the Gulf of Finland – a study based on three-dimensional modelling, Boreal Environ. Res., 9, 1–16, 2004.
[BACC] The BACC Author Team: Assessment of climate change for the Baltic Sea basin, Reg. Clim. Stud., Springer, Berlin Hei-delberg, 474 pp., 2008.
Blomgren, S., Larson, M., and Hanson, H.: Numerical modeling of the wave climate in the Southern Baltic Sea, J. Coastal Res., 17, 342–352, 2001.
Broman, B., Hammarklint, T., Rannat, K., Soomere, T., and Vald-mann, A.: Trends and extremes of wave fields in the north-eastern part of the Baltic Proper, Oceanologia, 48(S), 165–184, 2006.
Bumke, K. and Hasse, L.: An analysis scheme for determination of true surface winds at sea from ship synoptic wind and pressure observations, Bound.-Lay. Meteorol., 47, 295–308, 1989. Cie´slikiewicz, W. and Herman, A.: Wave forecasting over the Baltic
Sea and the Gulf of Gda´nsk using WAM and SWAN models with wind forcing data modelled by ICM, in: Research works based on the ICM’s UMPL Numerical Weather Prediction Sys-tem results, Wydawnictwa Uniwersytetu Warszawskiego, 97– 108, 2002.
Cie´slikiewicz, W. and Papli´nska-Swerpel, B.: A 44-year hindcast of wind wave fields over the Baltic Sea, Coast. Eng., 55, 894–905, 2008.
Grabemann, I. and Weisse, R.: Climate change impact on extreme wave conditions in the North Sea: an ensemble study, Ocean Dyn., 58, 199–212, 2008.
Helminen, J.: Finnish local view on the factors accounting for the costs of weather-related disasters (specifically, floods and storms) in recent decades and implications of understanding these for both research and policy, in: Workshop on Climate Change and Disaster Losses: Understanding and Attributing Trends and Projections, edited by: H¨oppe, P. and Pielke Jr., R., Hohenkammer, Germany, 25–26 May 2006, 134–144, 2006. Jaagus, J., Post, P., and Tomingas, O.: Changes in storminess on the
western coast of Estonia in relation to large-scale atmospheric circulation, Clim. Res., 36, 29–40, 2008.
J¨onsson, A., Broman, B., and Rahm, L.: Variations in the Baltic Sea wave fields, Ocean Eng., 30, 107–126, 2002.
J¨onsson, A., Danielsson, ˚A., and Rahm, L.: Bottom type distribu-tion based on wave fricdistribu-tion velocity in the Baltic Sea, Cont. Shelf Res., 25, 419–435, 2005.
Kahma, K., Pettersson, H., and Tuomi, L.: Scatter diagram wave statistics from the northern Baltic Sea, MERI – Report Series of the Finnish Institute of Marine Research, 49, 15–32, 2003. Keevallik, S. and Soomere, T.: Trends in wind speed over the Gulf
of Finland 1961–2000, in: Fourth Study Conference on BAL-TEX, edited by: Isemer, H.-J., Scala Cinema, Gudhjem, Born-holm, Denmark, 24–28 May 2004, International BALTEX Sec-retariat, 29, 129–130, 2004.
Kelpˇsait˙e, L., Herrmann, H., and Soomere, T.: Wave regime differ-ences along the eastern coast of the Baltic Proper, Proc. Estonian Acad. Sci., 57, 225–231, 2008.
Komen, G. J., Cavaleri, L., Donelan, M., Hasselmann, K., Hassel-mann, S., and Janssen, P. A. E. M.: Dynamics and modelling of ocean waves, Cambridge University Press, 532 pp., 1994. Kriezi, E. E. and Broman, B.: Past and future wave climate in
the Baltic Sea produced by the SWAN model with forcing from the regional climate model RCA of the Rossby Centre, in: IEEE/OES US/EU-Baltic International Symposium, Tallinn, Es-tonia, 27–29 May 2008, IEEE, 360–366, 2008.
Kull, A.: Relationship between interannual variation of wind di-rection and wind speed, Publ. Inst. Geogr. Univ. Tartuensis, 97, 62–73, 2005.
Lepp¨aranta, M. and Myrberg, K.: Physical oceanography of the Baltic Sea, Springer Praxis, Berlin Heidelberg, 378 pp., 2009. Martucci, G., Carniel, S., Chiggiato, J., Sclavo, M., Lionello, P., and
Galati, M. B.: Statistical trend analysis and extreme distribution of significant wave height from 1958 to 1999 – an application to the Italian Seas, Ocean Sci., 6, 525–538, doi:10.5194/os-6-525-2010, 2010.
Mietus, M. (co-ordinator): The climate of the Baltic Sea basin, Marine meteorology and related oceanographic activities, Re-port No. 41, World Meteorological Organisation, Geneva, 64 pp., 1998.
Myrberg, K., Ryabchenko, V., Isaev, A., Vankevich, R., An-drejev, O., Bendtsen, J., Erichsen, A., Funkquist, L., Inkala, A., Neelov, I., Rasmus, K., Rodriguez Medina, M., Raudsepp, U., Passenko, J., S¨oderkvist, J., Sokolov, A., Kuosa, H., Ander-son, T. R., Lehmann, A., and Skogen, M. D.: Validation of three-dimensional hydrodynamic models in the Gulf of Finland based on a statistical analysis of a six-model ensemble, Boreal Environ. Res., 15, 453–479, 2010.
Niros, A., Vihma, T., and Launiainen J.: Marine meteorologi-cal conditions and air-sea exchange processes over the northern Baltic Sea in 1990s, Geophysica, 38, 59–87, 2002.
Orviku, K., Jaagus, J., Kont, A., Ratas, U., and Rivis, R.: Increasing activity of coastal processes associated with climate change in Estonia, J. Coastal Res., 19, 364–375, 2003.
Orviku, K., Suursaar, ¨U., T˜onisson, H., Kullas, T., Rivis, R., and Kont, A.: Coastal changes in Saaremaa Island, Estonia, caused by winter storms in 1999, 2001, 2005 and 2007, J. Coastal Res., Special Issue 56, Part 2, 1651–1655, 2009.
Papli´nska, B.: Wave analysis at Lubiatovo and in the Pomera-nian Bay based on measurements from 1997/1998 – comparison with modelled data (WAM 4 model), Oceanologia, 41, 241–254, 1999.
Papli´nska, B.: Specific features of sea waves in the Pomeranian Bay, Arch. Hydro-Eng. Envir. Mech., 48, 55–72, 2001.
Pettersson, H., Kahma, K. K., and Tuomi, L.: Predicting wave di-rections in a narrow bay, J. Phys. Oceanogr., 40, 155–169, 2010. Pryor, S. C. and Barthelmie, R. J.: Long-term trends in near-surface
flow over the Baltic, Int. J. Climatol., 23, 271–289, 2003. Pryor, S. C. and Barthelmie, R. J.: Climate change impacts on wind
energy: a review, Renew. Sust. Energy Rev., 14, 430–437, 2010. R¨a¨amet, A.: Spatio-temporal variability of the Baltic Sea wave fields, PhD thesis, Tallinn University of Technology, 171 pp., 2010.
R¨a¨amet, A. and Soomere, T.: The wave climate and its seasonal variability in the northeastern Baltic Sea, Estonian J. Earth Sci., 59, 100–113, 2010.
R¨a¨amet, A., Suursaar, ¨U., Kullas, T., and Soomere, T.: Reconsid-ering uncertainties of wave conditions in the coastal areas of the northern Baltic Sea, J. Coastal Res., Special Issue 56, Part 1, 257–261, 2009.
R¨a¨amet, A., Soomere, T., and Zaitseva-P¨arnaste, I.: Variations in extreme wave heights and wave directions in the north-eastern Baltic Sea, Proc. Estonian Acad. Sci., 59, 182–192, 2010. Ryabchuk, D., Kolesov, A., Chubarenko, B., Spiridonov, M.,
Kurennoy, D., and Soomere, T.: Coastal erosion processes in the eastern Gulf of Finland and their links with long-term geologi-cal and hydrometeorologigeologi-cal factors, Boreal Environ. Res., 16, Suppl. A, 117–137, 2011.
Seifert, T., Tauber, F., and Kayser, B.: A high resolution spherical grid topography of the Baltic Sea, 2nd Edn., Baltic Sea Science Congress, Stockholm, 25–29 November 2001, Poster 147, 2001. Shapiro, G. I., Aleynik, D. L., and Mee, L. D.: Long term trends in the sea surface temperature of the Black Sea, Ocean Sci., 6, 491–501, doi:10.5194/os-6-491-2010, 2010.
Soomere, T.: Wave regimes and anomalies off north-western Saare-maa Island, Proc. Estonian Acad. Sci. Eng., 7, 157–173, 2001. Soomere, T.: Anisotropy of wind and wave regimes in the Baltic
Proper, J. Sea Res., 49, 305–316, 2003.
Soomere, T.: Wind wave statistics in Tallinn Bay, Boreal Environ. Res., 10, 103–118, 2005.
Soomere, T.: Extremes and decadal variations of the northern Baltic Sea wave conditions, in: Extreme Ocean Waves, edited by: Peli-novsky, E. and Kharif, Ch., Springer, 139–157, 2008.
Soomere, T. and Zaitseva, I.: Estimates of wave climate in the north-ern Baltic Proper derived from visual wave observations at Vil-sandi, Proc. Estonian Acad. Sci. Eng., 13, 48–64, 2007. Soomere, T. and Healy, T.: On the dynamics of “almost
2011.
Soomere, T., Behrens, A., Tuomi, L., and Nielsen, J. W.: Wave conditions in the Baltic Proper and in the Gulf of Finland dur-ing windstorm Gudrun, Nat. Hazards Earth Syst. Sci., 8, 37–46, doi:10.5194/nhess-8-37-2008, 2008.
Sterl, A. and Caires, S.: Climatology, variability and extrema of ocean waves – the web-based KNMI/ERA-40 wave atlas, Int. J. Climatol., 25, 963–977, 2005.
Suursaar, ¨U. and Kullas, T.: Decadal variations in wave heights
off Cape Kelba, Saaremaa Island, and their relationships with changes in wind climate, Oceanologia, 51, 39–61, 2009. Suursaar, ¨U.: Waves, currents and sea level variations along the
Letipea – Sillam¨ae coastal section of the southern Gulf of Fin-land, Oceanologia, 52, 391–416, 2010.
T˜onisson, H., Orviku, K., Jaagus, J., Suursaar, ¨U., Kont, A., and Rivis, R.: Coastal damages on Saaremaa Island, Estonia, caused by the extreme storm and flooding on 9 January 2005, J. Coastal Res., 24, 602–614, 2008.
Tuomi, L.: The accuracy of FIMR wave forecasts in 2002–2005, MERI – Report Series of the Finnish Institute of Marine Re-search, 63, 7–16, 2008.
Tuomi, L., Pettersson, H., and Kahma, K.: Preliminary results from the WAM wave model forced by the mesoscale EUR-HIRLAM atmospheric model, MERI – Report series of the Finnish Institute of Marine Research, 40, 19–23, 1999.
Weisse, R. and von Storch, H.: Marine climate and climate change. Storms, wind waves and storm surges, Springer, Berlin, Heidel-berg, New York, 200 pp., 2010.
Zaitseva-P¨arnaste, I., Suursaar, ¨U., Kullas, T., Lapimaa, S., and Soomere, T.: Seasonal and long-term variations of wave con-ditions in the northern Baltic Sea, J. Coastal Res., Special Issue 56, Part 1, 277–281, 2009.