MARIAN-T. GOMOIU
Institul de Biologie "Tr. SSvulescu", Academia R. S. Romania, Constantza, Romania
KURZFASSUNG: Einige quantitative Daten tiber Lichtpenetration in Sedimenten. Mit Hilfe der LANGEschen Fotoselenzelle und einem Galvanometer wurden Sedimentproben yon der rum~inischen Schwarzmeerktiste und Vergleichsproben aus dem Gebiet der Ostsee auf ihre Licht- durchl~issigkeit hin untersucht. Derartige Untersuchungen sind f~ir die Beurteilung der Lebens- bedingungen fiir endopsammale Organismen - insbesondere Pflanzen - yon grof~er Wichtigkeit. Das Ausmafl der Lichtpenetration durch die untersuchten Sedimente ist eine Funktion der Par- tikelgr/Sfle und -form; es verringert sieh mit abnehmender Korngr~Sl~e. Die Menge des pene- trierenden Lichtes h~ingt ferner ab yon der Substrattiefe. Aus den MeBwerten geht hervor, dal~ die photische Tiefenzone eine recht geringe Ausdehnung yon nur wenigen Millimetern besitzt.
I N T R O D U C T I O N
It is a well known fact that light represents an ecological factor of great sig- nificance for aquatic organisms (HOLMES 1957, KRISTENSEN 1957, STRICKLAND 1958, THORSON 1964, VRANSKY & MARCOV 1947, tO mention only a few papers). A number of scientists who studied the benthic micro-vegetation in various marine areas showed that practically all living bottom diatoms are found in the upper few mm of the soil. ALEEM (1950) and GR~NTV~D (1960, 1962, 1965), by measuring the depth of the photic layer in sediments, have found that beyond a 2 mm thick layer of bottom material, light intensity is reduced by less than 5 percent.
TAYLOR (1964), measuring light penetration through sand containing diatoms, indicated that 10 per cent of solar radiation reaches down to a sand depth of 1.5 mm. GRONTVED (1965) studied the productivity of micro-benthic vegetation in the Danish Wadden Sea; he found that beyond the photic zone (thickness: approximately 3 mm) of the bottom, a stable vegetation of diatoms probably does not exist. As a consequence of bottom layer instability diatoms may be more or less deeply buried in the soil.
Light penetration in sediments 121
supplemented by further and more detailed studies concerning all aspects of propa- gation of both natural and artificial light (polarization, angular distribution, diffusion, absorption, etc.).
M A T E R I A L A N D M E T H O D S
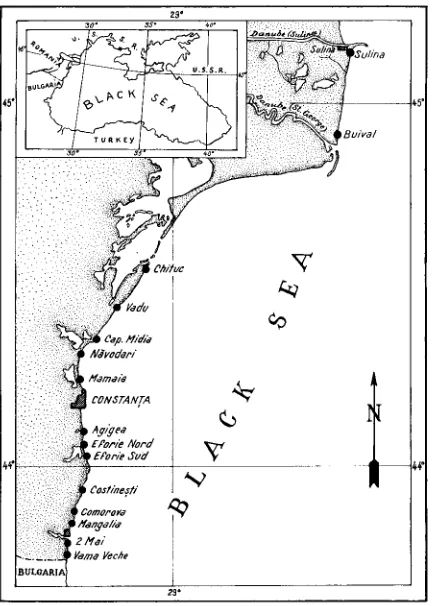
D a t a contained in the present paper are based on material collected mostly from beaches of the Romanian Black Sea shore (Fig. 1). For comparison, some determinations were made on material taken from Baltic Sea beaches (Sopot, Hel, M~dzyzdroje,
Fig. 1 : Romanian seashore with beaches on which sediment samples were taken
Each sample was subjected to optical measurements and granulometric analysis. The material was first washed in fresh water, then dried at 105 ° C. Determinations of light penetration in sediments were made with Dr. LANGE'S selenium photo-cell and a galvanometer. First, light intensity from an artificial source to the photo-cell was recorded in conventional units. This light also passed through an empty vat in which sand was subsequently placed for analysis.. N e x t the quantities of light that passed through different sediment layers were measured. Measurements were carried out successively on samples taken in depths 1 m m apart until two or three consecutive measurements yielded identical results. These last results showed that light ceased to pass through sediment but some "parasitic" light still continued to enter the photo- cell. Therefore, the latter value shall always be deducted from original readings.
Conventional values expressed by the galvanometer in absolute figures were con- verted into percentage values, reckoned as 100 per cent the quantity of light incident upon the sediment. The most difficult problem encountered in the present study was the establishing of a perfect stratification of the sand in layers of pre-established thicknesses (1, 2, 3 . . . . mm); the following method was used: The density of dry sand using vats of different sizes and shapes and finally one single mean were calculated. The sediment to be analysed was placed in a vat with a known volume. By tapping lightly on the container, the sediment was set correctly and then weighed.
G
Density (D) was computed according to the formula D = ~ in which G is the weight
of the sediment contained in the vat and V the vat volume including the sand. Knowing the sand density and the area of the vat for sand analysis, one can calculate the weight of the sand in each one of the 1, 2, 3 . . . . mm thick layers by using the formula:
nSD S g - -
10
in which Sg = sediment weight in each layer, n = thickness of the layer in mm, S = vat area containing the sand to be analysed (expressed in cm 2) and D = density of the sediment.
The galvanometer was read; then the same sample was disarranged and sub- sequently rearranged and the galvanometer read again. This procedure was repeated several times for each sample and then the mean calculated. Sediment granulometry was measured according to methods presented in previous papers (GoMoIu 1963, 1965).
RESULTS A N D D I S C U S S I O N
The data concerning granulometry, mineralogy and chemistry of sediments (GoMoiu 1963, 1965) show that the Romanian Black Sea shore contains two main types of sand:
Light penetration in sediments 123
(2) Medium and coarse-medium, calcareous-shelly sands which may contain as much as 99 per cent crypto-crystalline calcite. These sediments of more recent age are found in beaches south of Constansa, average grain diameter is 580 ~.
With increasing depth of water, the sand grains become finer and finer until they are completely replaced by mud.
foo
9o
% 80-
70-
% GO-
oa 50-
.~ 40-
:~ 30-
"-... 20-
:~ ¢0-
. . . . " O , 5 r n . . . ~ , 5 m . . . 11 ~ 177
!ii
:!
\~ \
",..,.
"k[
I \
% ... ~ )~..~-. - - - - ',~
\ I \ k ""
,.Ii
" , i
\,
\\
\
\
. . . 4 m
23002000 I~00 f000 600500 400 300 200 180 P A R T i C L E 8 i Z E , m i c r o n s
L I G H T P E N E T R A T I O N
10 20 3 0 ~ 0 5 0 60 70 8 0 8 0 /00 0
2-
3-
• ".%°
,.° .~
s o
3 0 " i
,~ 4 m
B
Fig. 2: Sediments from Costine~ti beach. A: Semi-logarithmic cumulative granulometric curves of sand at different depths. B: Light penetration in different sediment types
The coarse shelly sands of the beaches south of Constanza are found up to 3 to 4 m depth. Then they are replaced by the fine quartzy sands which again are replaced, beyond 18 to 20 m, by sandy mud and finally by mud.
The pattern of the samples taken from Costine~ti beach is typical for our samples. Semi-logarithmic granulometric curves of the sands collected at various depths (Fig. 2 A) show that the grains sizes become gradually smaller with depth. The results of granulometric analyses for the present study confirm and strengthen the author's previous data (GoMoiu 1963, 1965),
The parallel presentation of the degree of light penetration in sediment and sand granulometry clearly points to the interdependence of both.
As sediments from different beaches are similar to each other both granulo- metrically and mineralogicatly, only the 19 most characteristic of the 49 analysed samples were considered in the following diagrams. Sediments taken at Sulina are
~r
¢06
90
aod
70
##
5O
40
2O
0
... Z[-
,.\ . . .
" \ \
\' \
• 2 H a /
~
\
'\
\ ,
\
\'x
\ \
\
\
---...___ \
\\'~1
\\ \
\ \\
\
\ \
\
25002000/800
0
2
3.
4
5
8
/0
f000 800500 4 0 0 300 200 /80
P A R T I C L E Sl'ZE, m/'Cronx
LIGHT PENETRATION % 20 3 0 4,0 5 0 80 70 80 90 /00
... Eforie S u d ... OhJtue
. . . dulin8
£foNe N o r d
B
10080 75 GO A
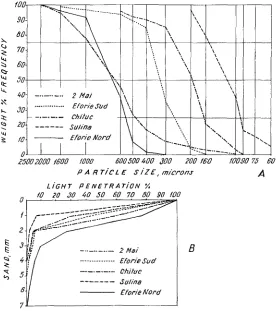
Fig. 3: Sediments from various Romanian beaches. A" Semi-logarithmic cumulative granulo- metric curves of sediment. B: Light penetration in sediments
identical with samples from Buival; samples from Chituc are identical with those from Vadu or Cape Midia, while those from Mamaia are identical with those from N~vodari; again samples from Costine~ti (4 m depth) are identical with samples from Comorova and Mangalia, while those from 2 Mai are identical with those from Vama Veche (see map, Fig. 1).
Light penetration in sediments 125
ments become finer (i. e. the number of sediment grains increases), light penetration is reduced and the aphotic zone begins at 2 mm depth.
The average diameters of sand grains in samples from Costine~ti measure 519/~ in the surf zone, 4 5 7 # at 0.50 m depth, 278 # at 1.50 m, 236/~ at 3 m, and 108 #
at 4 m. Light penetration is different in these sands (Fig. 2
B):
faO
90
8 0
~ 70
~o
30
~, 20
fo
o
%
I _
Ag/ zea 25v165 . . . Ag, Tea 2B V185 . . . Harna.,a BIV B5
... Mamaia 14XI165
I
I
I
>
"
\
\\\' ~\
\\
ZOO0 1 5 0 0 1000 600 5 0 0 400 300 P A R T lC L E 3 i z E, rnlcron.r
i
t
~,',
i
\ ;
"\',.
2 0 0 180
L i G H T PENETRATION Y.
10 20 30 40 50 BO YO 80 80 100
!
2
3 !f ... Ag/fea 2d v/85
I,,i' j . . . M a m a / a B l Y 8 5
i ... Namaia t4 Xll 6,5
B
f00 9 0 7,5
A
Fig. 4: Sediment samples from Mamaia and Agigea beaches. A: Granulometric curves. B: Light penetration in sediment
(1) Through a 1 mm thick sediment layer, 55 percent of the light passed at 0 m, 37 percent at 0.5 m, 40 percent at 3 m and only 2 percent at 4 m depth. The sediment type at 4 m depth is identical with the types which are found at 10, 12, and 15 m depth.
(2) Through a 2 mm thick sediment layer, light penetration is reduced to 6 per- cent at 0 m, 6 percent at 0.5 m, 4 percent at 1.5 m and to 2 percent at 3 m depth. In sediment samples taken at 4 m depth, light penetration does not occur beyond the 2 mm t h i & layer.
(3) Through a 3 mm thick layer, light penetration is either extremely scarce (3 percent) or non-existent.
metry is also shown by other sand types found on Romanian beaches (Fig. 3). In samples taken from Eforie Nord and 2 Mai (sands of the coarse grain type with an average diameter of grains of about 600/z), the highest quantity of light penetration was found (Fig. 3 B). For example, in a 4 mm thick layer of sediment, 5 per cent of incidental light was found in samples at Eforie Nord.
Ioo
,9O
8 0
g so
4 0
O0
ua 2 0
I0-
%
; i
... H e / - - %
'\'I::
; % . ,'
\- - - M ~ d z ~ I Z d r o j e , \ \
. . . $opot ,,.~\. ~
i -o.... \ ~
I
L I
. . . .~00 fO00 6005D0~00 300 280 f60
P A R TI'CLE SizE, m i c r o n s
L I G H T P E N E T . R A T J O A I
fO 20 30 ~0 50 Go To dO 90 fOG
f
2
0-
5.
6.
¢ ... He/ " MEldzuzdroye
. . . ~OpO ~
i
~ L - - ~
/ 0 0 9 0 7 5
A
Fig. 5: Sediment s~mples from Polish Baltic Sea beaches. A: Sediment granulometry expressed in semi-logarithmic cumulative curves. B: Light penetration in sediment
In fine sediment samples taken north of Constan~a (Chituc, Sulina), very small quantities of light were found since the 3 mm thick sediment substrate belongs to the aphotic zone.
In the surf zone, sediment granulometry varies in time and space because of the transport, depositing and grinding action of the waves (GoMoiu 1965) (Fig. 4 A). In samples collected from the same localities but at different dates the character of the sediments also changes optically (Fig. 4 B).
Light penetration in sediments 127
S U M M A R Y
1. Light penetration in sediments is a function of sediment granulometry; it decreases with the decrease in grain size.
2. Light quantities entering the sediments are a function of substrate depth: A t 1 mm depth, light penetration ranges between 80 (at medium quartzy sands from Het) and 2 (at very fine sands from the Black Sea) percent of the light quantities found at the substrate surface; at 2 mm depth light penetration varies between 52 percent and total darkness (when muds replace sand); at 3 mm depth it varies between 0 and 23 per cent; at 4 mm depth, in most samples the aphotic zone was reached; however, in some sediments (quartzy medium or coarse-medium sands) values up to 9 per cent m a y occur; at 5 mm depth out of 46 analysed samples only 5 con- tained up to 5 per cent light; at 6 mm depth the lowest readings of down to 3 per cent were obtained.
3. On the basis of these data, the photic zone in sandy sediments is very thin.
L I T E R A T U R E C I T E D
ALEEM, A. A., 1950. The diatom community inhabiting the mud flats at Whitstable, Kent.
New Phytol. 49, 179-188.
GoMoiu, M. T., 1963. L'analyse granulom&rique des sables de quelques plages de la Mer Noire
(c6te roumaine). Rapp. P.-v. R~un. Commn int. Explor. scient Met M~diterr. 17, 2, I23-131.
-- 1965. Date asupra granulometriei nisipurilor de pe plajele coastelor rom~ne~ti (Data on
granulometric composition of sands on the beaches of the Romanian coasts). Studii Hidraul.
CSA-ISCH., Bueuresti O, 465-489.
GRONVVED, J., 1960. On the productivity of microbenthos and phytoplankton in some Danish
fjords. Meddr Danm. Fisk.- og Havunders. 3 (3), 55-92.
-- 1962. Preliminary report on the productivity of microbenthos and phytoplankton in the
Danish Wadden Sea. Meddr Danm. Fisk.- og Havunders. 8 (2), 347-378.
-- 1965. Productivity of the microbenthic vegetation in the Danish Wadden Sea. < Abstr. >
Ver6ff. Inst. Meeresforsch. Bremerh. Sonderbd 2, 275-276.
Hoz~Es, R. W., 1957. Solar radiation, submarine daylight, and photosynthesis. Mere. geol.
Soc. Am. 67 (1), 109-128.
KRISTENSEN, L, 1957. Differences in density and growth in a cockle population in the Dutch
Wadden Sea. Archs n~erl. Zool. 12, 3, 351-453.
STRICKLAND, J. D. H., 1958. Solar radiation penetrating the ocean. A review of requirements, data and methods of measurement, with particular reference to photosynthetic producti-
vity. J. Fish. Res. Bd. Can. 18, 453-493.
TAYLOR, W. R., 1964. Light and photosynthesis in intertidal benthic diatoms. Helgoliinder
wiss. Meeresunters. 10, 29-37.
THORSON, G., 1964. Light as an ecological factor in the dispersal and settlement of larvae of
marine bottom invertebrates. Ophelia 1, 167-208.
V~tANSlIY, V. K. & MAI~cov, P. K., 1947. Bibliography of the publications on the colour,
transparency and penetration of daylight into the natural waters. Trud. chernomorsk, biol.