Lincoln
University
Digital
Thesis
Copyright
Statement
The
digital
copy
of
this
thesis
is
protected
by
the
Copyright
Act
1994
(New
Zealand).
This
thesis
may
be
consulted
by
you,
provided
you
comply
with
the
provisions
of
the
Act
and
the
following
conditions
of
use:
you
will
use
the
copy
only
for
the
purposes
of
research
or
private
study
you
will
recognise
the
author's
right
to
be
identified
as
the
author
of
the
thesis
and
due
acknowledgement
will
be
made
to
the
author
where
appropriate
you
will
obtain
the
author's
permission
before
publishing
any
material
from
the
thesis.
Optimisation Processing of Green Kiwifruit-Blackcurrant
Leather Using
Response Surface Methodology
A thesis
submitted in partial fulfilment
of the requirements for the Degree of
Master of Applied Science
at
Lincoln University
by
Zhenyu Feng
1
Abstract of a thesis submitted in partial fulfilment of the
requirements for the Degree of Master of Applied Science.
Abstract
Optimisation Processing of Green Kiwifruit-Blackcurrant Leather Using
Response Surface Methodology
by
Zhenyu Feng
The purpose of this study was to efficiently produce a green kiwifruit-blackcurrant fruit leather with acceptable colour and taste characteristics. The effects of different levels of sugar, blackcurrant purée and green kiwi fruit purée and a small addition of pectin were analysed using response surface methodology to identify a range of optimal ingredient levels.
An advanced software programme, Design-Expert which used a Box-Behnken method was used to design the experiment. Sixteen different combinations suggested by the programme were investigated, using constant drying conditions, to determine the final moisture contents, water activity, colour, texture and ascorbic acid contents of the green kiwifruit-blackcurrant fruit leather produced. The outputs of the data-derived analysis from this programme were then analysed using multiple regression and ANOVA analysis was used to identify the significance of the developed models. The data were then plotted using three dimensional surface plots so that the interaction of the different parameters could be observed.
This analysis showed that the optimum combination for the manufacture of kiwifruit-blackcurrant fruit leather was 81.02% kiwifruit purée, 8.95% blackcurrant purée, 10% sugar and 0.03% pectin.
Central composite analysis was then used to investigate the effect of drying conditions; temperature, time and sample thickness on this optimum ingredient combination. Eighteen different combinations of drying time, temperature and sample thickness suggested by the programme were then applied to the optimised fruit leather mixture and the outcomes analysed for final moisture contents, water activity, colour, texture and ascorbic acid contents of this green kiwifruit-blackcurrant fruit leather dried at each set of conditions.
2
thickness of 8.00 mm. Under these conditions the predicted responses were moisture content of 33.72 g/100 g DM; water activity, 0.67; L*, 28.25; a*, 6.89; b*, 1.08; chroma, 6.57; puncturing force, 0.19 N/mm and ascorbic acid content 164.51 mg/100 g DM.
Sensory analysis showed that the optimised recipe was appreciated by almost all panellists and this was confirmed by their overall liking score for this recipe. The flavour and colour of the fruit leather were the most important characteristics appreciated by panellists. The very dark colour of fruit leather made from blackcurrant alone was the most disliked feature. The optimised recipe derived from the data generated by response surface methodology using a mixture of kiwifruit and blackcurrant purée and processed using optimum conditions produced the most acceptable colour and texture and received the highest overall liking score. The textural property, which was critical for customer acceptance in the taste test was determined by measuring the force needed to puncture the fruit leather. The puncturing force of fruit leather increased with increasing pectin content, increasing drying temperature and decreasing sample thickness.
Overall, the fruit leather made from a combination of kiwifruit and blackcurrant purées using the most efficient combination of materials and processing conditions was identified by response surface methodology methods. The optimised fruit leather was soft and tasty and had the highest overall liking of all the fruit leathers tested in a sensory evaluation experiment.
3
Acknowledgements
I would like to express my sincere appreciation to my supervisor, Professor Geoffrey Savage, for his guidance, supervision, encouragement and support. Thank you too for his useful comments, remarks and encouragement through my learning process of this master thesis.
Special sincere thanks to my associate supervisor, Dr Lemuel Diamante, for his guidance and willingness to help me to set up the experiment. Thank you too for your considerable help with initial analysis of the data and the plotting of three dimensional graphs of the data from this experiment.
I would like to take this opportunity to acknowledge and thank Leo Vanhanen and Dr. Sue Mason for their invaluable help and technical support in helping me run the experiments.
I thank all my schoolmates and friends at Lincoln University for their help and suggestions. I am very thankful to the Food Science Department students: Qi Zhu and Jiongrong Gao for helping me with the sensory evaluation during my research.
6
Tables
Table 2.1 Summary of published research for fruit used and basic characteristics of fruit leather ... 16
Table 2.2 Summary of published research and basic characteristics of fruit leather made from two fruits ... 18
Table 3.1 Limits of the parameters and responses for optimization using response surface methodology ... 25
Table 3.2 Coding for the Box-Behnken design ... 26
Table 3.3 The output from Stat-Ease programme showing the 16 different samples required by the Box-Behnken response surface methodology design
(Note: −1 = low level; 0 = middle level; 1 = high level) ... 26
Table 3.4 The formulation of sixteen, 1 kg green kiwifruit – blackcurrant purée mixes ... 27
Table 3.5 Mean composition of the two fruit purée mixes used to make the fruit leathers ... 30
Table 3.6 Mean response values of the Box–Behnken design experiments on the qualities of kiwifruit-blackcurrant fruit leather using different levels of sugar, blackcurrant purée and pectin, using 70°C drying temperature, 16 hours drying time
and 6 mm sample thickness ... 31
Table 3.7 Adequacy of the model tested all responses ... 32
Table 3.8 Predicted values for responses of kiwifruit-blackcurrant fruit leather
at optimized combinations ... 44
Table 3.9 Coding for the central composite design ... 46
Table 3.10 The output from Stat-Ease programme showing the 16 different samples required by the Box-Behnken response surface methodology design
(Note: −1 = low level; 0 = middle level; 1 = high level) ... 46
Table 3.11 Limits of the parameters and responses for optimization using a
central composite design ... 47
Table 3.12 Mean response values of the central composite design experiments on the qualities of kiwifruit-blackcurrant fruit leather using different levels of drying temperature, drying time and sample thickness using 10% sugar, 8.95%
7
Table 3.13 Adequacy of the model tested for all central composite design responses ... 51
Table 3.14 Predicted values for responses of kiwifruit-blackcurrant fruit leather at optimized conditions ... 71
Table 3.15 Proximate analysis and colour measurements of the final optimized product which was performed under the set of optimized combinations of 10% sugar, 8.95% blackcurrant purée and 0.03% pectin and optimized drying conditions at 14.73 hours drying time at 67.3°C with a sample thickness of 8 mm. ... 73
Table 3.16 Predicted and experimental values for the green kiwifruit-blackcurrant fruit leather at optimized conditions ... 73
Table 5.1 The formulation of different types of fruit leather samples ... 79
Table 5.2 Processing conditions of the different types of fruit leather samples ... 80
Table 5.3 Scores and attributes of fruit leather ... 82
8
Figures
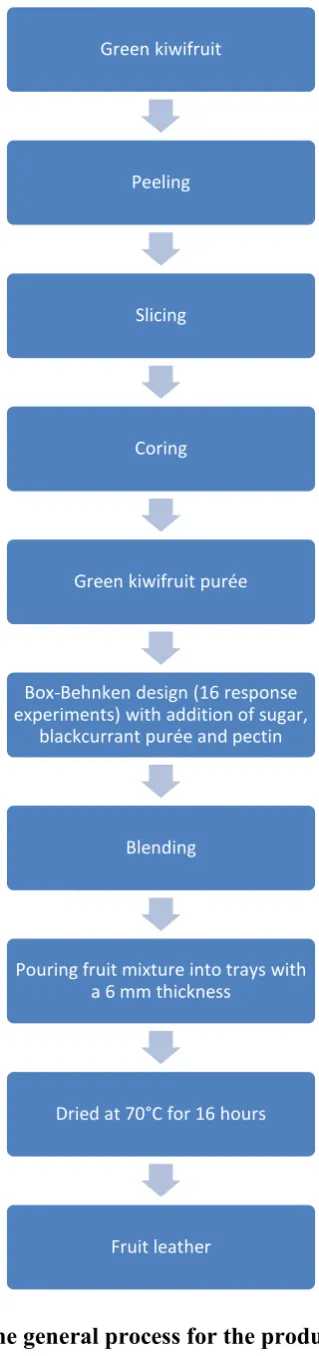
Figure 3.1 Flow diagram of the general process for the production of fruit leather in
the Box-Behnken design experiment ... 28
Figure 3.2 Response analysis for moisture content (g/100 g DM) of green kiwifruit-blackcurrant fruit leather, as affected by sugar and pectin levels,
with a blackcurrant purée level of 6% ... 34
Figure 3.3 Response analysis for water activity of green kiwifruit-blackcurrant fruit leather, as affected by sugar and blackcurrant purée levels, with the pectin
level kept at 2% ... 35
Figure 3.4 Response analysis for L* of green kiwifruit-blackcurrant fruit leather, as affected by blackcurrant purée and pectin levels, with the sugar level kept
at 5% ... 36
Figure 3.5 Response analysis for a* of green kiwifruit-blackcurrant fruit leather, as
affected by blackcurrant purée and pectin levels, and with the sugar level kept at 5% ... 37
Figure 3.6 Response analysis for b* of the green kiwifruit-blackcurrant fruit leather: (a) as affected by sugar and blackcurrant purée levels; (b) sugar and pectin levels; and (c) blackcurrant purée and pectin levels, with the third factor set at the middle level ... 40
Figure 3.7 Response analysis for chroma of the green kiwifruit-blackcurrant fruit leather, as affected by blackcurrant purée and pectin levels, with the sugar level kept
at 5% ... 41
Figure 3.8 Response analysis for the puncturing force of the green kiwifruit-blackcurrant fruit leather, as affected by sugar and sugar level, with the blackcurrant purée level kept at 6% ... 42
Figure 3.9 Response analysis for ascorbic acid content of green kiwifruit-blackcurrant fruit leather, as affected by sugar and pectin levels, with the blackcurrant purée level kept at
6% ... 43
Figure 3.10 Bar graph representing individual desirability and combined desirability by a Box–Behnken design ... 45
Figure 3.11 Flow diagram of the general process for the production of fruit leather in
the central composite design experiment ... 49
9
time and sample thickness; and (c) drying temperature and sample thickness, with the
third factor set at the middle level... 55
Figure 3.13 Response analysis for water activity of green kiwifruit-blackcurrant fruit leather as affected by: (a) drying time and drying temperature; (b) drying time and sample thickness; and (c) drying temperature and sample thickness, with the third factor set at the middle level ... 58
Figure 3.14 Response analysis for L* of green kiwifruit-blackcurrant fruit leather, as affectec by: (a) drying time and drying temperature; (b) drying time and sample thickness; and (b) drying temperature and sample thickness, with the third factor
set at the middle level ... 61
Figure 3.15 Response analysis for a* of green kiwifruit-blackcurrant fruit leather, as affected by: (a) drying time and drying temperature; (b), drying time and sample thickness; and (c) drying temperature and sample thickness, with the third factor set at
the middle level ... 64
Figure 3.16 Response analysis for b* of green kiwifruit-blackcurrant fruit leather, as
affected by drying time and drying temperature ... 65
Figure 3.17 Response analysis for chroma of green kiwifruit-blackcurrant fruit leather as affected by: (a) drying time and drying temperature; (b) drying time and sample thickness; and (c) drying temperature and sample thickness, with the third factor set at
the middle level ... 68
Figure 3.18 Response analysis for puncturing force of green kiwifruit-blackcurrant
fruit leather, as affected by drying temperature and sample thickness ... 69
Figure 3.19 Response analysis for puncturing force of green kiwifruit-blackcurrant fruit leather, as affected by drying temperature and sample thickness ... 70
Figure 3.20 Bar graph representing individual desirability and combined desirability by
a central composite design ... 72
Figure 5.1 The tray which contained the fruit purée mixture ... 79
Figure 5.2 Five types of previously prepared fruit leathers used for the sensory evaluation ... 80
Figure 5.3 Booth presentation for the consumer-type sensory trial (a) ... 81
10
Chapter 1
Introduction
Fresh fruit, such as green kiwifruit (Actinidia deliciosa ‘Hayward’) and blackcurrant (Ribes nigrum
L., Grossulariceae) have short harvest seasons and are unstable even when stored under refrigerated conditions; therefore, making these fruits into fruit leathers is a way to preserve the fruit and retain important nutrients such as vitamin C, polyphenols and anthocyanins. These nutrients are becoming important selling points for both fresh and processed foods. There are a number of papers which
describe making fruit leathers from a single fruit (Chan and Cavaletto, 1978; Irwandi et al., 1998;
Vijayanand et al., 2000; Maskan et al., 2002; Gujral and Brar, 2003; Huang and Hsieh, 2005;
Jaturonglumlert and Kiatsiriroat, 2010; Vatthanakul et al., 2010; Chowdhury et al., 2011; Demarchi
et al., 2013; Sharma et al., 2013). Only a few authors (Bains et al., 1989; Kumar et al., 2010;
Diamante et al., 2013a) have used two different fruits to make a composite fruit leather. Combining
two fruits in one fruit leather product combines the advantages of the individual fruits. In addition, the strong purple reddish colour of the blackcurrants will dominate the colour of the fruit leather since the green colour of kiwifruit tends to be lost during drying.
Fruit leather, also called a fruit bar or a fruit slab, is a dehydrated, fruit-based, confectionery, dietary product that is often eaten as a sweet, cooked as a sauce or used as an ingredient in beverages (Ashaye
et al., 2005; Raab and Oehler, 1999). Because fruit leathers are made from natural fruits they often contain fewer calories than many other snacks and are often considered to be a healthy snack
(Phimpharian et al., 2011).
The important properties of mixed fruit leathers include moisture content, water activity, colour,
texture and vitamins (Diamante et al., 2013a). Both moisture content and water activity are the main
factors which affect the shelf-life and food safety of fruit leathers (Fontana, 2008; Tapia et al., 2012).
Fruit leathers are easy to pack and store because of their low moisture content (Huang and Hsieh, 2005). The colour and texture of fruit leathers are also important factors which can influence consumers when they purchase the product. A dried product containing a significant amount of ascorbic acid makes the product more nutritious.
The properties of kiwifruit-blackcurrant fruit leather can be affected by a great many factors, such as the different levels of sugar, blackcurrant purée and pectin used to make the product. In addition, different drying conditions (including temperature, time and sample thickness) can also have a large influence on the final properties of the fruit leather. For example, adding sugar would give a sweet taste to the dried product and reduce the sourness of the product. The addition of blackcurrant purée to the fruit leather would also enhance the colour and nutritional characteristics of the dried final
product. Moreover, the pectin would enhancethe physicochemical and sensory qualities of the fruit
11
The successful manufacture of fruit leather involves changing the proportions of the fruit added, sugar and pectin, to achieve an efficient production of a product that has a good appearance and taste characteristics. In addition, temperature, time and thickness of the product can have a considerable effect on the quality of the final product. Investigating the effect of changing each parameter in turn to determine its effect on the final product is a very laborious and expensive process. Response surface methodology (RSM) is a relatively new statistical method that can be used to reduce the number of experiments that have to be carried out to understand the interactions between all the factors. The results from RSM analysis can identify the optimum processing conditions.
Earlier experiments have shown that the measurement of moisture (Perera, 2005) and water activity (Fontana, 2008) are important in determining the stability and shelf-life of the dried product (Azeredo
et al., 2006). Measurement of the puncturing force (Huang and Hsieh, 2005) gives information about the texture of the product while measurement of the CIE colour values gives some data on its visual appeal (Clydesdale, 1993). Determination of the vitamin C content of the dried product gives an indication of the heat processing of the product and is useful data to promote the healthy
characteristics of the dried fruit product (Diamante and Yamaguchi, 2012; Diamante et al., 2013a).
Chemical analysis of a food product can give information about its safety and potential shelf-life
(Huang and Hsieh, 2005; Raab and Oehler, 1999; Phimpharian et al., 2011; Gujral and Khanna, 2002)
but it must be remembered that the ultimate test occurs when the product is eaten. Sensory evaluation combines an analysis of the colour, taste and texture, which are essential to the successful development of a new product (Stone and Sidel, 2010).
13
inactivating the enzymes by heating. Sugar and sodium bisulphite were added to the purées before they were dried in a forced temperature oven until they reached to 12 - 13% moisture content.
Irwandi et al. (1998) investigated the effect of the type of packaging materials with regards to the
physicochemical, microbiological and sensory characteristics of durian fruit leather during storage. They processed durian leather from durian aril after blanching in a water bath at 85 – 100°C for five minutes and then blending the cooked fruit with glucose syrup solid (GSS), hydrogenated palm oil, sucrose and soy-lecithin. The mixture was formed into 1.2 mm thick sheets and then placed in either an oven or in a cabinet dryer for dehydrating. It took 12.6 hours to dry at 50°C in the oven and 10 hours at 52.5°C in the cabinet dryer.
Vijayanand et al. (2000) uncovered the storage stability of guava leather prepared using a new process.
The guavapurée was prepared by washing ripe fruit, then crushing and extracting them using a pulper.
A pectolytic enzyme, Rohapect D5 L, was added to the guava purée at 40°C. After two hours, guava juice was obtained by pressing the purées; this was then mixed with maltodextrin, sucrose, soluble starch, wheat flour, pectin, and potassium metabisulphite until it reached total soluble solids of 25° Brix. The mixture was then spread on stainless steel trays, which were smeared beforehand with
glycerol, at the rate of 12 kg/m2, and then dried at 50°C and 12% relative humidity (RH) in a
cross-flow hot air dryer with a 2.5 m/s cross-flow rate, to a final moisture content of 14 to 15%.
Maskan et al. (2002) investigated factors such as air temperature, sample thickness and air velocity in
hot air drying and sun drying for the preparation of grape leather. The grapes were from Turkey. The grape purée was made by washing the grapes to remove dirt, leaves and foreign materials and then
crushing and pressing them manually. Seven g of natural earth (70% CaCO3) was added to the juice
per litre to reduce the acidity and clarify the juice. The mixture was boiled for three to five minutes in order to inactivate the enzymes that cause colour changes. The foam formed on the surface of the juice during boiling was removed. The juice was then separated from the calcium tartrate precipitate by filtration and centrifugation to obtain the final clarified juice, which had a pH of 7.6 and 20º Brix. The total juice was then divided into two parts. A 3/4 part of juice was boiled again for 30 minutes with continued stirring to obtain a concentrated juice of 40° Brix. A wheat starch-juice mixture (starch dissolved in a 1/4 part of juice) was added to the boiling juice before boiling for another four minutes until it reached a concentration of 4 g/100 g of starch in the total fresh, clarified juice. The cooked grape juice-starch mixture was evenly spread on an 80 mm diameter disk of cloth and dried under hot air drying conditions or in direct sunlight. The concentrated grape juice mixtures were dried until there was no further weight change. For the sun-dried products, the samples were dried under direct sunlight for 14 hours.
14
trays measuring 2550 mm × 130 mm and 20 mm deep and dried in a cabinet dryer at 60 ± 1°C and with a relative humidity of 15%.
Huang and Hsieh (2005) investigated the physical properties, sensory attributes and consumer preferences of pear fruit leather. The pear juice was from the USA. They prepared pear leather with 18 different formulations, homogeneously blending pectin, water and corn syrup with different levels of pear juice concentrate. They mixed distilled water (23°C) into the pre-blended mixture of pear concentrate and corn syrup in a blender for one minute (both at 5°C), and then pectin was added to prevent the formation of lumps. They blended every second 400 g batch of the final mixture for another three minutes and then poured the treated batch into clean plastic flat-bottomed 70 × 100 mm containers. They left the containers on the bench at 23°C until the mixture became evenly distributed (approximately 1 minute). They made the final leathers by placing the containers in a convection oven at 70°C for eight hours, with an air velocity in 0.4 m/s.
Jaturonglumlert and Kiatsiriroat (2010) prepared longan leather by combining convective and far -infrared drying systems. The longan fruit were from Thailand. They made longan leather by uniformly spreading 100 g of longan purée in a tray and placing it in a drying chamber. The air velocity in the drying chamber was between 0 and 4.5 m/s and the temperature ranged from 30 to 80°C. A far-infrared ceramic heater with an intensity level control inside the chamber was used to heat the air. The sample for drying was kept in a tray under the IR heater. The sample for radiant heating was prepared by inserting a K-type thermocouple into the bottom of the purée layer. The combined convective and far-infrared drying experiment was organized at five temperatures with a distance between the sample and the infrared heat source of 100 - 300 mm. The inlet air temperature and velocity were maintained at 30°C and 0.5 m/s, respectively. The final moisture content of the sample was 14% DM.
Vatthanakul et al. (2010) investigated product development of gold kiwifruit leather using a quality
function deployment approach. The gold kiwifruit fruit were from New Zealand. The basic ingredients of this fruit leather were pectin, sugar, salt, water, citric acid and glucose syrup. Nine formulations of fruit leather were produced using different combinations of pectin and glucose. Fruit purée and glucose syrup were mixed in a blender for two minutes before adding the other ingredients. The ingredients were mixed for an additional two minutes and immediately spread onto stainless steel drying trays when the blend was consistent. The trays were then covered with a polyethylene sheet to prevent the fruit leather from sticking to the trays during drying. They dried the gold kiwifruit leather using hot air at 70 ± 1°C for 12 hours in a batch tray dryer.
Demarchi et al. (2013) processed apple leathers at different temperatures. The apples were from
15
Sharma et al. (2013) standardised a formula for the preparation of wild apricot fruit leather. The wild
apricot fruits were from India. They washed the apricots and then heated them for five to seven minutes in a stainless steel pan with water before passing the fruits through a pulper to extract the purée. The purée was boiled over a low flame until its volume reduced to half and it was then mixed with different quantities of sugar. Weighed quantities of pectin (0.2, 0.3 and 0.4%) were sprinkled over the purée uniformly and mixed continuously mixing until smooth. The treated mixture was poured into aluminium trays (smeared with butter) in layers about 4 - 5 mm thick and the trays were then placed in a mechanical dehydrator at 55 ± 2°C for about six hours.
Safdar et al. (2014)investigated the nutritive and organoleptic characteristics of guava leather as
influenced by storage period and packing materials. They washed the guava with distilled water to remove dirt, dust, pesticide residues and microflora from the surface of the fruits. The guava fruits were then weighed, peeled and cored. The flesh of each variety was cut into small pieces with stainless steel knives and a pulp was prepared using an electric blender. The guava pulp was pasteurised at 85°C for 10 minutes in a pan placed in a water bath with 10% sugar and 0.1% potassium metabisulphite added. The pulp was then cooled and spread on polyethylene sheet in a 6 mm thick layer in the trays. Drying was carried out in hot air oven at 70°C for 10 hours.
Valenzuela and Aguilera (2015a, b) investigated the effects of different factors on the stickiness of apple leathers and the effect of maltodextrin on the hygroscopicity and crispness of the apples. The apples were from Chile. They spread the apple purée as a thin layer in a 2 mm frame placed in an aluminium tray. The purée was levelled using a glass rod to ensure the thickness of the purée was uniform. The aluminium tray had previously been covered with a silicone sheet to prevent the apple leather from sticking to the tray during drying. The apple leathers were dried at 60 ± 1°C to a final moisture content of approximately 0.12 g water/g DM.
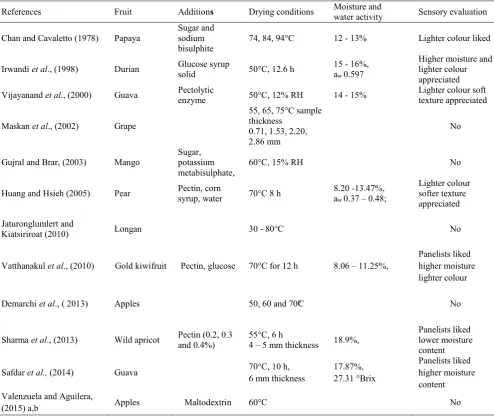
The additions and drying conditions, qualities and sensory data of single fruit leathers are shown in Table 2.1. Sugar and pectin were usually added to the fruit leather. Fruit leathers were usually dried at 50, 60 to 70°C from 8 to 12 hours. 70°C was most commonly used. The moisture content of final
product were between 8 and 19%. Sensory evaluations (Chan and Cavaletto, 1978; Irwandi et al., 1998;
Vijayanand et al., 2000; Huang and Hsieh, 2005; Vatthanakul et al., 2010; Sharma et al., 2013; Safdar
16
Table 2.1 Summary of published research for fruit used and basic characteristics of fruit leather
References Fruit Additions Drying conditions Moisture and water activity Sensory evaluation
Chan and Cavaletto (1978) Papaya Sugar and sodium
bisulphite 74, 84, 94°C 12 - 13% Lighter colour liked
Irwandi et al., (1998) Durian Glucose syrup solid 50°C, 12.6 h 15 - 16%, a
w 0.597
Higher moisture and lighter colour appreciated Vijayanand et al., (2000) Guava Pectolytic enzyme 50°C, 12% RH 14 - 15% Lighter colour soft texture appreciated
Maskan et al., (2002) Grape
55, 65, 75°C sample thickness
0.71, 1.53, 2.20, 2.86 mm
No
Gujral and Brar, (2003) Mango Sugar, potassium
metabisulphate, 60°C, 15% RH No
Huang and Hsieh (2005) Pear Pectin, corn syrup, water 70°C 8 h 8.20 -13.47%, a
w 0.37 – 0.48;
Lighter colour softer texture appreciated
Jaturonglumlert and
Kiatsiriroat (2010) Longan 30 - 80°C No
Vatthanakul et al., (2010) Gold kiwifruit Pectin, glucose 70°C for 12 h 8.06 – 11.25%, Panelists liked higher moisture lighter colour
Demarchi et al., ( 2013) Apples 50, 60 and 70°C No
Sharma et al., (2013) Wild apricot Pectin (0.2, 0.3 and 0.4%) 55°C, 6 h 4 – 5 mm thickness 18.9%, Panelists liked lower moisture content
Safdar et al., (2014) Guava 70°C, 10 h, 6 mm thickness 17.87%, 27.31 °Brix Panelists liked higher moisture content Valenzuela and Aguilera,
(2015) a,b Apples Maltodextrin 60°C No
2.1.2 Composite fruit leather
Several authors (Bains et al., 1989; Kumar et al., 2010; Diamante et al., 2013a, Akhtara et al., 2014;
Khan et al., 2014) used two different fruits to make a composite fruit leather. Combining two fruits in
one fruit leather product combines the advantages of the individual fruits.
Bains et al. (1989) processed apple-apricot leather using a fruit purée containing 82% apple purée,
17
Kumar et al. (2010) made blended guava-papaya leathers by mixing the pulps of guava and papaya in
different ratios. Both the papaya and guava were washed, peeled and chopped into pieces. The seeds of the papaya were discarded and the fruit pieces were crushed in a mixer to make papaya pulp. The guava pulp was prepared by passing guava slices through a superfine pulper/finisher. The blended papaya and guava fruit pulps were then mixed in different ratios. Potassium metabisulphite (0.2%) was added as a preservative before the mixture was poured as a 10 mm thick layer into stainless steel trays, previously smeared with glycerol and then dried in a cross-flow cabinet dryer at 60°C.
Diamante et al. (2013a) prepared fruit leather using different levels of apple pulp, apple juice
concentrate, blackcurrant concentrate and pectin powder, to obtain various fruit leather products to determine the effects of these three factors on various physicochemical and nutritional qualities. Approximately 315 g of the purée mixture was poured into aluminium pans with a non-stick surface (10 mm × 200 mm × 30 mm). The samples were then dried for 16 hours in a hot air dryer at 70°C with an air velocity of 200 mm/s.
Akhtara et al. (2014) evaluated the effect of different levels of apple pulp, date pulp, milk powder,
pectin and starch on the physicochemical quality, sensory quality and shelf-life of apple-date fruit leather. They mixed all ingredients uniformly in a container and then heated the mixture at 80 – 100°C, with stirring, until 68 to 70°C was reached. The concentrated product was then spread into a tray coated with oil. The top surface of the mixture was levelled and then kept at room temperature (28 – 32°C ) to allow the mixture to set. The leather was then cut to a suitable shapes and sizes and stored at ambient temperature.
Khan et al. (2014) dipped olive fruit in 2% sodium hydroxide for 36 hours in order to remove the
bitterness. The olives and apples were then washed, peeled, trimmed, cut and dipped in a 1% citric acid solution to prevent oxidation. The fruit was then blended to a fine pulp. After making the fruit leather it was wrapped in aluminium foil and packed into air-tight plastic bags.
The additions and drying conditions, qualities and sensory data of composite fruit leathers are shown in Table 2.2. Sugar and pectin were usually added to composite fruit leathers. Fruit leathers were usually dried at 60 and 70°C . The moisture content of final product ranged from 13% to 30%. Sensory
evaluations (Akhtara et al., 2014; Khan et al., 2014) showed that panelists liked higher moisture and
19
reactions (Leung, 1984). The availability of water for microbial development, enzyme activity or chemical reactions, is a crucial component and determines the shelf-life of dried items or intermediate moisture food items (Perera, 2005).
Azeredo et al. (2006) found that a combination of low water activity (0.62), low pH (3.8) and a
moisture content of 17.2% was required for mango fruit leathers to be shelf-stable for at least six months without the need for chemical preservation. Low moisture contents can inhibit microbial growth and prolong the shelf-life of a product. However, the very low levels of moisture content in fruit leathers negatively affected the texture quality (Huang and Hsieh, 2005). Generally, the water activity is lower when the moisture content is lower. The thermodynamic properties and sorption equilibrium of fruit leather were studied by Kaya and Kahyaoglu (2005). They showed that water activity was one of the most important quality factors for long-term storage because changing the water activity directly affected all chemical and microbial deterioration reactions.
2.2.2 Colour
Colour is one of the first characteristics noticed in food and in early times it was evaluated only subjectively, or with the use of colour comparison charts. The L* (lightness coefficient), a* and b* scale is recognised to present a better discrimination between produced with little colour variation within the darker area of the colour area and gives excellent discrimination for saturated colours
(Barreiro et al., 1997). L*ranges from 0 (black) to 100 (white) on the vertical axis. The a* value
represents the purple red (positive a* value) and blue-green (negative a* value) is on the horizontal axis. The b* represents yellow (positive b* value) and blue (negative b* value). For further manipulation, the chroma aspects of colour are used. Chroma achieves an index somewhat analogous to colour saturation and intensity. Chroma represents the hypotenuse of a right triangle made by joining points (0, 0), (a *, b*) and (a*, 0) (McGuire, 1992).
Colour is absolutely a critical quality attribute on the food items and bioprocessing industries, and influences consumers' selections and preferences. The colour of food items is governed with the chemical, biochemical and microbial and bodily alterations that occur during development, maturation,
postharvest managing and processing of the foods (Pathare et al., 2013).
Clydesdale (1993) considered that colour had a pivotal role in food choice, food preference/acceptability and influence taste thresholds, sweetness perception and enjoyment of consumers.
2.2.3 Texture
The textural properties of foods are critical for customer acceptance. Textural qualities such as toughness, chewiness, hardness and stickiness of fruit leathers were generally affected by the moisture content and drying temperature (Man and Sin, 1997). Huang and Hsieh (2005) found a positive correlation between texture attributes and consumer acceptance of fruit leathers made from pears. The addition of other ingredients, such as sugar and pectin, can also affect the texture of fruit leathers
(Phimparian et al., 2011). The textural property of fruit leather is determined by measuring the force
22
controllable variables. Through the multivariate optimisation procedure, the responses as well as components are two sorts of variables. The responses would be the dependent variables. The levels of
the aspects are the independent variables that determine the response values (Ferreira et al., 2007a;
Ferreira et al., 2007b).
The methodology permits reduction of the number of experimental trials required to judge the interaction impact amongst the variables inside the response and provide a massive degree of information, consequently, conserving time and labour. Response surface methodology is frequently
employed for optimizing the whole method of dehydrating fruit products (King and Zall 1992; Pua et
al., 2010; Mercali et al. 2011; Diamante and Yamaguchi 2012, 2013). Box-Behnken design and central
composite design are commonly used for response surface methodology experiments.
In essence, the central composite and Box-Behnken patterns are two procedures that enable a reduction in the range of experimental factors, but nonetheless provide a promising prediction of capacity. It has previously been recognized the risk of applying response surface methodology designs is useful to quantitatively review the interactions amid numerous independent elements and likewise to suggest an optimum formulation. The number of runs (N) required for the development of Box–Behnken design
is defined as N = 2k (k - 1) + C0, (where k is number of factors and C0 is the number of central points).
For comparison, number of experiments for a central composite design is N = 2k + 2k + C0 (Ferreira
et al., 2007a; Ferreira et al., 2007b; Wei et al., 2013).
Box–Behnken design is a spherical, rotatable, or virtually rotatable, second-order design. It is primarily based with a three-level incomplete factorial structure consisting of the centre level and center factors
of the edges of the cube. It could be regarded as a few interlocking 22 factorial types in addition to a
centre position. It ought to be emphasised that despite the fact that the look might be derived from a dice, it can be spherical, therefore the vertices on the cube are not coated by the style and, therefore, prediction all-around these factors is undoubtedly an extrapolation and may be avoided. The quantity
of experimental points (N) is outlined with the expression N = 2k (k - 1) + C0, where k could be the
number of variables and C0 could be the amount of centre details (Ferreira et al., 2007b; Myers et al.,
2009). (Ferreira et al., 2007b; Myers et al., 2009; Zolgharnein et al., 2013). Diamante et al. (2013a)
established the effects of different levels of apple juice concentrate, blackcurrant concentrate and pectin on the moisture content, water activity, colour, texture and ascorbic acid content of apple-blackcurrant fruit leather using the Box–Behnken design. A response surface methodology optimisation using the Box–Behnken design was carried out on dried apple-blackcurrant cubes using different drying temperatures (50 to 70°C), blackcurrant concentrate levels (10 to 30%) and soaking times of (5 to 55 minutes) (Diamante and Yamaguchi, 2013). They found that the drying of blackcurrant-infused apple cubes consisted of only one falling rate period with no constant rate period.
Central composite design consists of a two degree factorial design getting 2K points, where K is
definitely thequantityof factors, a star design with 2K points to offer the design the ability of curvature
description and centre point which isusuallyreplicatedto offer a measurement of reproducibility and
26
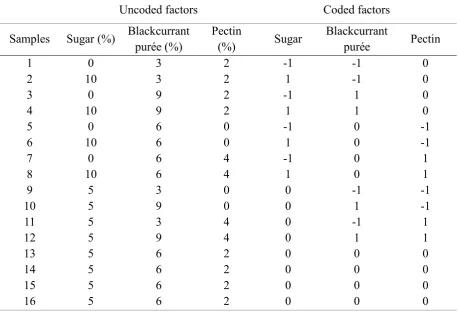
Table 3.2 Coding for the Box-Behnken design
Code Independent
variables Factor Low -1 Middle 0 High +1
Sugar (%) X1 0 5 10
Blackcurrant (%) X2 3 6 9
Pectin (%) X3 0 2 4
Table 3.3 The output from Stat-Ease programme showing the 16 different samples required by the Box-Behnken response surface methodology design (Note coding: −1 = low level; 0 = middle level; 1 = high level)
Uncoded factors Coded factors
Samples Sugar (%) Blackcurrant purée (%) Pectin (%) Sugar Blackcurrant purée Pectin
1 0 3 2 -1 -1 0
2 10 3 2 1 -1 0
3 0 9 2 -1 1 0
4 10 9 2 1 1 0
5 0 6 0 -1 0 -1
6 10 6 0 1 0 -1
7 0 6 4 -1 0 1
8 10 6 4 1 0 1
9 5 3 0 0 -1 -1
10 5 9 0 0 1 -1
11 5 3 4 0 -1 1
12 5 9 4 0 1 1
13 5 6 2 0 0 0
14 5 6 2 0 0 0
15 5 6 2 0 0 0
16 5 6 2 0 0 0
3.4.1 Preparation of green kiwifruit-blackcurrant purée mixture
Sixteen kg of firm, ripe, green kiwifruit (Actinidia deliciosa ‘Hayward’) were obtained on 15 May
27
added to the kiwifruit purée; white sugar (Chelsea Refinery, Auckland, NZ), high methylester, slow set pectin powder (Classic AF401, Herbsteith & Fox KG., Neuenbürg, Germany) and blackcurrant purée (Barker’s of Geraldine, South Canterbury, NZ) pectin following the formulations shown in Table 3.4. The blackcurrant purée was a special purée product that had also been sieved to remove seeds and large skin pieces and had been prepared without any additives, such as sugar and pectin. The blackcurrant purée was stored at -20°C and was thawed at 4°C overnight before it was used to make the fruit leather mixture.
A total of 1 kg purée mixture was made for each of the 16 different combinations of ingredients. The purée mixtures were poured into a 300 × 200 × 40 mm metal tray with a non-stick coating. Approximately 390 g of the purée mixture filled the tray. The purée was dried at 70°C and a constant air flow of 0.20 m/s perpendicularly for 16 hours with a 6 mm starting sample thickness. A general process flow chart for the Box-Behnken design experiment is shown in Figure 3.1.
Table 3.4 The formulation of sixteen, 1 kg green kiwifruit – blackcurrant purée mixes
Samples Sugar (g) Blackcurrant purée (g) Pectin (g) kiwifruit purée Green
(g)
1 0 30 20 950
2 100 30 20 850
3 0 90 20 890
4 100 90 20 790
5 0 60 0 940
6 100 60 0 840
7 0 60 40 900
8 100 60 40 800
9 50 30 0 920
10 50 90 0 860
11 50 30 40 880
12 50 90 40 820
13 50 60 20 870
14 50 60 20 870
15 50 60 20 870
28
Figure 3.1 Flow diagram of the general process for the production of fruit leather in the Box-Behnken design experiment
Green kiwifruit
Peeling
Slicing
Coring
Green kiwifruit purée
Box-Behnken design (16 response experiments) with addition of sugar,
blackcurrant purée and pectin
Blending
Pouring fruit mixture into trays with a 6 mm thickness
Dried at 70°C for 16 hours
29
3.4.2 Chemical analysis
3.4.2.1 Moisture content
The moisture content of the fruit leather samples was determined in triplicate using an oven (Watson
Victor, Ltd., New Zealand) established at 105°C for 16 hours using Method 984.25 (AOAC, 2002).
3.4.2.2 Water activity
Water activity was determined in triplicate for each sample. The fruit leather samples were cut into approximately 2 mm × 2 mm pieces and placed in an Aqua Lab water activity meter CX-2 (Decagon Devices, Inc., Washington, DC, USA). The results were expressed as mean water activity per treatment at room temperature (20°C).
3.4.2.3 Colour determination
Colour values (CIE, L*a*b*) of the different fruit leathers were determined using a Reflectance
Chroma Meter CR 210 (Minolta Co. Ltd., Osaka, Japan). The instrument was calibrated before each
measurement using a white ceramic tile (L* = 98.06, a* = −0.23, b* = 1.88). Five measurements were
taken from the different areas of each sample. The chroma value of the samples were calculated
utilizing the equation chroma = (a*2+b*2)1/2, where a* and b* are colour values of the samples.
3.4.2.4 Texture
The texture analysis method was adapted from Diamante et al. (2013a). The textural properties of the
fruit leather were determined by measuring the force necessary to puncture the fruit leather sheet making use of a texture analyser (Texture Analyzer Model: TA-XT plus, Serial No: 10 781, Stable Micro System, Surrey, UK) equipped with a 5 kg load cell. A heavy duty platform (HDP/90) which had a hole in the centre which was used to assist in the alignment the fruit leather sheet. A five hundred gram stainless steel cylinder with a hole in the centre was placed on top of the sample to carry it in place. A 2 mm cylindrical probe was used to puncture the sample. The test speed was set to 1.0 mm/s, the trigger force was set at 5 g and the travel distance of the probe was set to 10.0 mm. The 2 mm diameter probe was brought down to within 2 mm of the sample then the test was started and run until it punctured the sample. The different fruit leathers were measured 12 times at different points on the fruit leather samples. The collected data for puncturing force (kg) was analysed in XTRAD Dimension software from Stable Micro Systems and were expressed as mean values per sample. The data for puncturing force (kg) were converted to Newtons (n) using a factor of gravitational acceleration (g) of
9.80665 m/s2. As the different samples had different variable thicknesses, the mean thicknesses of each
sample were measured using a digital Vernier calliper (Insize Tools, Suzhou, China). The mean thickness was used to calculate the puncturing force per unit thickness (N/mm) for each sample.
3.4.2.5 Ascorbic acid
The method of Diamante et al. (2013a) was used to measure the ascorbic acid of the fruit leather.
31
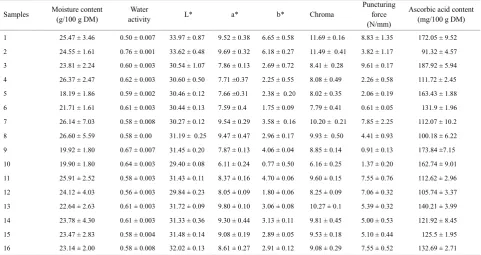
Table 3.6 Mean response values of the Box–Behnken design experiments on the qualities of kiwifruit-blackcurrant fruit leather using different levels of sugar, blackcurrant purée and pectin, using 70°C drying temperature, 16 hours drying time and 6 mm sample thickness
Samples Moisture content (g/100 g DM) activity Water L* a* b* Chroma Puncturing force (N/mm)
Ascorbic acid content (mg/100 g DM)
1 25.47 ± 3.46 0.50 ± 0.007 33.97 ± 0.87 9.52 ± 0.38 6.65 ± 0.58 11.69 ± 0.16 8.83 ± 1.35 172.05 ± 9.52 2 24.55 ± 1.61 0.76 ± 0.001 33.62 ± 0.48 9.69 ± 0.32 6.18 ± 0.27 11.49 ±0.41 3.82 ± 1.17 91.32 ± 4.57 3 23.81 ± 2.24 0.60 ± 0.003 30.54 ± 1.07 7.86 ± 0.13 2.69 ± 0.72 8.41 ±0.28 9.61 ± 0.17 187.92 ± 5.94 4 26.37 ± 2.47 0.62 ± 0.003 30.60 ± 0.50 7.71 ±0.37 2.25 ± 0.55 8.08 ± 0.49 2.26 ± 0.58 111.72 ± 2.45 5 18.19 ± 1.86 0.59 ± 0.002 30.46 ± 0.12 7.66 ±0.31 2.38 ±0.20 8.02 ± 0.35 2.06 ± 0.19 163.43 ± 1.88 6 21.71 ± 1.61 0.61 ± 0.003 30.44 ± 0.13 7.59 ± 0.4 1.75 ± 0.09 7.79 ± 0.41 0.61 ± 0.05 131.9 ± 1.96 7 26.14 ± 7.03 0.58 ± 0.008 30.27 ± 0.12 9.54 ± 0.29 3.58 ±0.16 10.20 ±0.21 7.85 ± 2.25 112.07 ± 10.2 8 26.60 ± 5.59 0.58 ± 0.00 31.19 ±0.25 9.47 ± 0.47 2.96 ± 0.17 9.93 ±0.50 4.41 ± 0.93 100.18 ± 6.22 9 19.92 ± 1.80 0.67 ± 0.007 31.45 ± 0.20 7.87 ± 0.13 4.06 ± 0.04 8.85 ± 0.14 0.91 ± 0.13 173.84 ±7.15 10 19.90 ± 1.80 0.64 ± 0.003 29.40 ± 0.08 6.11 ± 0.24 0.77 ± 0.50 6.16 ± 0.25 1.37 ± 0.20 162.74 ± 9.01 11 25.91 ± 2.52 0.58 ± 0.003 31.43 ± 0.11 8.37 ± 0.16 4.70 ± 0.06 9.60 ± 0.15 7.55 ± 0.76 112.62 ± 2.96 12 24.12 ± 4.03 0.56 ± 0.003 29.84 ± 0.23 8.05 ± 0.09 1.80 ± 0.06 8.25 ± 0.09 7.06 ± 0.32 105.74 ± 3.37 13 22.64 ± 2.63 0.61 ± 0.003 31.72 ± 0.09 9.80 ± 0.10 3.06 ± 0.08 10.27 ± 0.1 5.39 ± 0.32 140.21 ± 3.99 14 23.78 ± 4.30 0.61 ± 0.003 31.33 ± 0.36 9.30 ± 0.44 3.13 ± 0.11 9.81 ± 0.45 5.00 ± 0.53 121.92 ± 8.45 15 23.47 ± 2.83 0.58 ± 0.004 31.48 ± 0.14 9.08 ± 0.19 2.89 ± 0.05 9.53 ± 0.18 5.10 ± 0.44 125.5 ± 1.95 16 23.14 ± 2.00 0.58 ± 0.008 32.02 ± 0.13 8.61 ± 0.27 2.91 ± 0.12 9.08 ± 0.29 7.55 ± 0.52 132.69 ± 2.71
32
Table 3.7 Adequacy of the model tested indicated that the linear model of puncturing force and ascorbic acid content, the quadratic model of responses of moisture content, L*a*b* colour values, chroma and a two-factor interaction (2FI) model of water activity
Source SD R2 Prob > F Remark Source SD R2 Prob > F Remark
Moisture content b*
Linear 1.40 0.751 0.001 Linear 0.84 0.763 0.001 Two-factor
interaction 1.39 0.816 0.412 Two-factor interaction 0.97 0.764 0.998
Quadratic 0.68 0.971 0.008 Suggested Quadratic 0.28 0.987 0.000 Suggested
Water activity Chroma
Linear 0.049 0.385 0.109 Linear 0.88 0.691 0.002
Two-factor
interaction 0.039 0.699 0.080 Suggested Two-factor interaction 1.00 0.706 0.925
Quadratic 0.044 0.752 0.745 Quadratic 0.56 0.937 0.019 Suggested
L* Puncturing force
Linear 0.90 0.572 0.014 Linear 1.61 0.758 0.001 Suggested
Two-factor
interaction 1.02 0.586 0.957 Two-factor interaction 1.78 0.778 0.845 Quadratic 0.49 0.936 0.008 Suggested Quadratic 1.43 0.904 0.145
a* Ascorbic acid content
Linear 0.77 0.554 0.018 Linear 15.73 0.773 0.000 Suggested Two-factor
interaction 0.86 0.588 0.862 Two-factor interaction 17.84 0.781 0.952 Quadratic 0.46 0.922 0.014 Suggested Quadratic 19.71 0.822 0.721
From Table 3.7, the adequacy of the output of the models tested indicated that the linear model of puncturing force and ascorbic acid content, the quadratic model of responses of moisture content, L*a*b* colour values, chroma and a two-factor interaction (2FI) model of water activity, were suggested for use in the model. Cubic models of all responses were rejected as their P valves were not significant and, therefore, could not be used for further modelling of the experimental data. The models
were selected by the lower standard deviation (SD), significant P values and maximum R2 values. For
example the R2 value for the quadratic and cubic models of moisture content were both high, but the
P value of the cubic model was not significant. Therefore, the quadratic models had a good fit and could be used to predict the response of the moisture content under the experimental conditions. The quadratic models of L*a*b* colour values and chroma were selected for the same reason. The 2FI
model of water activity gave the best fit for the R2 value of 2FI as the model of water activity is higher
33
3.5.3 Model fitting
Mathematical models were developed to obtain a better understanding of the nature of the true relationships between the input variables and the output variables of the system under study. This approximate formula can be used to achieve an approximate idea of what would happen for a large number of input-parameter combinations. The estimated coefficients of predicted polynomial models are outlined in Table 3.7. An empirical relationship between independent variables and responses were described by polynomial equations with interaction terms, which were fitted with the experimental results obtained on the basis of the Box–Behnken experimental design. The final equations are shown below:
Moisture content = 23.26 + 0.70X1 - 0.21X2 + 2.88X3 + 0.87X1X2 - 0.77X1X3 - 0.44X2X3+ 1.24X12 + 0.55X22
- 1.34X32.
Water activity = 0.60 + 0.038X1 - 0.011X2 -0.026X3-0.06X1X2 - 0. 005X1X3 - 0. 0025X2X3.
L* = 31.64 + 0.076X1 – 1.26X2 + 0.12X3 + 0.10X1X2 + 0.24X1X3 + 0.12X2X3 + 0.30X12 + 0.24X22 - 1.35X32.
a* = 9.20 - 0.015X1 - 0.71X2 + 0.78X3 - 0.08X1X2 + 0.000X1X3 + 0.36X2X3 + 0.23X12 - 0.73X22 -0.86X.
b* = 3.00 -0.27X1 -1.76X2 +0.51X3 - 0.075X1X2 + 0.0025X1X3 +0.097X2X3 +0.64X12 + 0.80X22 -0.97X32.
Chroma = 9.67 -0.13X1 -1.34X2 + 0.90X3 -0.032X1X2 - 0.001X1X3 +0. 34X2X3 + 0. 51X12 - 0.26X22 -1.20X32.
Puncturing force = 4.96 - 2.16 X1 - 0.10 X2 + 2.74 X3.
Ascorbic acid content = 134.12 - 25.04 X1 + 2.29 X2 -25.16 X3.
where X1, X2 and X3 are sugar, blackcurrant purée and pectin, respectively.
These equations were used to plot the following graphs in the section 3.5.5.
3.5.4 Statistical analysis
The adequacy and fitness of the models were tested by multiple regression analysis through the least square method. ANOVA analysis was used to check the significance of the models developed and ANOVA tables were generated, as shown in Appendix K. ANOVA is a statistical technique that subdivides the total variation in a set of data into component parts associated with specific sources of
variation for the purpose of testing hypotheses for the parameters of the model (Maran et al., 2013).
As shown in Appendix K, ANOVA of the regression model shows that the models are significant. The ANOVA analysis indicated that the models developed adequately represented the actual relationship between the independent variables and responses.
34
indicate statistical significance and P-values lower than 0.05 indicated that the model developed and
the terms were statistically significant (Maran et al., 2014a, b).
3.5.5 Effect of addition variable
In this study, the variables (sugar, blackcurrant purée and pectin) were investigated for the selected qualities of fruit leathers using three factors at three levels using a Box–Behnken response surface design. 3D response surfaces plots were then used to represent the effect of added variables on the qualities of fruit leather. The response surface plots that showed the relative effects of any two variables when the remaining variable was kept constant are presented in Figures 3.2 to 3.9.
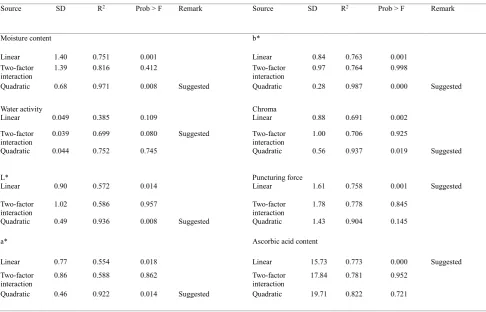
3.5.5.1 Effects of sugar and pectin levels on moisture content
Sugar and pectin were crucial parameters which affected the moisture content of the green kiwifruit-blackcurrant fruit leather. The surface plots for moisture content of the green kiwifruit-kiwifruit-blackcurrant fruit leather, as affected by sugar and pectin levels, are shown in Figure 3.2. Overall, the surface plots show that the moisture content increases with increasing sugar and pectin levels.
Figure 3.2 Response analysis for moisture content (g/100 g DM) of green
35
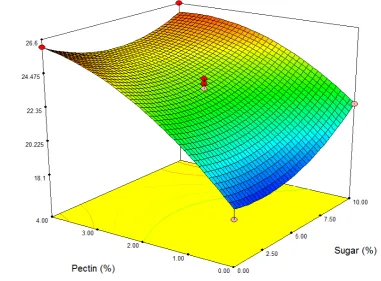
3.5.5.2 Effects of sugar and blackcurrant purée levels on water activity
Figure 3.3 shows that the surface plots for water activity of green kiwifruit-blackcurrant fruit leather as affected by the sugar and blackcurrant purée levels. The results suggest that the water activity of the products increases with increasing sugar and blackcurrant purée levels.
36
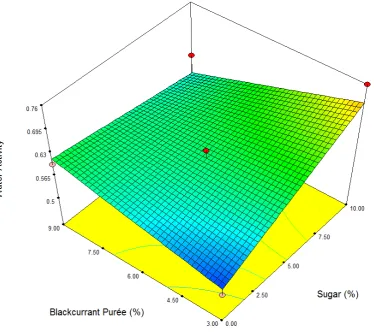
3.5.5.3 Effects of blackcurrant purée and pectin levels on L*
Figure 3.4 shows the interaction between blackcurrant purée and pectin on the L* of green kiwifruit-blackcurrant fruit leather. The results suggest that the L* of the products increases with increasing blackcurrant purée level. L* of the green kiwifruit-blackcurrant fruit leathers increases with increasing pectin level when the pectin level is below 3%. In contrast, the L* of the products decreases when the increasing pectin level is above 3%.
37
3.5.5.4 Effects of blackcurrant purée and pectin levels on a*
The surface plots for a* of the green kiwifruit-blackcurrant fruit leather, as affected by blackcurrant purée and pectin levels, are depicted in Figure 3.5. The results show that a* of the products increases with increasing pectin level and decreasing blackcurrant purée level.
38
3.5.5.5 Effects of sugar blackcurrant purée and pectin levels on b*
The surface plots for b* of the green kiwifruit-blackcurrant fruit leather, as affected by sugar, blackcurrant purée and pectin levels, are shown in Figures 3.6a, b and c. The results show that b* of the products increases with increasing blackcurrant purée level. The b* of the green kiwifruit-blackcurrant fruit leathers increases with increasing sugar level when the sugar level is above 5%. In contrast, the b* of the products decreases with increasing pectin level when the pectin level is below 5%. The b* of the green kiwifruit-blackcurrant fruit leathers increases with increasing pectin level when the pectin level is below 2%. In contrast, the b* of the products decreases with increasing pectin level when the pectin level is above 2%.
39
40
c) Sugar 5%
Figure 3.6 Response analysis for b* of the green kiwifruit-blackcurrant fruit leather: (a) as affected by sugar and blackcurrant purée levels; (b) sugar and pectin levels; and (c)
41
3.5.5.6 Effects of blackcurrant purée and pectin levels on chroma
The surface plots for chroma of the green kiwifruit-blackcurrant fruit leather, as affected by sugar and blackcurrant purée levels, are shown in Figure 3.7. The results suggest that b* of the products increases with increasing pectin level and decreasing blackcurrant purée level.
42
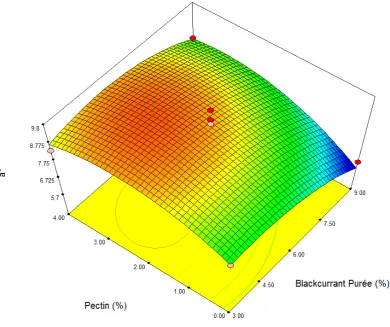
3.5.5.7 Effects of sugar and blackcurrant purée levels on puncturing force
The surface plots for the puncturing force of the green kiwifruit-blackcurrant fruit leather, as affected by sugar and pectin levels, are shown in Figure 3.8. The results clearly show that the puncturing force of the products increases with increasing sugar and pectin levels.
43
3.5.5.8 Effects of sugar and blackcurrant purée levels on ascorbic acid content
The sugar and pectin are crucial parameters that affect the ascorbic acid content of green kiwifruit-blackcurrant fruit leather. The surface plots for ascorbic acid content of green kiwifruit-kiwifruit-blackcurrant fruit leather, as affected by sugar and pectin levels, are shown in Figure 3.9. The results suggest that ascorbic acid content of the products increases with decreasing sugar and pectin levels.
44
3.5.6 Optimised conditions for making green kiwifruit-blackcurrant fruit leather
using a Box–Behnken design experiment
A desirability function was used in the Design-Expert software to maximize moisture content, ascorbic acid content and minimize water activity, L*a*b* colour values, chroma and puncturing force simultaneously in the present study. The predicted values of the characteristics at these optimum conditions were used to predict the levels of sugar, blackcurrant purée and pectin and the results shown in Table 3.8. Puncturing force is very close to 0 N/mm just when the combinations are 10% sugar, 8.95% blackcurrant purée and 0.03% pectin.
Table 3.8 Predicted values for responses of kiwifruit-blackcurrant fruit leather at optimized combinations
Sugar (%) Blackcurrant purée (%) Pectin (%) Moisture content (g/100 g DM) activity Water L* a* b* Chroma Puncturing force (N/mm) Ascorbic acid content (mg/100 g DM) Desirability
10 8.95 0.03 23.43 0.62 29.33 5.97 0.88 6.87 0.004 136.13 0.774
10 9 0.00 23.40 0.63 29.28 5.89 0.84 6.83 -0.04 136.52 0.774
10 8.93 0.00 23.35 0.62 29.30 5.94 0.85 6.86 -0.03 136.47 0.774
The programme then solved the problem of multiple responses through the use of a desirability function combining all responses into one measurement (Eren and Kaymak-Ertekin, 2007; Erbay and Icier, 2009). The overall desirability function (D) was calculated from the weighted geometric means of each individual desirability (di). Overall desirability ranges between D = 0 (a completely undesirable response), to D = 1 (a fully desired response), above which no further improvements can be made
(Gadhe et al., 2013a). In this experiment, the responses were moisture content, water activity, L*a*b*
colour values, chroma, puncturing force and ascorbic acid content.
D = (∏𝑛𝑖=1di) 1/n
where di indicatesthe individual desirabilities and n denotes the number of responses (8).
The overall desirability function was then calculated as the geometric means of 11 different response. It is interesting to note that the moisture content and the water activity of the final product had one of the lower individual desirability response (Figure 3.10). While these factors produced a desirable product, these values would need to be considered again as the moisture content and the water activity would be too high for products to be able to store satisfactory in a retail situation.
Once the Design-Expert programme had been given the upper and lower constraints for each of the important responses, the programme calculated the optimized mix of the different ingredients (Table 3.8). The predicted values for each of the responses could then be calculated and the desirability function was calculated from the fit of the response data within the upper and lower limits given to the programme.
46
Table 3.9 Coding for the central composite design
Code
Independent variables Factor Low
-1 Middle 0 High +1
Drying time (hours) X1 14 16 18
Drying temperature (°C) X2 60 70 80
Sample thickness (mm) X3 4 6 8
Table 3.10 The output from Stat-Ease programme showing the 16 different samples required by the central composite response surface methodology design (Note coding: −1 = low level; 0 = middle level; 1 = high level)
Uncoded factors Coded factors
Samples Drying time
(hours) Drying temperature (°C) Sample thickness (mm) Drying
time temperature Drying thickness Sample
1 14 60 4 -1 -1 -1
2 18 60 4 1 -1 -1
3 14 80 4 -1 1 -1
4 18 80 4 1 1 -1
5 14 60 8 -1 -1 1
6 18 60 8 1 -1 1
7 14 80 8 -1 1 1
8 18 80 8 1 1 1
9 14 70 6 -1 0 0
10 18 70 6 1 0 0
11 16 60 6 0 -1 0
12 16 80 6 0 1 0
13 16 70 4 0 0 -1
14 16 70 8 0 0 1
15 16 70 6 0 0 0
16 16 70 6 0 0 0
17 16 70 6 0 0 0
18 16 70 6 0 0 0
Table 3.11 illustrates the limit of each parameter that was used for achieving optimization of the eight responses using a central composite design. Sensory evaluations (Chan and Cavaletto, 1978; Irwandi
et al., 1998; Vijayanand et al., 2000; Huang and Hsieh, 2005; Vatthanakul et al., 2010; Sharma et al.,
2013; Safdar et al., 2014; Akhtara et al., 2014; Khan et al., 2014) showed that panelists usually liked
47
means more nutritional value. So the goal of the maximize moisture content and ascorbic acid content and the minimize thickness, L*a*b* colour values and chroma and puncturing force were chosen.
Table 3.11 Limits of the parameters and responses for optimization using a central composite design
Name Goal Lower limit Upper limit
Drying time (h) In the range 14 18
Drying
Temperature(°C) In the range 60 80
Sample thickness
(mm) In the range 4 8
Moisture content
(g/100 g DM) Maximize 13.83 43.08
Water activity Minimize 0.41 0.76
L* Minimize 27.4 35.46
a* Minimize 6.75 10.15
b* Minimize 1.51 7.99
Chroma Minimize 7.04 11.94
Puncturing force
(N/mm) Minimize 0.26 8.32
Ascorbic acid content (mg/100 g
DM) Maximize 48.9 207.83
3.6.1 Preparation of green kiwifruit-blackcurrant purée mixture
Eighteen kg of firm, ripe, green kiwifruit (Actinidia deliciosa ‘Hayward’) were obtained on 10 July
2014 from a local supermarket in Christchurch, New Zealand. These were used in the central composite design experiment to establish the optimum drying conditions of drying time, drying temperature and sample thickness to make fruit leather. Other materials such as sugar, pectin and blackcurrant purée and store conditions were same as the Section 3.4.1.
48
3.6.2 Chemical analysis
49
Figure 3.11 Flow diagram of the general process for the production of fruit leather in the central composite design experiment
Green kiwifruit
Peeling
Slicing
Coring
Green kiwifruit purée
With addition of sugar, blackcurrant purée and pectin
Blending
Pouring fruit mixture into trays
Central composite design (18 experiments of different levels of drying
time, temperature and sample thickness)
51
From Table 3.13, the adequacy of the output of the models tested indicated that the linear model of puncturing force and ascorbic acid content, the quadratic model of responses of water activity, L*and b* colour values, chroma and a two-factor interaction (2FI) model of moisture content and a* colour values were suggested for use in the model. Although the P value of the linear and the 2FI models
were similar, the interactive (2FI) model was selected as the R2 value of the 2FI model of moisture
content was higher than for the linear model. The R2 value of the 2FI model of a* was higher than for
the linear model. The R2 values for the quadratic and cubic models of water activity were 0.986 and
0.995, respectively. But the P value of the cubic model was 0.289, which was not significant. Therefore, the quadratic model had a good fit and could be used to predict the response of water activity under the experimental conditions. The P values of the linear and quadratic models of water activity for
L*and b* were all lower than 0.05 but the R2 value of the quadratic model of these three qualities were
higher than the linear models, so the quadratic models were chosen. A linear model for puncturing force and ascorbic acid content were suggested. The P value of the linear models were lower than 0.005. The P value of the other models for puncturing force and ascorbic acid content were all higher than 0.05, which were not significant.
Table 3.13 Adequacy of the model tested for all central composite design responses
Source SD R2 Prob > F Remark Source SD R2 Prob > F Remark
Moisture content b*
Linear 2.84 0.883 < 0.0001 Linear 1.15 0.746 0.000
Two-factor
interaction 0.94 0.990 < 0.0001 Suggested Two-factor interaction 1.11 0.812 0.326
Quadratic 1.09 0.990 0.982 Quadratic 0.69 0.947 0.014 Suggested
Water activity Chroma
Linear 0.032 0.910 < 0.0001 Linear 0.95 0.684 0.001
Two-factor interaction
0.027 0.947 0.107 Two-factor
interaction 0.96 0.742 0.507
Quadratic 0.017 0.986 0.012 Suggested Quadratic 0.72 0.897 0.0519 Suggested
L* Puncturing force
Linear 0.87 0.848 < 0.0001 Linear 1.61 0.715 0.000 Suggested
Two-factor interaction
0.76 0.908 0.125 Two-factor
interaction 1.58 0.784 0.369
Quadratic 0.40 0.982 0.003 Suggested Quadratic 1.47 0.864 0.273
a* Ascorbic acid content
Linear 0.64 0.569 0.007 Linear 17.66 0.872 < 0.0001 Suggested
Two-factor
interaction 0.54 0.760 0.082 Suggested Two-factor interaction 15.64 0.921 0.136
Quadratic 0.53 0.832 0.387 Quadratic 12.12 0.965 0.072
3.7.2 Model fitting
The empirical relationship between the independent variables and responses were expressed by polynomial equations with interaction terms that were fitted with the experimental results obtained on the basis of central composite responses design. The final equations are presented below:
Moisture content = 23.50 - 1.74X1 - 7.10X2 + 5.60X3 + 0.49X1X2 - 0.97X1X3 - 3.42X2X3.
Water activity = 0.53 - 0.025X1 - 0.095X2 + 0.068X3 - 0.011X1X2 - 0. 00625X1X3 - 0. 0024X2X3 + 0.026X12