EXPERIMENTAL ANALYSIS ON
SURFACE ROUGHNESS OF CNC
END MILLING PROCESS USING
TAGUCHI DESIGN METHOD
PATEL K. P.
B. S. Patel Polytechnic, Ganpat University, Kherva-382711, Mehsana, North Gujarat, India. [email protected]
Abstract:
Here, we study about, influence of various machining parameters like tool speed, tool feed, depth of cut and tool diameter. In the present study, experiments are conducted on AL 6351 –T6 material with four factors and five levels and try to find out optimum surface roughness by using taguchi method. This paper attempts to introduce how Taguchi parameter design could be used in identifying the significant processing parameters and optimizing the surface roughness of end-milling operations.
In this study, it was observed that, the order of significance of the main variables is as A1 > B4 > C4 > D1 (tool feed (A), tool speed (B), tool diameter(C), depth of cut (D)).
Keywords: CNC end milling, S/N ratio, Taguchi method.
1. INTRODUCTION
Today, industry needs quality and productivity. The increase of consumer needs for quality metal cutting products has driven the metal cutting industry to continuous improve quality control of metal cutting process. The end milling process is one of the most fundamental process of metal removing process.In order to obtain better surface roughness, the proper setting of cutting parameters is crucial before the process takes place. Several factors will influence the final surface roughness in a CNC milling operation. The final surface roughness might be considered as the sum of two independent effects: 1.The ideal surface roughness is a result of the geometry of tool and feed rate.2.The natural surface roughness is a result of the irregularities in the cutting operation Factors such as spindle speed, feed rate, tool diameter and depth of cut that control the cutting operation can be setup in advance. However, factors such as too geometry, tool wear, chip loads and chip formations, or the material properties of both tool and work piece are Even in the occurrence of chatter orvibrations of the machine tool, defects in the structure of the work material, wear of tool, or irregularities of chip formation.
2. EXPERIMENTAL WORK
The study was carried out using a BFW V-30 CNC vertical milling machine equipped with a maximum spindlespeed 10000 rpm ,feed rate 20 m/min, multiple tool-change capabilities (max number of tools = 25) and with 15 HP spindle horsepower The machine is capable of a three-axis movement (along the x, y,and zplanes). CNC programs can be developed in the hyper mill software. The work piece material used was AL 6351 –T6 in the form of 420mm x 120mm x 20mm plate. The surface roughness measured by Mitutoyo-surface roughness tester.
Experimental design, setup, and results are presented as follows: 2.1 Select the quality characteristics.
2.2 Select noise factor and control factor. 2.2 Select orthogonal array.
2.4 Conduct the experiments.
2.1 SELECT THE QUALITY CHARACTERISTICS
There are three types of quality characteristics in the Taguchi methodology, such as smaller-the-better, larger-the-better, and nominal-the-best. The goal of this research was toproduce minimum surface roughness (Ra) in an end-milling operation. Smaller Ra Values represent better or improved surface roughness. Therefore, a smaller-the-better quality characteristic was implemented and introduced inthis study.
2.2 Select Noise Factor And Control Factor
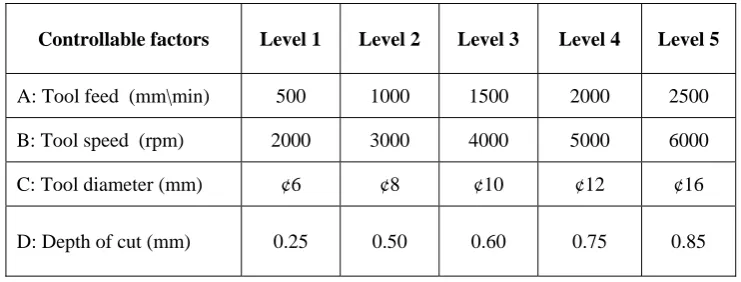
Literature survey and discuss with some industrial person ,we conclude that tool feed(A), tool speed(B), tool diameter (C) and depth of cut(D) had significant effect on surface roughness in end milling operation. These factors are controllable factors. Table1 shows all Taguchi design parameters and levels.
One of the most important considerable attributes of Taguchi parameter design was S/N ratio. It was differ at the different place.
Controllable factors Level 1 Level 2 Level 3 Level 4 Level 5
A: Tool feed (mm\min) 500 1000 1500 2000 2500 B: Tool speed (rpm) 2000 3000 4000 5000 6000 C: Tool diameter (mm) ¢6 ¢8 ¢10 ¢12 ¢16 D: Depth of cut (mm) 0.25 0.50 0.60 0.75 0.85
Table 1. Selected Factors And Levels 2.3 Select Orthogonal Array
Literature survey and discuss with some industrial person, we considered four factors and five levels in our study. As per above parameters we select L25 orthogonal array (OA) in the Taguchi parameter design. The layout of L25 orthogonal array is shown in Table-2.
Sr.no. Tool feed Tool speed Tool dia. Depth of cut
22 2500 3000 08 0.6 23 2500 4000 10 0.25 24 2500 5000 12 0.5 25 2500 6000 16 075
Table 2. Orthogonal Array L25 Sr.no. Tool feed Tool speed Tool dia. Depth of
cut
Surface
roughness S/N ratio
1 500 2000 08 0.25 0.77 2.2701 2 500 3000 10 0.5 1.34 -2.5421 3 500 4000 12 0.75 1.18 -1.4376 4 500 5000 16 0.85 0.9 -0.4376 5 500 6000 06 0.6 1.07 0.5623 6 1000 2000 10 0.75 1.92 1.5623 7 1000 3000 12 0.85 1.23 2.5623 8 1000 4000 16 0.6 1.19 3.5623 9 1000 5000 06 0.25 1.16 4.5623 10 1000 6000 08 0.5 0.62 5.5623 11 1500 2000 12 0.6 0.66 6.5623 12 1500 3000 16 0.25 1.10 7.5623 13 1500 4000 06 0.5 2.39 8.5623 14 1500 5000 08 0.75 1.39 9.5623 15 1500 6000 10 0.85 1.39 10.562 16 2000 2000 16 0.5 8.02 11.562 17 2000 3000 06 0.75 6.10 12.562 18 2000 4000 08 0.85 0.74 13.562 19 2000 5000 10 0.6 1.25 14.562 20 2000 6000 12 0.25 1.06 15.562 21 2500 2000 06 0.85 4.76 16.562 22 2500 3000 08 0.6 6.73 17.562 23 2500 4000 10 0.25 1.06 18.562 24 2500 5000 12 0.5 1.14 19.562 25 2500 6000 16 075 2.24 20.562
Table 3. Results Of L25 Experiment 2.6 Conduct Thee Experiments
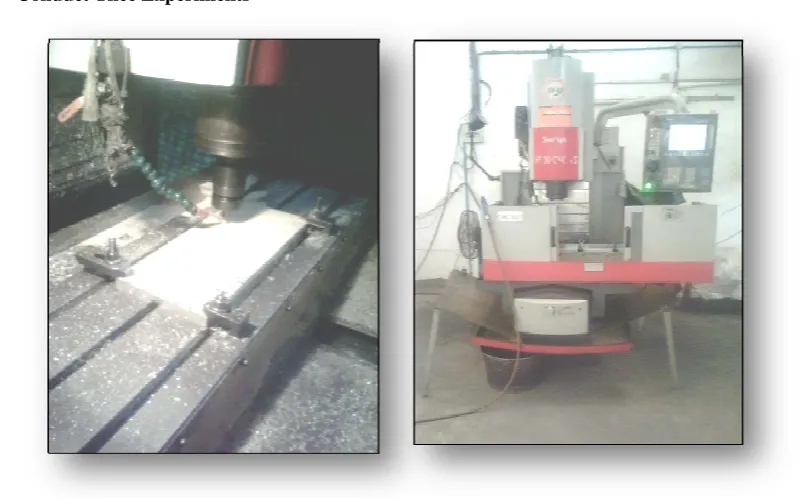
Figure 1 shows the experimental set up and operation.The work piece material used was AL 6351 –T6 in the form of 420mm x 120mm x 20mm plate. The all 25 experiments were run by BFW V-30 CNC vertical milling machine. Surface roughness data values collected with the help ofMitutoyo-surface roughness tester after end milling was completed. S/N ratio was calculated based on following Eq. (1).
S/N (η) = 10 ∑ (1) Where, n = number of measurements Ina trial/row, in this case, n=5
yi = the ith measured value in a run/row.
2.4 Analyze The Result And Determine Optimum Factor-Level Combination
(1) Analysis Of Raw Data And S/N Ratio
Level Tool feed (A) Tool speed(B) Tool dia. (C) D.o.cut (D)
1 1.052 3.226 3.096 1.030 2 1.224 3.300 2.050 2.702 3 1.386 1.312 1.392 2.566 4 3.434 1.168 1.054 1.804 5 3.186 1.276 2.690 2.180 Delta 2.382 2.132 2.042 1.672
Rank 1 2 3 4
Table 4. Average Effect Response Table For Raw Data
Level Tool feed (A) Tool speed (B) Tool dia. (C) D.o.cut (D)
1 -0.2764 -6.2845 -7.7407 -0.1718 2 -1.2224 -7.4870 -2.0766 -5.0359 3 -2.1015 -1.6815 -2.7025 -6.5351 4 -6.7238 -1.2621 -0.2542 -2.9360 5 -7.7523 -1.3614 -5.3024 -3.3976 Delta 7.4759 6.2249 7.4865 6.3633
Rank 2 4 1 3
Table 5. Average Effect Response Table For S/N Ratio
After raw data were collected, average effect response values (Table 4) and S/N response ratios (Table 5), respectively, were calculated based on Table 2. The calculation of average effect response values and S/N ratios were based on the following procedure. For example, the average effect for level one of Tool feed was computed using data from experimental numbers 1-5 of Table 3.The average effect for level two of Toolfeed was computed using experimental numbers 6-10 of Table 3. The average effect for level three of Tool feed was computed using experimental numbers 11-15 of Table 3.The average effect for level four of Tool feed was computed using experimental numbers 16-20 of Table 3.The average effect for level five of Tool feed was computed using experimental numbers 21-25 of Table 3. Similarly, the average effect of Tool speed and Tool diameter and depth of cut was computed for all other cutting levels. The S/N ratio is calculated in the same way. The average effects and S/N ratios for each level of cutting parameters are summarized and referred to in the average effects response table and S/N ratios response table for surface roughness (Ra), as shown in Tables 4 and 5.
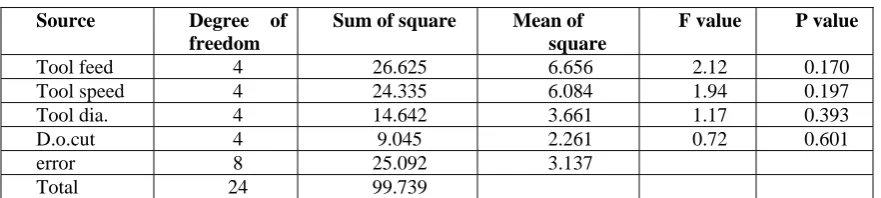
(2) Analysis Of Variance
Source Degree of
freedom
Sum of square Mean of square
F value P value
Tool feed 4 26.625 6.656 2.12 0.170 Tool speed 4 24.335 6.084 1.94 0.197 Tool dia. 4 14.642 3.661 1.17 0.393
D.o.cut 4 9.045 2.261 0.72 0.601 error 8 25.092 3.137 Total 24 99.739
The purpose of the analysis ofvariance (ANOVA) is to determinewhich cutting parameters significantlyaffect the quality characteristic (Ra).Table 6 shows the results of ANOVAanalysis of raw data for surface roughness.
(3) Determine Optimum Factor-Level Combination
2500 2000 1500 1000 500 3 2 1 6000 5000 4000 3000 2000 16 12 10 8 6 3 2 1 0.85 0.75 0.60 0.50 0.25 Tool feed Me a n o f Me a n s Tool speed
Tool dia D.O.Cut
Main Effects Plot for Means
Data Means 2500 2000 1500 1000 500 0 -2 -4 -6 -8 6000 5000 4000 3000 2000 16 12 10 8 6 0 -2 -4 -6 -8 0.85 0.75 0.60 0.50 0.25 Tool feed M e a n of S N r a ti os Tool speed
Tool dia D.O.Cut
Main Effects Plot for SN ratios
Data Means
Signal-to-noise: Smaller is better
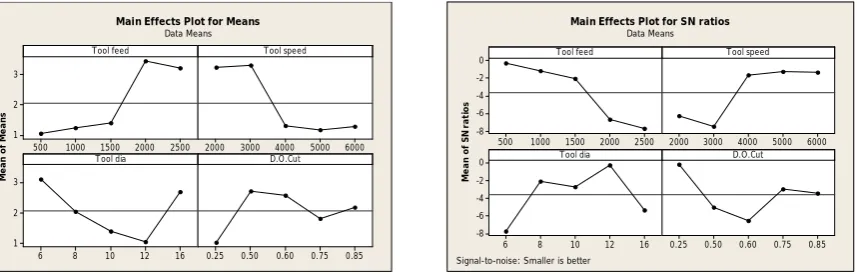
Figure 2. Response Graph Of Five Cutting Parameters For Mean And S/N Ratio
Figure 2 shows three graphs, each of which contains a curve representingthe mean and a curve representing theS/N ratio. The values of the graphs arefrom Table 4 and 5. The S/N ratio indicates thedegree of the predictable performanceof a product or process in the presenceof noise factors. Process parametersettings with the highest S/N ratioalways yield the optimum quality with minimum variance.The level that hasa higher value determines the optimumlevel of each factor. For example, in Figure 5, level one for tool feed(A1= 0.02 in) has the highest S/N ratiovalue, which indicated that the machining performance at such level producedminimum variation of the surfaceroughness. In addition, the lowersurface roughness value had a bettermachining performance. Furthermore,level two of tool feed (A1 = 500 mm/min)has indicated the optimum situation interms of mean value.Similarly, the level three of cuttingspeed (B4=4000 rpm) and the level oneof tool dia. (C4=16 mm) and level four of depth of cut (D1=0.25 mm) have alsoindicated the optimum situation interms of S/N ratio and mean value.
2.5 Predict Optimum Performance
One could predict the optimum surface roughness performance using the following Taguchi equation: Predicted mean = A1 + B4 + C4 +D1 – 5 (Y)
= 1.052 + 1.168 + 1.054 + 2.566– 5 (2.0564) = -4.44 µm.
Similarly, the S/N ratio could be predicted as:
Predicted S/N = A1 + B4 + C4 + D1 – 5 ( )
= -0.2764 - 1.2621 - 0.2542 - 0.1718 – 5 (-3.6152)
= 16.1115 Db.
3 CONCLUSION
In this study, the analysis of confirmation experiments has shown that Taguchi parameter design can successfully verify the optimum cutting parameters, which are A1 > B4 > C4 > D1 (tool feed (A), tool speed(B), tool diameter(C), depth of cut(D) ). The work piece material used was AL 6351 –T6. The average value of surface roughness [Mean (= - 4.44 µm) and S/N ratio (= 16.1115 Db.)] were calculated and were found to be within the range.Taguchi parameter design can provide a systematic procedure that can effectively and efficiently identify the optimum surface roughness in the process control of individual end- milling machines. It also allows industry to reduce process or product variability and minimize product defects by using a relatively small number of experimental runs and costs to achieve superior-quality products. This research only demonstrates how to use Taguchi parameter design for optimizing machining performance with minimum cost. Further study could consider more factors (e.g. forces, materials, lubricant, etc.) in the research to see how the factors would affect surface roughness. Also, further study could consider the outcomes of Taguchi parameter design when it is implemented as a part of management decision-making processes.
References:
[1] A handbook of a primer on The Taguchi method by: Ranjit.K.roy.
[2] Ab. Rashid M.F.F., Gan S.Y., and Muhammad N.Y. Mathematical Modeling to Predict Surface Roughness in CNC Milling (2009).
[3] B. C. Routara & A. Bandyopadhyay & P. Sahoo Roughness modeling and optimization in CNC end milling using response surface method: effect of work piece material variation, 15 March 2008.
[4] Sanjit,Moshat,Saurav Datta, Asish Bandyopadhyay and Pradip Kumar Pal, Optimization of CNC end milling process parameters using PCA-based Taguchi method,2010.
[5] Julie Z. Zhang, Joseph C. Chen, E. Daniel Kirby, Surface roughness optimization in an end-milling operation using the Taguchi design method, 27 September 2006.