R E S E A R C H
Open Access
Validity of the school setting interview for
students with special educational needs in
regular high school
–
a Rasch analysis
Moa Yngve
*, Michaela Munkholm, Helene Lidström, Helena Hemmingsson and Elin Ekbladh
Abstract
Background:Participation in education is a vital component of adolescents’everyday life and a determinant of health and future opportunities in adult life. The School Setting Interview (SSI) is an instrument which assesses student-environment fit and reflects the potential needs for adjustments to enhance students’participation in school activities. The aim of the study was to investigate the psychometric properties of the SSI for students with special educational needs in regular high school.
Methods:A sample of 509 students with special educational needs was assessed with the SSI. The polytomous unrestricted Rasch model was used to analyze the psychometric properties of the SSI regarding targeting, model fit, differential item functioning (DIF), response category functioning and unidimensionality.
Results:The SSI generally confirmed fit to assumptions of the Rasch model. Reliability was acceptable (0.73) and the SSI scale was able to separate students into three different levels of student-environment fit. DIF among gender was detected in item“Remember things”and in item“Homework”DIF was detected among students with or without diagnosis. All items had disordered thresholds. The SSI demonstrated unidimensionality and no response dependence was present among items.
Conclusion:The results suggest that the SSI is valid for use among students with special educational needs in order to provide and evaluate environmental adjustments. However, the items with the detected DIF and the SSI rating scale with its disordered thresholds needs to be further scrutinized.
Keywords:Psychometrics, Neuropsychiatric disorder, Dyslexia, Assessment, Instrument development, Person-environment fit, Participation, Support in school, Occupational therapy
Background
The concept of special educational needs is internation-ally used to describe students who temporarily or per-manently experience difficulties in their learning. The concept covers students with and without a diagnosis, and includes up to 20% of school-aged youth [1]. Com-mon diagnoses aCom-mong students with special educational needs are Attention Deficit Hyperactivity Disorder (ADHD), Asperger’s syndrome and dyslexia [2]. Symp-toms of these diagnoses often include difficulties to con-centrate, follow instructions, organize and conduct tasks, and/or read and write [2–4]. Struggling to complete
education successfully may lead to lower self-esteem and poor overall mental health [2, 5], along with higher rates of school-dropout and unemployment due to low academic achievements [2, 6]. Compared with students with physical disorders or without disabilities, students with developmental disorders (ADHD, autism or dys-lexia) rate their perceived quality of life significantly lower [7, 8]. Adolescents’ participation in education at school is a vital component of their everyday life and a determinant of health, development and well-being as well as future opportunities in adult life [9]. To achieve full potential for occupational participation in education, students’ opportunities as regards their learning condi-tions and engagement in school activities are critical [10]. Students should be provided with appropriate * Correspondence:[email protected]
Department of Social and Welfare Studies, Linköping University, Norrköping, Sweden
adjustments and support [11] in areas such as writing, reading, knowledge gathering, and practical tasks, as well as support in initiating and organizing school activ-ities and reminders to perform tasks at appropriate times [12]. Focusing on the social environment and the learning context, e.g. communication and participation within the classroom, is also important to emphasize [13]. Student’s unique abilities and the characteristics of the specific school environment must be considered and should form the basis for adjustments to give students with different types of disabilities equal opportunities for participation in education [14].
By assessing the student-environment fit, the inter-action between the student and the school environment, information reflecting the student’s occupational per-formance is generated. The School Setting Interview (SSI) [15] is an assessment instrument that assesses student-environment fit and is theoretically based on the Model of Human Occupation [10]. The SSI consists of a student-centered interview and an accompanying rating scale including 16 items of everyday school activities. The assessment takes about 40 min to complete and identifies possibilities, hindrances and potential needs for adjustments concerning students’ participation in school activities [15].
The SSI was initially developed for students with physical disabilities [16] and a psychometric study supported evi-dence of construct validity. However, the study revealed a need for more challenging items and a refinement of the scoring in the rating scale [17], which thereafter was devel-oped from a three-step to a four-step rating scale in version 2 [18]. Findings and input from professionals with experi-ence of the SSI were used to develop the SSI to make it ap-plicable to students with other difficulties than just physical [19]. Even though the SSI, version 3.1 [15], has been suc-cessfully used for students with different difficulties, the construct validity has not yet been evaluated for students with special educational needs. This calls for psychometric evaluation of the internal construct validity of the scale. Depending on the characteristics of the student, different school activities and environmental factors are experienced as more or less challenging. It is hypothesized that students with special educational needs, often involving difficulties with concentration, organization and finishing tasks, will experience more challenges, i.e. low student-environment fit, in school activities such as“Remember things”,“Read”, “Take exams” and“Write”. On the other hand, they may experience high student-environment fit regarding“Access the school”and“Go on field trips”.
The Rasch measurement model is a mathematical ap-proach belonging to modern test theory [20], and has become established as the standard for modern psycho-metric evaluations of outcome scales [21]. The analysis addresses several measurement issues and aspects in
addition to those in classical test theory. It transforms ordinal data to an interval-level variable for detailed in-vestigation of the structure and operation of rating scales [21, 22].
The aim of the present study was to investigate the psychometric properties of the School Setting Interview (SSI) for students with special educational needs in regu-lar high school. More specifically, the aim was to exam-ine whether the SSI items are valid for this group of students, with additional consideration on bias of items by gender and diagnosis, the measurement properties of the SSI rating scale, and whether the SSI measures a unidimensional construct.
Methods
Research design
The Rasch measurement model was used to evaluate the psychometric properties of the SSI for students with spe-cial educational needs in regular high school. Secondary data, from Swedish governmental projects conducted in 2011-2014 was used. Approval from the Regional Ethics Board in Linköping, Sweden was obtained, study code 2013/409-31.
Sample and procedure
The secondary data originates from five municipalities, in-cluding 12 public high schools with approximately 10.000 students. School staff, in these schools, identified and asked students about involvement in the projects. Poten-tial participants were identified due to inability to reach educational goals and/or noticeable difficulties with plan-ning, problem solving, conducting and/or finishing tasks and/or a high level of school absence. Further, students should be able to speak and understand Swedish. A total of 549 students were included in the projects and gave written informed consent to use their data in research.
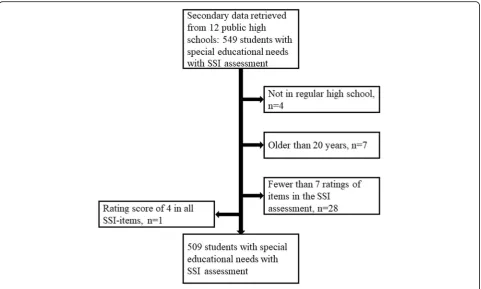
Inclusion criteria for participants in the present study were: students in regular high school,≤ 20 years and at least seven ratings of SSI-items in the SSI assessment. One student obtained the highest rating (rating of 4) in every SSI-item and was excluded since maximum scores do not yield information to the Rasch analysis as the standard errors are infinite and the item responses do not vary [23]. The present sample consists of 509 SSI as-sessments of students with special educational needs, see Fig. 1.
Data collection
school activities. The SSI items were then rated. Demo-graphic information (age, gender and diagnosis) was ob-tained through a questionnaire in connection to the interview, see Table 1. The occupational therapists (n= 6) and the special education teacher conducting the SSI as-sessments were trained SSI-assessors.
Analysis
The Rasch analysis was performed with the RUMM2030 software [23], using the polytomous unrestricted Rasch model. The objective was to test how well the observed data fit the theoretical expectations of the model, and dif-ferent fit statistics were examined both statistically and
graphically. The Rasch analysis accommodates missing data [21, 22] and SSI assessments with missing ratings of items could be included. The significant level was overall set atp< 0.05.
Targeting and reliability
To evaluate the targeting of the SSI scale, the relationship of persons and items was investigated. For a well targeted scale, the mean sample location should be close to the mean item location (zero) [24, 25]. The reliability of the internal consistency of the scale was evaluated using the person separation index (PSI), analogous to Cronbach’s alpha. The PSI value range from 0 to 1, a value of 1 is the ideal and 0.7 the lowest level of acceptability. The PSI also provides information on how many groups of individuals, strata (statistically distinct groups separated by≥3 stand-ard errors) the scale can separate between [25–27]. For example, a PSI of 0.2 indicates one strata and a PSI of 0.92 indicates five strata [27].
Model fit
Fit refers to the extent to which observed responses accord with the mathematical expectations of the model. Sum-mary statistics of invariance of items for this trait were evaluated with chi-square statistics, supporting the required property of invariance when non-significant. Summary statistics also concern
item-Fig. 1Flowchart of the inclusion of students SSI assessment
Table 1Characteristics of the sample (n= 509 students)
Age
Mean, median 17.34, 17
Gender
Boysn(%) 300 (59)
Girlsn(%) 209 (41)
Diagnosis
No diagnosisn(%) 270 (53)
Neuropsychiatric disordern(%) (e.g. ADHD, Asperger) 112 (22)
Dyslexia/language disordern(%) 100 (20)
person interaction presented as the z-score. A per-fect fit to the model would have a mean of zero and a standard deviation (SD) of 1, representing a stan-dardized normal distribution [23, 28]. The fit statis-tics of individuals and items are presented as residuals, considered adequate if they fall in the range of ±2.5 with additional chi-square statistics representing model fit when non-significant. The fit of individual items was also analyzed graphically using an item characteristic curve (ICC). Appraisal of all fit statistics (residuals, chi-square and ICC) de-termines whether the item is considered to fit or misfit the model [21].
Differential item functioning (DIF)
DIF was examined to investigate whether the SSI items measured the same ability in the same way across gender (boy/girl) and among students with or without a medical diagnosis within the sample. The presence of DIF was an-alyzed both statistically, through an analysis of variance (ANOVA), and graphically by the ICC [21–23, 26]. In addition to evaluation of significance, Bonferroni correc-tion was applied, p< 0.001. In the presence of DIF, this was adjusted for by splitting the item into two new items [23], one for boys and one for girls, and one for students with a medical diagnosis and one for students without diagnosis, and performing a new analysis of the resolved data set.
Response category functioning
The category structure (thresholds) of items is consid-ered when investigating polytomous scales. Thresholds,
the locations where there is a 50/50 probability of responding in either of two adjacent categories, are sistent with the metric estimate of the underlying con-struct when presented in an ordered set [21]. In the SSI, the ordering of categories represents an increase of ex-perienced student-environment fit and every item has three thresholds (between categories 1-2, 2-3 and 3-4).
Unidimensionality and local independence
Unidimensionality of the SSI scale was evaluated by a residual-based principal component analysis (PCA) with a varimax rotation. Eigenvalues between 1.4 to 2.1 for the first component in a PCA have been reported as Rasch-fitting, supporting the assumption of a unidimensional scale [29, 30]. The residual correlation matrix examined response dependency where correlations between items above 0.3 indicate dependence. The Rasch model requires the entire correlation of items to be captured by the latent trait, or it may indicate multidimensionality or response dependence [21, 31].
Results
Targeting and reliability
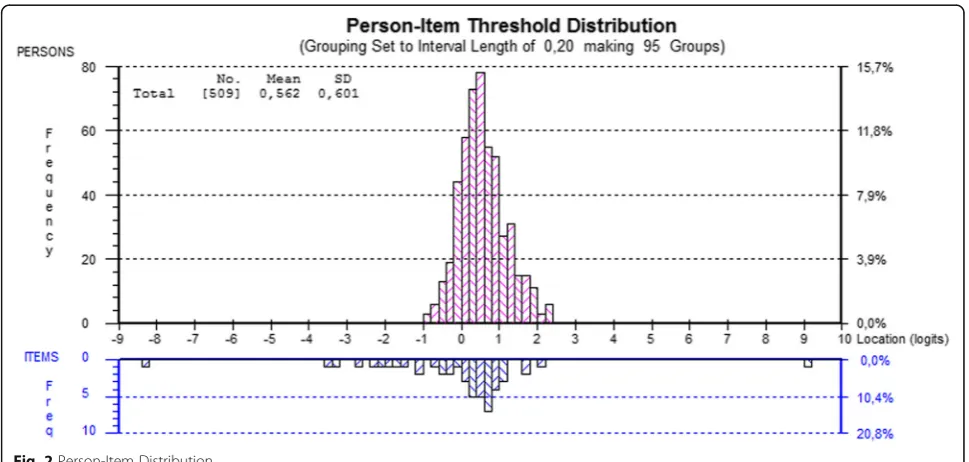
The SSI items targeted most of the person locations (Fig. 2). Person mean was 0.56 (SD = 0.6), a little to the right of the item mean of 0 (SD = 0.72), indicating that persons exhibit a slightly higher student-environment fit than the difficulty of items represents. The SSI scale worked in an acceptable way (PSI 0.73) and separated stu-dents into approximately three groups (2.6 strata).
Illustration of the relationship between student loca-tion (n= 509, upper panel) and the SSI item response
category thresholds (lower panel) on the common latent trait of student-environment fit.
Model fit
Overall item-fit (mean =−0.15, SD = 1.28) and person-fit (mean =−0.25, SD = 0.73) were acceptable and the non-significant total item chi-square value (chi sq.= 135.1;df
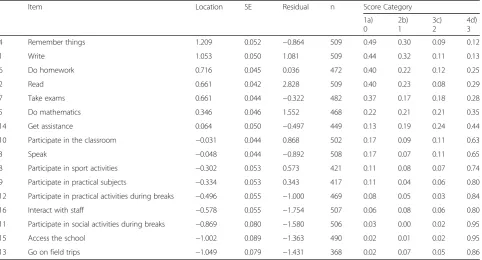
= 112; p= 0.07) indicated overall fit to the model. The easiest item was item 13“Go on field trips”while item 4 “Remember things” was the most difficult. The hierarch-ical order of item difficulty corresponded well with what were hypothesized to be more and less challenging items for these students. All items, except item 2“Read”(fit re-sidual of 2.83), had fit rere-siduals within the recommended confidence range of ±2.5, see Table 2. The misfit of item 2 was non-significant. Graphical inspection of the ICC re-vealed misfit between the observed values and the ex-pected curve of the model in the middle of the trait, indicating poor discrimination. All but two persons dis-played good fit and they remained in the analysis.
Dif
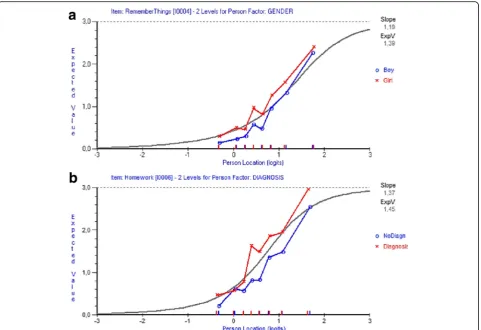
Item 4“Remember things”showed uniform DIF for gen-der with a significantp-value after Bonferroni adjustment (F-ratio 11.04, p< 0.001) (Fig. 3). The responses of girls were consistently higher along the trait than those for
boys, indicating a higher score of perceived student-environment fit despite the same location on the latent construct. Item 6 “Do homework” showed uniform DIF with tendency to non-uniform DIF, for diagnosis with a significant p-value after Bonferroni adjustment (F-ratio 18.01,p< 0.000) (Fig. 3). The responses of students with a medical diagnosis were higher along the trait than those for students without diagnosis, indicating a higher score of perceived student-environment fit, despite the same lo-cation on the latent construct.
Splitting item 4“Remember things”for gender and item 6“Do homework”for diagnosis did not result in any not-able changes regarding overall fit to the model (chi sq. = 137.72; df= 126; p= 0.22, item-fit: mean =−0.16, SD = 1.24 and person-fit: mean =−0.25, SD = 0.73) and no add-itional DIF was demonstrated. Thus, the original data set was retained in further analyses. [Fig. 3].
Graphical comparison between observed values of boys and girls in item Remember things (A) and between students with and without a medical diagnosis in item Homework (B) in eight class intervals, displaying DIF.
Response category functioning
All items had disordered thresholds indicating issues with the categorization of the SSI items. The estimates of thresholds did not form distinctive regions of the
Table 2Individual Item-Fit of the SSI items (location order) and category response proportions
Item Location SE Residual n Score Category
1a) 0
2b) 1
3c) 2
4d) 3
4 Remember things 1.209 0.052 −0.864 509 0.49 0.30 0.09 0.12
1 Write 1.053 0.050 1.081 509 0.44 0.32 0.11 0.13
6 Do homework 0.716 0.045 0.036 472 0.40 0.22 0.12 0.25
2 Read 0.661 0.042 2.828 509 0.40 0.23 0.08 0.29
7 Take exams 0.661 0.044 −0.322 482 0.37 0.17 0.18 0.28
5 Do mathematics 0.346 0.046 1.552 468 0.22 0.21 0.21 0.35
14 Get assistance 0.064 0.050 −0.497 449 0.13 0.19 0.24 0.44
10 Participate in the classroom −0.031 0.044 0.868 502 0.17 0.09 0.11 0.63
3 Speak −0.048 0.044 −0.892 508 0.17 0.07 0.11 0.65
8 Participate in sport activities −0.302 0.053 0.573 421 0.11 0.08 0.07 0.74
9 Participate in practical subjects −0.334 0.053 0.343 417 0.11 0.04 0.06 0.80
12 Participate in practical activities during breaks −0.496 0.055 −1.000 469 0.08 0.05 0.03 0.84
16 Interact with staff −0.578 0.055 −1.754 507 0.06 0.08 0.06 0.80
11 Participate in social activities during breaks −0.869 0.080 −1.580 506 0.03 0.00 0.02 0.95
15 Access the school −1.002 0.089 −1.363 490 0.02 0.01 0.02 0.95
13 Go on field trips −1.049 0.079 −1.431 368 0.02 0.07 0.05 0.86
“Remember things”the most difficult item and“Go on field trips”the easiest item The SSI four-step rating scale:
a) 1: Unfit when the student perceives that the school environment needs to be modified but has not received any adjustments
b) 2: Partial fit when the student perceives that the school environment needs to be modified although some adjustments have already been received c) 3: Good fit when the student has received needed adjustments and is satisfied with them
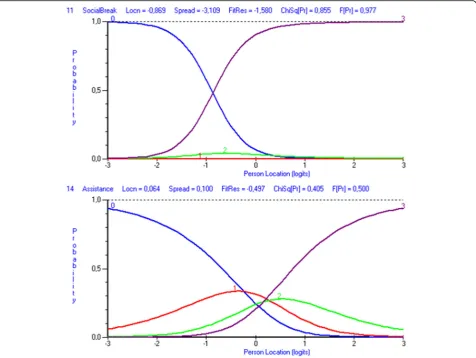
continuum. Item 11 “Participate in social activities dur-ing breaks”had the most disordered thresholds and item 14 “Get assistance” had the best functioning ones. The probability of obtaining a score of 2 (partly fit) and 3 (good fit) was never most likely for students in item 11 (Fig. 4). Item 14, demonstrated a better functioning and only one category was disordered. When investigating the category response proportion, it was obvious that the highest proportion of students was rated as unfit (score 1) or perfect fit (score 4) in all items, see Table 2.
Item 11 “Participate in social activities during breaks” (upper picture) displaying disordered thresholds between categories 0-1 (score 1-2), 1-2 (score 2-3) and 2-3 (score 3-4) and item 14 “Get assistance” (lower picture) dis-playing disordered thresholds between categories 1-2 (score 2-3) and 2-3 (score 3-4). Category probability curves show the probability of observing each category relative to the location on the measured continuum of student-environment fit (x-axis).
Unidimensionality and locally independence
The residual correlation matrix revealed that all correla-tions between items were under 0.3, demonstrating
locally independence among the SSI items, i.e. no re-sponse dependence. The first principal component iden-tified by the PCA had an eigenvalue of 1.69, explaining 10.55% of the variance. No additional structures were present since no associations were found in the data after the“Rasch factor”was extracted when investigating the PCA with the varimax rotation. Taken together, the overall fit and the PCA results support a unidimensional underlying construct.
Discussion
This study was conducted to examine the measurement properties of the SSI among students with special educa-tional needs in regular high school, a previously unevalu-ated field of use of the SSI. Data were found, in general, to be in accordance with the Rasch model, providing support for the internal construct validity of the SSI. However, areas for potential improvement were also identified where the SSI rating categories with the disor-dered thresholds are of most concern.
The findings indicated that the SSI captures three dif-ferent levels of student-environment fit. The minimum requirement of this kind of assessment is to separate
people into two groups (high and low level of attribute) [32]. Since the SSI is able to separate about three levels of performance, the sample may be classified into mean-ingful categories of high, medium and low experienced student-environment fit. The SSI three-step rating scale in earlier versions also separated students into three levels of student-environment fit and the new, four-step, rating scale was proposed to increase the separation [17]. This was not confirmed in the present study, per-haps because this new group of students had a different type of difficulties than previously investigated. Posi-tively, the sample presented a good, overall, person-fit and the overall item-fit was acceptable. In clinical prac-tice, it is important that the assessment is appropriately targeted to the population being assessed for adequate measurement [22, 25, 26] and satisfyingly, the targeting of the SSI items was good for this new group of stu-dents. Item 4 was the most difficult item for the sample, and with respect to the existing difficulties among the students, this was in accordance with the hypothesis. However, some more difficult items would probably
increase the psychometric properties of the assessment [23] since the present sample exhibited a higher mean location than included items. Item 2, “Read”, showed signs of misfit, though these were non-significant. This observation may not convert into other populations, but if so, the misfit should be thoroughly investigated since reading is a highly important activity in school, and thus an essential item in the SSI.
Support for unidimensionality and local independence was satisfying since both multidimensionality and re-sponse dependency are serious threats of the psychomet-ric properties of an assessment and implies that responses to an item depends on responses to other items or that the scale reflects more than one latent trait [26, 31].
The SSI rating categories did not work as intended for this group of students since all items had, more or less, disordered thresholds. Investigation of the response dis-tribution confirmed that category 1 (score of 2 - partial fit, student has adjustment but additional adjustments are needed) and 2 (score of 3 - good fit, student has
necessary adjustments) were rarely used. Both categories imply that adjustments have already been made in the environment to increase the student-environment fit. Thus, this indicates that students had not received needed adjustments, which was also demonstrated earl-ier for this group of students in Swedish schools [33] as well as internationally [19]. Even though laws and legis-lation [9, 34] entitle all students to participate in and ac-quire education, students with special educational needs do not seem to sufficiently obtain individualized support which would enhance and improve their performance and participation in school activities as a result of im-proved student-environment fit. Item 14 “Get assist-ance”, had the best category functioning and the most equal distribution of scores among the different categor-ies. This indicates that if all assigned categories are not used, in this study due to absence of environmental ad-justments, it might be a reason for disordered thresholds [35, 36]. Despite issues with the categorization of the scale, it is essential for the clinical utility of the SSI to keep all four categories since it is used both as an assess-ment of level of student-environassess-ment fit and as an evaluation of implemented adjustments [15]. Category 1 (score of 2) and 2 (score of 3) are of great value to see whether implemented adjustments fulfilled their purpose or whether the students are in need of further adjust-ments. The present study was based on data from an ini-tial SSI assessment and further investigation of the category functioning should include data from SSI evalu-ation of implemented adjustments. Thus, further studies are necessary to investigate the underlying cause of why two of the four categories are not used as intended. If the reason for non-use of category 1 (score of 2) and 2 (score of 3) is not due to absent adjustments, the scale needs to be revised.
Item 4 “Remember things” showed uniform DIF re-garding gender and item 6 “Homework” showed DIF among students with and without diagnosis. When DIF is present the observed group differences, at least par-tially, reflect something other than the latent trait [21, 37, 38] and comparison between boys and girls or be-tween student with and without diagnosis is not com-pletely reliable in the specific items. ANOVA statistics and the ICC curve were used in the present study since DIF analyses’actual power is affected by sample size, the distribution of persons in relation to the location of items and the distribution of residuals [38]. Additionally, an item split was performed in order to investigate the DIF further [23, 38]. DIF does not necessarily imply clin-ical significance, and theoretclin-ical and practclin-ical issues should be considered before adjustments are made [39]. Removal of item 4 was not considered an option since much school activity, as well as everyday life, involves executive functions such as planning and remembering.
The same applies for item 6 as homework is an integral part of schooling. Since the item split confirmed that the DIF did not affect the overall psychometric properties, the decision to keep the original SSI items was sup-ported. Item Remember things might have different meanings for girls and boys, which might be reflected in the scoring of the item. Girls are generally more com-mitted in their schoolwork [39] and spend more time doing school-related activities than boys [40]. This may indicate that they more often have self-initiated strat-egies for planning and remembering details related to school activities, which might have caused the detected DIF. What caused the DIF in item Homework might be related to that having a medical diagnosis is associated with increased odds of receiving support in Swedish schools [41]. The support may include specific assistance regarding the whole school activity of Homework, such as planning and modifications of tasks or instructions. This assistance might have influenced the higher scoring among students with a diagnosis, even though the stu-dents had the same level of student-environment fit as those without a diagnosis. The detected DIF should be investigated further to evaluate its clinical effect and whether they are also present in other samples.
Methodological considerations
The Rasch analysis was chosen since it facilitates disclos-ure of measdisclos-urement issues that may not be easily de-tected by traditional analyses [26]. Another advantage is that students with missing responses in some items could be included since the model does not require complete data to estimate person parameters [21, 22]. The skewness in used SSI rating categories was a limita-tion which might have negatively affected the evalualimita-tion of the scale. A sample generating data with more equal distribution among used rating categories would be de-sirable in further studies.
Conclusion
The findings provide support of construct validity of the SSI for use among regular high school students with spe-cial educational needs in order to provide and evaluate en-vironmental adjustments. Assessing student-environment fit to be able to provide environmental adjustments for students is essential, and for this evaluation the SSI could be used as a valuable tool by personnel at schools and stu-dent health units. However, the items with the detected DIF and the SSI rating scale with its disordered thresholds needs to be further scrutinized.
Abbreviations
Acknowledgements Not applicable.
Funding
This study was supported by the Swedish Institute of Assistive Technology (SIAT) and Linköping University. SIAT met the costs for the personnel performing the data collection in this study and had no role in the writing of this manuscript, in the decision to submit the manuscript for publication, nor in the study design, analysis or interpretation of data.
Availability of data and materials
The data used in this study are not openly available, but can be obtained upon reasonable request under the permission of Linköping University and the corresponding author.
Authors’contributions
All authors contributed to the design of this paper. MY was the first author and EE the principal investigator, together they performed and interpreted the analyses with support from MM, HL and HH. The co-authors (MM, HL, HH and EE) were closely involved in the drafting of the manuscript and gave in-tellectual inputs to the first author (MY). All authors have read and approved the manuscript.
Ethics approval and consent to participate
Approval from the Regional Ethics Board in Linköping, Sweden was obtained, study code 2013/409-31. Written informed consent was obtained from all participants included in the study.
Consent for publication Not applicable.
Competing interests
The authors declares that they have no competing interests.
Helena Hemmingsson (HH) who is a co-author of this publication is also the main author to the School Setting Interview (SSI). The SSI was developed by her in the early 90ths and was first published in 1998 by her and colleagues. The SSI is commercial available by the Swedish Association of Occupational Therapist that have the rights to the assessment and for that HH received 10,000 Swedish crowns.
In this publication, secondary data is used and HH has neither influenced selection of participants or data collection.
Publisher’s Note
Springer Nature remains neutral with regard to jurisdictional claims in published maps and institutional affiliations.
Received: 8 June 2017 Accepted: 18 December 2017
References
1. European Agency for Development in Special Needs Education. Special Needs Education Country Data 2012, Odense, Denmark: European Agency for Development in Special Needs Education.
2. American Psychiatric Association. Diagnostic and statistical manual of mental disorders, 5thed. Arlington, VA: American Psychiatric Publishing, 2013.
3. DuPaul G, Weyandt L, O'Dell S, Varejo M. College students with ADHD: current status and future directions. J Atten Disord. 2009;13(3):234–50. 4. Reiter A, Tucha O, Lange KW. Executive functions in children with dyslexia.
Dyslexia. 2005;11(2):116–31.
5. Fletcher JM. Adolescent depression and educational attainment: results using sibling fixed effects. Health Econ. 2010;19:855–71.
6. Patel V, Flisher AJ, Hetrick S, McGorry P. Mental health of young people: a global public-health challenge. Lancet. 2007;369:1302–13.
7. Marques JC, Oliveira JA, Goulardins JB, Nascimento RO, Lima AM, Casella EB. Comparison of child self-reports and parent proxy-reports on quality of life of children with attention deficit hyperactivity disorder. Health Qual Life Outcomes. 2013;11(1):186.
8. Svavarsdottir EK, Orlygsdottir B. Health-related quality of life in Icelandic school children. Scand J Caring Sci. 2006;20(2):209–15.
9. International Classification of Functioning. Disability and health for children and youth version (ICF-CY). Geneva: WHO; 2007.
10. Kielhofner G. Model of human occupation–theory and application. 4th ed. Philadelphia: Lippincott Williams & Wilkins; 2008.
11. UNICEF. The right of children with disabilities to education: a rights-based approach to inclusive education. Geneva: UNICEF Regional Office for Central and Eastern Europe and the Commonwealth of Independent States (CEECIS), 2011.
12. European Agency for Development in Special Needs Education. Information and communication Technology for Inclusion–developments and opportunities for European countries. Odense: European Agency for Development in Special Needs Education, 2013.
13. Patton G, Franzcp MD, Bond L, et al. Changing schools, changing health? Design and implementation of the gatehouse project. J Adolesc Health. 2003;33:231–9.
14. Hemmingsson H, Borell L. Environmental barriers in mainstream schools. Child Care Health Dev. 2002;28(1):57–63.
15. Hemmingsson H, Egilson S, Lidström H, Kielhofner G. The school setting interview (SSI), version 3.1. Swedish Association of Occupational Therapists: Nacka; 2014.
16. Hemmingsson H. Bedömning av Anpassningar i Skolmiljön [The School Setting Interview]. Stockholm: Förbundet Sveriges arbetsterapeuters förlagsservice; 1998.
17. Hemmingsson H, Kottorp A, Bernspång B. Validity of the school setting interview: an assessment of the student-environment fit. Scand J Occup Ther. 2004;11:171–8.
18. Hoffman O, Hemmingsson H, Kielhofner G. The school setting interview: a users manual. Chicago: University of Illinois, Department of Occupational Therapy; 2000.
19. Egilson S, Hemmingsson H. School participation of pupils with physical and psychosocial limitations: a comparison. Br J Occup Ther. 2009;72(4):144–52. 20. Rasch G. Probabilistic models for some intelligence and attainment tests.
Copenhagen: Danish Institute for Educational Research; 1960.
21. Tennant A, Conaghan PG. The Rasch measurement model in rheumatology: what is it and why use it? When should it be applied, and what should one look for in a Rasch paper? Arthritis Rheum. 2007;57(8):1358–62.
22. Pallant FJ, Tennant A. An introduction to the Rasch measurement model: an example using the hospital anxiety and depression scale (HADS). Br J Clin Psychol. 2007;46:1–18.
23. Andrich D, Lyne A, Sheridan B, Lou G. RUMM 2030: Rasch unidimensional measurement models (software). Perth: RUMM Laboratory Pty Ltd; 2013. 24. Hudgens S, Dineen K, Webster K, et al. Assessing statistically and clinically
meaningful construct deficiency/saturation: recommended criteria for content coverage ant item writing. Rasch Meas Trans. 2004;17:954–5. 25. Linacre JM. Sample size and item calibration stability. Rasch Meas Trans. 1994;7:28. 26. Hagquist C, Bruce M, Gustavsson JP. Using the Rasch model in nursing
research: an introduction and illustrative example. Int J Nurs Stud. 2009; 46(3):380–93.
27. Schumacker RE, Smith EV Jr. Reliability a Rasch perspective. Educ Psychol Meas. 2007;67(3):394–409.
28. Pallant FJ, Miller LJ, Tennant A. Evaluation of the Edinburgh post Natal depression scale using Rasch analysis. BMC Psychiatry. 2006;6(28):1–10. 29. Raîche G. Critical Eigenvalue sizes (variances) in standardized residual
principal components analysis. Rasch Meas Trans. 2005;19:1012. 30. Linacre JM, Tennant A. More about critical Eigenvalue sizes (variances) in
standardized-residual principal components analysis (PCA). Rasch Meas Trans. 2009;23(3):1228.
31. Marais I, Andrich D. Formalizing dimension and response violations of local independence in the Unidimensional Rasch model. J Appl Meas. 2008;9(3): 200–15.
32. Wright BD, Masters GN. Number of person or item strata (4G+1)/3. Rasch Meas Trans. 2002;16(3):888.
33. Delbetänkande av Digitaliseringskommissionen Stockholm [Report from The Digitalisation Commission (in Swedish)]. Statens Offentliga Utredningar [Swedish Government Official Reports]. (SOU); 2014. p. 13.
34. SFS 2010:800. Skollagen [the Swedish education act]. Stockholm: Utbildningsdepartementet, 2010.
36. Hagquist C, Andrich D. Is the sense of coherence-instrument applicable on adolescents? A latent trait analysis using Rasch-modelling. Personal Individ Differ. 2004;36:955–68.
37. Andrich D, Hagquist C. Detection of differential item functioning using analysis of variance. In: Conference paper: the second international conference on measurement in health, education, psychology and marketing: developments with Rasch models. Perth: Murdoch University; 2004.
38. Scott WN, Fayers MP, Aaronson KN, et al. Differential item functioning (DIF) analyses of health-related quality of life instruments using logistic regression. Health Qual Life Outcomes. 2010;8(81):1–9.
39. Vantiegen W, Van Houtte M. Differences in study motivation within and between genders: an examination by gender typicality among early adolescent. Youth Soc. 2015;30:1–28.
40. Wagner P, Schober B, Spiel C. Time students spend working at home for school. Learn Instr. 2007;18:309–20.
41. Isaksson J, Lindqvist R, Bergström E. School problems or individual shortcomings? A study of individual educational plans in Sweden. Eur J Spec Needs Educ. 2007;22(1):75–91.
• We accept pre-submission inquiries
• Our selector tool helps you to find the most relevant journal • We provide round the clock customer support
• Convenient online submission • Thorough peer review
• Inclusion in PubMed and all major indexing services • Maximum visibility for your research
Submit your manuscript at www.biomedcentral.com/submit