University of Pennsylvania
ScholarlyCommons
Publicly Accessible Penn Dissertations
1-1-2013
Fringe Benefits
Catherine BrinkleyUniversity of Pennsylvania, [email protected]
Follow this and additional works at:http://repository.upenn.edu/edissertations
Part of theAgricultural and Resource Economics Commons,Agricultural Economics Commons, and theUrban Studies and Planning Commons
This paper is posted at ScholarlyCommons.http://repository.upenn.edu/edissertations/837
For more information, please [email protected].
Recommended Citation
Fringe Benefits
Abstract
This study tests the hypothesis that increased rugosity (the ratio between urban perimeter and farmland area) of the rural-urban fringe allows farms to create greater value for their regions through greater access to urban markets. Findings show that increased rugosity is not associated with farmland loss despite correlating with greater population growth. Rugosity is, instead, associated with higher agricultural sales per acre and more farm-to-city networks. Using the urban interface as a variable to understand farm production and stabilization, this paper includes a spatial statistical analysis of county-level metro-area farm products, farmland loss, and demographics in relation to the concentricity of urban morphology in the United States. Four case studies reveal spatial and social network patterns of direct farm sales and donations of raw product. Farm-to-city market director interviews ground-truth these farm-city functions in relation to county and state-level policies that govern urban and farmland morphologies and function.
Degree Type Dissertation
Degree Name
Doctor of Philosophy (PhD)
Graduate Group
City & Regional Planning
First Advisor Thomas Daniels
Keywords
farmland, farm networks, Gephi, growth management, morphology, rugosity
Subject Categories
Agricultural and Resource Economics | Agricultural Economics | Agriculture | Urban Studies and Planning
FRINGE BENEFITS
Catherine Brinkley
A DISSERTATION
in
City and Regional Planning
Presented to the Faculties of the University of Pennsylvania
in
Partial Fulfillment of the Requirements for the
Degree of Doctor of Philosophy
2013
Supervisor of Dissertation
---
Dr. Thomas Daniels, Professor of City & Regional Planning
Graduate Group Chair Person
__________________________________________
Eugenie L. Birch, Lawrence C. Nussdorf Professor of Urban Research and Education, City & Regional Planning
Dissertation Committee
Thomas Daniels, Professor of City & Regional Planning
Eugenie L. Birch, Lawrence C. Nussdorf Professor of Urban Research and Education, City &
Regional Planning
FRINGE BENEFITS
COPYRIGHT
2013
iii DEDICATION
To Leif, who has been with me since the beginning of this process. I look forward to
iv
ACKNOWLEDGMENTS
Thank you to my dissertation committee: Thomas Daniels, David Galligan and
Eugenie Birch. I could not have wished for a better adviser than Thomas Daniels; his
rapid and thorough reviews of this dissertation and other manuscripts has enabled me
to turn work around with confidence and alacrity, setting a starting gate tempo and
quality that I hope will one day match his own. The vigorous debates, ease of
conversation, and his working knowledge of nearly every county-level comprehensive
plan in America are the ideal blend of considerate thoughtfulness and grounded
practicality. Bridging the worlds of planning and veterinary medicine would not have
been possible without the statistical oversight of David Galligan and his command
over local, national and international food dynamics that shape the price of
commodities and lay of the land. Thank you for venturing into this new territory with
me, for your expertise and mentorship during the China Dairy Program. How on earth
can one adequately thank Eugenie Birch? The chair of the doctoral program, she has
made graduate school an utter delight from the first year with immersive research,
doctoral camaraderie, global networking and an emphasis on policy-oriented
outcomes. Thank you for the opportunity to learn from your leadership, writing, and
enthusiastic love of planning.
Thank you to my colleagues with whom I have had the pleasure of collaborating.
Domenic Vitiello steered me to productive conferences and instilled a conviction in
the successful outcomes of a discursive learning process. Amy Hillier and Benjamin
v unlike the loneliness of a dissertation, it always had an end in sight, good company,
and the potential to be implemented immediately in local policy.
My doctoral cohort has given me the unreasonable expectation that future planning
has the analytics, tools, and power to correct whatever deficiencies we face today. If
you are the indicators of what is to come, I cannot wait to be a part of it! Amanda
Johnson, Stephanie Ryberg, Matthias Sweet, and Amy Lynch: thank you for leading
the way and providing some very thorough dissertation models. Kirsten Kinzer and
Mengke Chen, thank you for encouragement, status updates and advice that pepped us
onward and upward through the entire process. I thank Laurel Redding for statistical
advice and strategizing sessions over vigorous tennis and squash games. Kenneth
Steif, thank you for not charging me for your expert GIS counseling, for not laughing
too hard at my GIS follies, and for the first glimpse at your editorial pieces that are
surely going to lead to a timely and high impact dissertation- if not valuable policy for
the future of Philadelphia’s neighborhoods and public schools.
I thank academic colleagues outside of the University of Pennsylvania for their
support: Carolyn Chernoff and Andrew Spetzer for their inspirational eloquence
during our dissertation boot camp workshops and the positive neighborhood
involvement. The patent-pending ‘Chernoff Method’ deserves credit for moving me
forward through numerous fifteen minute writing sessions and enabling me to reduce
any overwhelming feat to a crumpled, checked-off to-do list. Katrin Anacker has
offered gentle career advice and professional introductions whether we met in
vi supplied assistance with numerous agricultural census queries for my rather unwieldy
dataset.
I sincerely thank the study participants, numerous farmers and planners, who took the
time to self-reflect and contribute to this work. I hope that investment in this study
will be worthwhile for all of us. The staff in City Planning and the Veterinary School
has been a wonderful resource, constantly reassuring me that I would come out the
other end of this process. A special thanks to Michael Atchison, Mattie Green,
Roslynne Carter, and Kate Daniel.
My mystified family has politely inquired and even listened to long rants about
methane digesters, urban morphology, and the fluctuating price of soy in China as it
affects Washington State land-use. Elizabeth Brinkley, my sister and a talented
graphic designer, went so far as to help me visualize urban rugosity. Jonas Persson, as
usual, has gone above and beyond our wedding vows in building a custom-made
Gephi program so that I could analyze my data- while providing in-house tech
support, child watch, prep sessions, support, belief and encouragement along the way.
vii
ABSTRACT
FRINGE BENEFITS
Catherine Brinkley
Professor Thomas Daniels
viii
Contents
DEDICATION ...iii
ACKNOWLEDGMENTS ... iv
ABSTRACT ... vii
CHAPTER 1. Introduction... 1
CHAPTER 2. Rugosity Derived from Spatial Ecological Theory ... 6
CHAPTER 3. Methodology ... 13
National Scan ... 13
Descriptive Statistics and Spatial Multivariate Regression ... 14
Top 30 Counties with the Most Non-Concentric Urban Areas... 15
Case Studies on Rugosity and Farmland Loss: four counties ... 16
Agricultural Farm-to-Market Network Mapping ... 18
Interviews ... 20
CHAPTER 4. Deriving Rugosity from Planning Theory, History and Practice ... 22
Urban Theory ... 23
Urban History... 27
Rural Development Theory ... 31
Theory of Rural-Urban Transition ... 34
Joining Rural and Urban Theory... 37
Adjusting Planning Theory ... 41
Planning on the Fringe ... 44
Taking the Rugosity Theory Further... 48
CHAPTER 5. Measuring Rugosity and its Influence ... 49
Determining a Rugosity Measurement ... 51
Agricultural Production across the U.S. ... 53
Rugosity in Relation to National Agricultural Production ... 59
Statistical Correlations ... 62
T-Test ... 68
Multivariate Regression ... 70
Top 30 Counties with the Most Non-concentric Urban Areas ... 81
CHAPTER 6. Rugosity, Planning and Farmland Loss: Four Case Studies ... 97
Case Selection ... 97
Land-Use Profile Comparison ... 99
State and Local Farmland Preservation Efforts ... 107
ix
Baltimore County Land-Use Planning ... 112
Chester County Land-Use Planning... 119
Kent County Land-Use Planning ... 125
Salem County Land-Use Planning ... 129
CHAPTER 7. Rugosity and Farm Function: Farm-to-Market Network Analysis... 138
Limitations of farm network mapping ... 138
Reach and Direction of Farm Networks ... 143
CHAPTER 8. Interviews about County Form and Function ... 149
Baltimore County, MD ... 150
Chester County, PA ... 154
Salem County, NJ ... 161
Kent County, DE ... 165
Conclusions ... 168
CHAPTER 9. Conclusions and Recommendations ... 172
Establishing the Theory of Rugosity... 172
Testing the Theory of Rugosity ... 175
Adjusting Planning Practice ... 177
Examples of High Rugosity Planning ... 183
APPENDIX ... 186
Appendix A: Planning regulations in the top 30 counties with the most non-concentric Urban Areas... 186
Appendix B: Interview and Farm Network Solicitation Materials ... 200
IRB-approved Interview Recruitment Letter ... 200
Sources used to find county farms ... 202
Farm Network Recruitment Email ... 205
Template for Interview Questions ... 207
List of Interviewees... 208
BIBLIOGRAPHY ... 210
x LIST OF TABLES
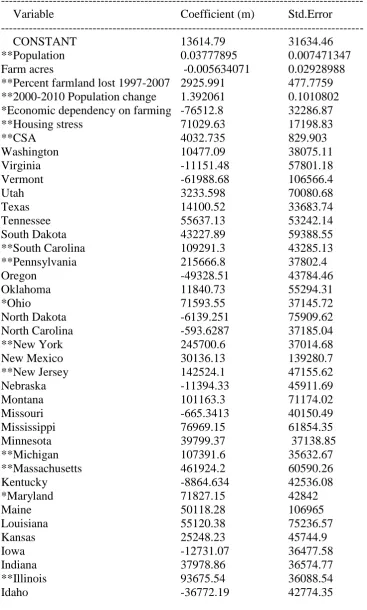
TABLE 1.SUMMARY OF HIERARCHICAL REGRESSION ANALYSIS FOR VARIABLES TOTAL
AGRICULTURAL SALES PER COUNTY (N=458)*P <.05.**P <.01. THE MEAN FOR
COUNTY AGRICULTURAL SALES ACROSS THE 458 COUNTIES WAS $160M;
STANDARD DEVIATION OF TOTAL AGRICULTURAL SALES IN 2002(MODEL 4):
+/-$281M, WITH A STANDARD ERROR OF $148M, CONSTANT OF $-37.875M. B=
$1.00 UNITS. ... 74
TABLE 3.VERIFICATION OF UA PERIMETER CONSTANT BY SYSTEMATICALLY REMOVING VARIABLES. ... 76
TABLE 4.REGRESSION ON LENGTH OF UA PERIMETER.NUMBER OF OBSERVATIONS: 458,MEAN DEPENDENT VARIABLE:202 KM ,STANDARD DEVIATION OF DEPENDENT VARIABLE:+/-200 KM ,LAG COEFF.(LAMBDA): -0.981981, R-SQUARED :0.754651,*PROBABILITY <.05,** PROBABILITY 0.01 ... 77
TABLE 5.COUNTIES WITH THE MOST NON-CONCENTRIC URBAN AREA PERIMETER, WHERE THE VARIABLE ‘CONCENTRIC’ IS A MEASURE OF HOW MANY TIMES GREATER THE CIRCUMFERENCE OF A CIRCLE THE UA IS. A CONCENTRIC READING OF 1 IS AN EXACT CIRCULAR CIRCUMFERENCE. A CONCENTRIC READING OF 1 IS AN EXACT CIRCULAR CIRCUMFERENCE. A CONCENTRIC READING OF 2 IS TWICE THE CIRCUMFERENCE OF A CIRCLE FOR THE SAME GIVEN AREA. ... 83
TABLE 6.CASE SELECTION BASED ON DIFFERENTIAL RUGOSITY AND FARM ACRES LOST, SIMILAR TOTAL FARM ACRES AND POPULATIONS, AND PROXIMITY TO SIMILAR URBAN MARKETS... 98
TABLE 7.AGRICULTURAL PROFILES IN STUDY COUNTIES.COUNTIES WITH RED TEXT HAVE HIGH RUGOSITY AND SHADED COUNTIES EXPERIENCED GREATER FARMLAND LOSS. ... 101
TABLE 8.APRIORI-DERIVED CODES USED FOR NETWORK ANALYSIS. ... 142
TABLE 9.FARM NETWORK REACH AND DIRECTION FOR STUDY COUNTIES. ... 144
xi LIST OF FIGURES
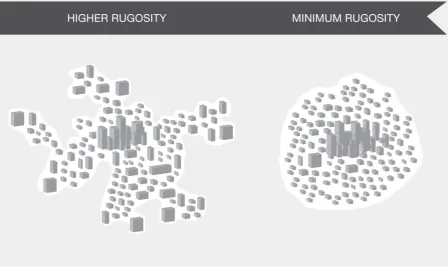
FIGURE 1.RUGOSITY VISUALIZATION.HIGHER RUGOSITY (LEFT) AND MINIMUM
RUGOSITY (RIGHT) FOR THE SAME URBAN AREA (SHOWN IN WHITE WITH
SIMULATED BUILDINGS) AS COMPARED TO THE RURAL AREA (SHOWN IN GRAY).
HIGHER URBAN RUGOSITY CAN BE ACHIEVED BY MAXIMIZING THE INTERFACE
BETWEEN RURAL AREAS AND NATURAL/RURAL LANDS THROUGH IMPLEMENTATION
OF GREENBELTS, GREEN WEDGES, AND WILDLIFE HABITAT CORRIDORS. HIGHER
DENSITIES ON THE URBAN INTERFACE WILL ALSO INCREASE THE FUNCTIONAL RUGOSITY OF THE URBAN AREA.IMAGE COURTESY OF ELIZABETH BRINKLEY. ... 5
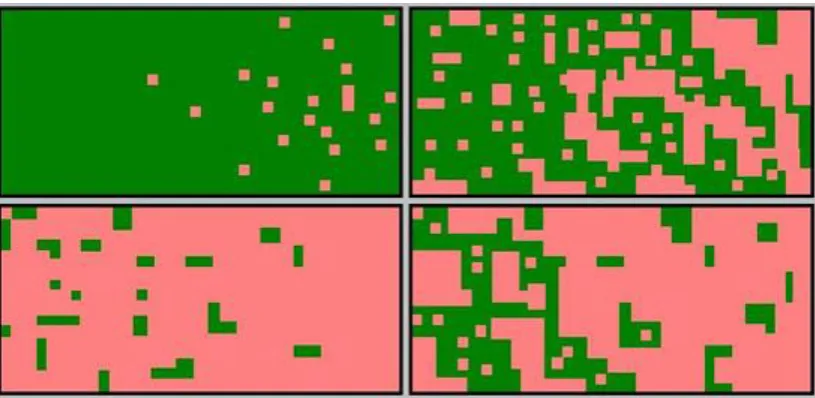
FIGURE 2.FRAGMENTATION PROCESS OF FARMLAND (GREEN) BY URBAN (PINK)
INVASION. FRAGMENTATION CAN BE SUMMARIZED IN SEVERAL DIFFERENT
PHASES.CLOCKWISE, FROM THE UPPER LEFT PANEL:(A) PERFORATION (INITIAL SMALL OPENINGS),(B) DISSECTION (LARGER INTRUSIONS OF CHANGE, OFTEN
ALONG PHYSICAL FEATURES),(C) DISSIPATION (SPREAD AND COALESCING OF
ALTERATION), AND EVENTUALLY,(D) SHRINKAGE (REDUCTION OF PATCH SIZE),
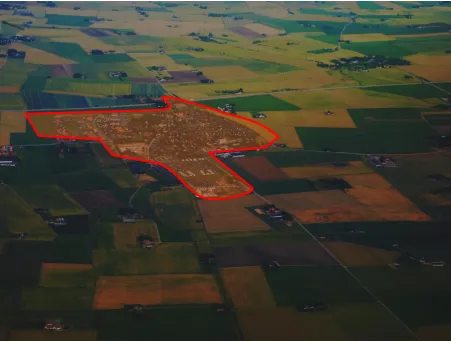
AND ATTRITION (LOSS OF PATCHES). ... 8 FIGURE 3.VISUALIZATION OF RUGOSITY.THE RED LINE ON THE OUTSIDE IS THE
MEASURE OF THE LENGTH OF THE RURAL-URBAN INTERFACE. ADDED TO THIS, ONE
CAN MEASURE THE DENSITY OF FRINGE DEVELOPMENT AND THE CONTIGUITY OF SURROUNDING FARMLAND. ... 11
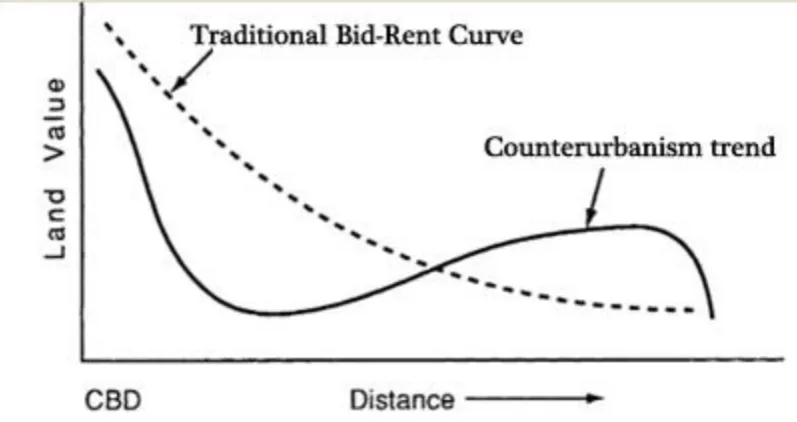
FIGURE 4.LAND VALUE AS A FUNCTION OF DISTANCE FROM THE CENTER CITY.NOTICE
THAT THE COUNTERURBANISM TREND REFLECTS A HIGHER THAN ANTICIPATED
LAND VALUE FOR FRINGE SETTLEMENTS. MANY SUCH GRAPHS USE POPULATION
DENSITY IN EXCHANGE FOR LAND VALUE WITH SIMILAR FINDINGS THAT SHOW A PREFERENCE FOR FRINGE GROWTH PATTERNS. ... 27
FIGURE 5.NATIONAL SCAN COUNTY AGRICULTURAL DEMOGRAPHY COMPARISONS. .... 56
FIGURE 6.COUNTIES USED IN THE NATIONAL SCAN.LARGER STATES WITH THE MORE
TOTAL COUNTIES HAD MORE COUNTIES REPRESENTED IN THE NATIONAL SCAN:
CALIFORNIA (33),TEXAS (33),INDIANA (32),ILLINOIS (30),MICHIGAN (23)
WISCONSIN (22) AND FLORIDA (20) HAD THE MOST COUNTY REPRESENTATION.
2000 COUNTY POPULATIONS RANGED FROM 6,500 PEOPLE IN CARSON COUNTY,
TEXAS TO 9.5 MILLION IN LOS ANGELES COUNTY,CALIFORNIA. ... 57
FIGURE 7.ANIMAL AGRICULTURE CLUSTERING IN HIGH SALES VOLUME COUNTIES.
COUNTIES SHOWED STATISTICALLY SIGNIFICANT SPATIAL AUTO-CORRELATION FOR
2002 HOG PRODUCTION (FAR LEFT MIDWEST AND NORTH CAROLINA), DAIRY
(CENTER CALIFORNIA,UPPER MIDWEST, AND THE NORTHEAST), AND POULTRY
(FAR RIGHT SOUTH AND SOUTHEAST) SALES REVEALING THE DEGREE OF SPATIAL
CLUSTERING OF THESE INDUSTRIES.RED (HIGH OUTLIERS IN SALES),GREEN
(NORMAL),BLACK (NEGATIVE SPATIAL CORRELATION). ... 58
FIGURE 8.COUNTIES WITH THE LEAST CONCENTRIC UA IN ORDER OF IMAGES LEFT TO
RIGHT:A.)ROBERTSON,TN;B.)KENOSHA,WI; AND C.)WASHTENAW COUNTY,
MI. DARK GRAY: URBAN AREA,RED: URBAN AREA PERIMETER,BLUE: COUNTY LINE. ... 60
FIGURE 9.RELATIONSHIP BETWEEN POPULATION GROWTH AND UA PERIMETER LENGTH.
xii
FROM 2000-2010, EXCLUDING THOSE COUNTIES THAT LOST POPULATION. ALMOST
TWO-THIRDS OF THE NATION’S 3,143 COUNTIES GAINED POPULATION BETWEEN
2000 AND 2010.STUDY COUNTIES SHOWED A SIMILAR BREAKDOWN. SOME OF THE
OUTLIERS THE FASTEST GROWING COUNTIES, INCLUDING LOS ANGELES COUNTY,
CA;HARRIS COUNTY,TX; AND MARICOPA COUNTY,AZ WHICH GAINED OVER
300,000 PEOPLE THIS DECADE. OUTLIERS FOR URBAN PERIMETER LENGTH INCLUDE SAN BERNARDINO AND RIVERSIDE COUNTIES IN CALIFORNIA,
WORCESTER COUNTY,MA AND MARICOPA COUNTY,AZ WITH OVER 1000 KM OF
URBAN AREA PERIMETER. ... 64
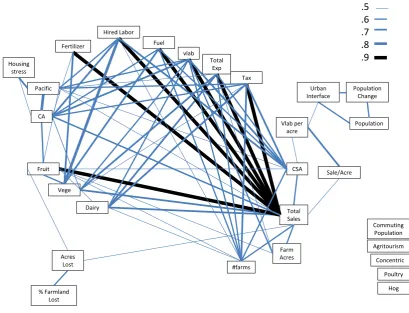
FIGURE 10.CORRELATION WEB FOR SELECT VARIABLES. VLAB:1997 VALUE OF LAND
AND BUILDINGS,VEGE:1997 TOTAL VEGETABLE SALES,CA:CALIFORNIA,TOTAL
EXP: TOTAL FARM EXPENSES 1997,CSA: NUMBER OF COUNTY FARMS WITH
COMMUNITY SUPPORTED AGRICULTURE. ... 68
FIGURE 11.WASHTENAW COUNTY,MICHIGAN REMOTE-SENSING FARMLAND DATA
(LEFT: FARMLAND: GREEN,UA: GRAY,UA BOUNDARY: RED) SUPPORTS THE FINDING THAT AGRICULTURAL ZONING DOES NOT ALWAYS PRESCRIBE
AGRICULTURAL USE BUT THAT ACTIVELY FARMED AGRICULTURAL LAND LARGELY
BOUNDS THE UA PERIMETER. COMPOSITE ZONING MAP (RIGHT,WASHTENAW
COUNTY DEPARTMENT OF PLANNING &ENVIRONMENT,SEMCOG,LOCAL UNIT OF
GOVERNMENT MASTER PLANS) ILLUSTRATES IN COMPARISON WITH THE URBAN
AREAS, HOW AGRICULTURALLY-ZONED LAND BOUNDS THE IRREGULARLY SHAPED
URBAN CORE.COMPARE WITH FIGURE 8(8C). ... 87
FIGURE 12.URBAN DEVELOPMENT DENSITY GRADATION DROP-OFF.ABOVE:
GRADATION OF DEVELOPMENT LAND-USE PRESENTED FROM THE SAN DIEGO
COUNTY GENERAL PLAN (2011). BELOW:THE AUTHOR SUGGESTS STEEPER DROP
-OFF OF DENSITY, ALLOWING MORE RESIDENTS AND BUSINESS TO BENEFIT FROM
THE TYPE OF AGRICULTURAL AMENITIES PRESENTED BY PERI-URBAN FARMERS. TO
ALLOW FOR THIS, THE AUTHOR RECOMMENDS AN UPTICK IN DEVELOPMENT
DENSITY AT THE FRINGE, AND STRICT CONTROL TO MINIMIZE DEVELOPMENT
OUTSIDE THE URBAN GROWTH BOUNDARY. ... 96
FIGURE 13.REMOTELY SENSED LAND-USES IN CASE STUDY COUNTIES (BALTIMORE,
MD;CHESTER,PA;KENT,DE; AND SALEM,NJ) AND SURROUNDING ENVIRONS.
SOURCE: HTTP://NASSGEODATA.GMU.EDU/CROPSCAPE/ ... 100
FIGURE 14.LAND-USE PROFILES IN STUDY COUNTIES. TOP TO BOTTOM:BALTIMORE,
CHESTER,KENT AND SALEM COUNTY. ... 106
FIGURE 15.SALEM COUNTY FARMLAND PRESERVATION (DARK BROWN). NOTICE THAT
THE PRESERVED FARMLAND (DARK BROWN) IS NOT NECESSARILY CONTIGUOUS,
NOR NEAR THE URBAN AREAS. ... 108
FIGURE 16.BALTIMORE COUNTY URBAN-RURAL DEMARCATION LINE BOUNDARY. . 113
FIGURE 17.BALTIMORE COUNTY’S EIGHT EXISTING GREENWAY AND PLANNED
GREENWAYS (NUMBERED) IN RELATION TO PERMANENTLY CONSERVED LANDS. 118
FIGURE 18.MAP OF CHESTER COUNTY,PENNSYLVANIA AND ITS PLANNED AND
EXISTING LANDSCAPES, FROM LANDSCAPES2. ... 122
FIGURE 19.KENT COUNTY ZONING MAP. NOTICE THAT AC(AGRICULTURAL
CONSERVATION) AREAS LARGELY BOUND URBAN AREAS AS OPPOSED TO AR
(AGRICULTURAL RESIDENTIAL) AREAS. THESE TWO ZONES MAKE UP MOST OF THE
xiii FIGURE 20.SALEM COUNTY ZONING MAP. MOST OF THE COUNTY IS ZONED FOR 1-5
ACRES DEVELOPMENTS. ... 132
FIGURE 21.REACH AND DIRECTION OF AVERAGED FARM NETWORK SUB-SETS IN
RELATION TO URBAN, SUBURBAN AND RURAL LAND-USE PATTERNS. ... 145
FIGURE 22.BALTIMORE NETWORK REPRESENTED GEOGRAPHICALLY (BOTTOM) AND
SOCIALLY (TOP).THE GEOGRAPHICAL NETWORK SHOWS THAT BALTIMORE
COUNTY DRAWS FROM NEARBY FARMS AND SELLS TO NEARBY MAJOR CITIES.
NOTICE FROM THE SOCIAL NETWORK, THAT FARMS TEND TO SPECIALIZE ON TYPE
OF MARKETING EFFORT. ... 147
FIGURE 23.FARM-MARKET NETWORKS FOR ALL STUDY COUNTIES. BALTIMORE AND
CHESTER COUNTIES REPRESENT NETWORK HOTSPOTS IN COMPARISON TO SALEM
AND KENT COUNTIES WHERE THERE ARE FEWER NETWORKS. ... 148
FIGURE 24.GEOGRAPHICAL NETWORK OF CHESTER COUNTY FOOD BANK GARDENING
AND GLEANING PROGRAMS. ... 157
1
CHAPTER 1. Introduction
Many people perceive a need to protect peri-urban farming because it operates with
high resource efficiency on prime agricultural soils and produces local food and
valuable ecological services. In the US, metropolitan statistical areas have more total
prime agricultural soils than do rural areas (USDA, 2007). Prime farmland produces
the highest agricultural yields with minimal inputs of energy, water and economic
resources, and farming it results in the least damage to the environment. Metropolitan
area farms account for 91% of all fruits, nuts and berries production; 78% of
vegetables, 67% of dairy, and 54% of poultry and eggs production though these
“urban influenced counties” contain only 20 percent of the total U.S. farmland (2007
Census of Agriculture, USDA Economic Research Service). Internationally,
peri-urban commercial farming plays a significant role in food security for developing
countries and is in the direct path as rapidly developing cities expand (FAO, 1999).
As the world population continues to grow and become more urban, concerns will
increase about adequate food supplies and healthy metro areas, necessitating more
attention to preserving valuable peri-urban farming areas while considering how to
grow urban areas in conjunction (Brouwer and McCarl, 2006).
Scholars have thoroughly documented the tensions brought by urban growth that
intrudes into farmland. While many planners argue that in order to preserve
financially active center cities and control sprawl (low-density development), planners
must carefully guide urban land use in surrounding rural areas (OECD, 1979; Daniels,
2 pushing development onto inexpensive fringe land. Because most urban centers are
sited on fertile agricultural land in coastal plains or river valleys, when they expand
they convert prime farm land to building sites (Bogue, 1956). Moreover, new urban
settlements often consider nearby farming practices as unwanted nuisances. While
also picturesque, farms can be associated with noise, dust, and odors causing conflicts
and legal battles between farmers and non-farm neighbors (Lopez et al, 1988; Schwab
1998; Kim, Goldsmith, and Thomas 2009). With this line of thought, planners seek to
minimize the interactions between rural farming land-uses and urban uses, calling for
buffer zones between urban and farmland uses and concentric urban edges that
minimize conflicting land-use abutments.
In the recent decades, to limit urban development on farmland and rural-urban
tensions, planners gave considerable attention to managing a compact urban
morphology with distinct separations between urban and farm lands (Daniels, 1997;
Furseth and Lapping, 1999). Noting the friction between farm and urban
communities, planners have developed tools to maintain farm and urban land function
through growth management practices. These practices take two principal
forms: formal mandatory regulation including urban growth boundaries, urban limit
lines, annexation limits, and agricultural zoning; and less formal voluntary efforts,
featuring the purchase and donation of development rights to public agencies and
private land conservancies. While not explicitly stated, many of these policies do not
seek to intentionally increase the rural-urban interface nor interlace rural and urban
3 Only recently have scholars noted some of the benefits peri-urban farming for nearby
urban areas. In addition to food production, peri-urban farms have adapted ancillary
programs for energy, waste management, recreation, and education to remain
financially solvent near expanding metro areas (Brinkley, 2012). Farmland also
provides non-market benefits to urban areas through amenity values of open space
and rural character, slowing suburban sprawl, increasing wildlife habitat, and enabling
such important ecosystem functions such as groundwater recharge (Gardner 1977;
Wolfram 1981; Fischel 1985; McConnell 1989; Bromley and Hodge 1990; Nelson
1992; Kline and Wichelns 1998; Duke and Aull-Hyde 2002). Farmland proximity to
urban areas can increase urban access to these ecosystem services. Considering the
impact of rural-urban proximity as a landscape issue necessitates attention to three
dimensional consideration of form and function, not only proximity of the land uses.
Considering farmland as a valuable ecosystem capable of correcting for urban deficits
in clear air, clean water and recreational opportunity, planners have yet to study the
impact of weaving these complimentary land-uses together to maximize abutment.
Regrettably, many planners guide urban morphology without understanding fully how
its form impacts peri-urban farm functions or urban functions (Irwin and Nickerson,
2003; Bergstrom and Ready, 2009). This work will analyze urban form as it relates to
the function of peri-urban farm services. The underlying assertion tested in this
research is that urban areas that are more physically intertwined with their peri-urban
farmlands will collaborate more, resulting in both an increase in the farm amenity
services and decreased rates of urban sprawl as the surrounding farmlands are valued
4 farm-urban interface, the greater urban and farm value generation through proximity
of amenity destinations, decreased sprawl, social networking around local food, and
organic infrastructure services that connect cities to their hinterlands.
This hypothesis about form and function is explored through the ecological concept of
rugosity (Figure 1), the measurement of a functional surface’s boundary with an
environment through which it absorbs nutrients or exudes waste. In ecology, the
measurement of a coral reef’s rugosity (exterior roughness) is useful as an indicator of
surface area available for nutrient transport. Similarly, the rugosity of the seafloor
may indicate the amount of habitat available for colonization by benthic organisms.
In this study, the rugosity of an urban area in relation to farmland may indicate the
amount of city interactions, where more urban rugosity indicates greater
farm-city collaboration. Testing different measurements of rugosity against U.S. county
datasets, rugosity is related to demographics, farm product, and farmland loss.
Farm-city program coordinator interviews and planning document review reveal how
6
CHAPTER 2. Rugosity Derived from Spatial Ecological Theory
The rugosity theory of urban growth has antecedents in some of the more modern
spatial ecological theories and the study of landscape ecology. Landscape ecology
links growth and shrinkage of organism colonies to resource feedback loops that
subsequently influence the landscape and evolutionary trajectories of those particular
colonies as they co-evolve with their ecosystem (Wu & Loucks 1995). City
morphology in relation to surrounding ecosystems is similarly being studied since the
late 1980s when Forman and Godron (1986) published their seminal text on landscape
ecology, bridging spatial ecology scientific interests — typically focused on
heterogeneity in ecosystems — with more anthropocentric scientific traditions of
geography, landscape architecture, and planning, rooted in the long history of
human-based landscape alteration.
The subsequent study of urban morphology and spatial ecologies are made up of
several ecological theories. Holling (1992) proposes that organisms and even
communities of organisms have evolved physical and behavioral characteristics to
exploit the environmental texture of their landscape in the same way that many
resources have shaped city growth and form. Urban historian, William Cronon, has
neatly summarized how transit lines and crop production has impacted the size and
function of various cities (Cronon, 1991). Similarly, Holling's textural discontinuity
hypothesis (TDH) posits that because resource distribution is discontinuous across
landscapes, colonies, like cities should reflect this pattern and exhibit discontinuities
7 systems often form specific spatial patterns in response to their environments and
available resources (Marshall, 1997; Milne et al., 1992; O'Neill et al., 1991). The
concept of rugosity can be thus used to explain ontologically how and why cities form
certain morphologies in response to their resources. Yet, because urban morphologies
are as much a consequence of as an influence on their resources, the rugosity could
also explain the efficient uptake and use of resources, such as farmland amenities. To
this end, the concept of rugosity may also be useful in guiding urban growth to take
better advantage of local ecosystem services.
The concept of rugosity is also closely related to the study of landscape spatial
heterogeneity (Turner 2005). Considering urban or agricultural land-uses as patches
on a landscape, the form, critical mass, and relationship of patches of different land
uses or ecosystems to one another has been shown to influence individual patch
survival while also influencing the larger network of patch composition (Cushman et
al. 2010). Landscape concepts regarding loss and fragmentation of vegetation cover
around the world have become fundamental to understanding the carbon cycle, and
predicting the consequences of global climate change (Houghton 1995). In their quest
to understand ecosystem patch survival, scientists are developing a unified framework
to understand the dynamic flows of materials between urban and farmland ecosystems
such as water, nutrients, and chemicals, both in time and space (Costanza et al. 2002).
The ideas can be applied in suggesting strategies for managing the flows of desirable
and undesirable materials between landscapes to influence soil fertility and erosion, or
nutrient cycling and pollution. In the following study, farm networks for raw product
8 configurations. Understanding such farm-to-market sales data requires the
consideration of continuous environmental gradients that would explain soil quality
and potential products produced on the farm as well as purchasing power and
consumer demand in nearby urban areas.
Figure 2. Fragmentation process of farmland (green) by urban (pink) invasion. Fragmentation can be summarized in several different phases. Clockwise, from the upper left panel: (a) perforation (initial small openings), (b) dissection (larger intrusions of change, often along physical features), (c) dissipation (spread and coalescing of alteration), and eventually, (d) shrinkage (reduction of patch size), and attrition (loss of patches).
The development and dynamics of spatial heterogeneity in landscapes is a central
theme of ecological studies, especially the effects of conversion of natural ecosystems
into human dominated systems such as agricultural or urban land use. As a habitat is
altered in a landscape (e.g., farmland to urban land-uses in Figure 2) both the
composition (farmland area) and the configuration (spatial pattern of patches) change.
This conversion is called fragmentation (Figure 2). Certain patch configuration
encourage further fragmentation and degradation of material flow. In biological
9 except at very low proportion of patch composition in the landscape (Fahrig 1997). In
this sense, rugosity of urban areas may play a lesser role in farmland loss than the
critical mass of farmland retention and the availability of farm support services for
machinery, feed and seed, processing, and transportation. Nonetheless, such ideas
have practical consequences for the conservation of farmland and engendering of
farm networks. Namely, will protection of a Single Large patch of farmland or
Several Small patches (the SLOSS tradeoff; Simberloff and Abele 1976) have
equivalent effects on economic farm survival? Similarly for cities, the question
arises, should planners promote a single large city or multiple small villages, and how
connected should these urban systems be with each other and with nearby landscapes,
like farmland?
More recently, these spatial ecology theories have been infused with resilience
theories that predict colony survival, with correlations to firm or farm survival. The
theory of island biogeography predicts that larger and less isolated islands will contain
more species than smaller, more isolated islands. The larger islands will be more
resilient in the face of catastrophic events because there are more species available to
find niches and repopulate the space. This theory is similar to agglomeration
economy theories, where larger cities command more economic draw, more diverse
job markets, and greater population growth. This concept is also found in studies on
the necessary critical mass of farmland to retain agricultural firms or produce diverse
marketing opportunities. This is not to say that a single species cannot dominate an
10 vulnerable to that singular market, or larger, homogenous farming operations are
vulnerable to the vagaries of a single product market.
In relating spatial ecology to the ebb and flow of changing landscapes,
metapopulation theory recognizes that local populations of organisms undergo
periodic colonization and extinction, but that these local populations are linked to
other populations nearby by migration. Hence, the collection of local populations,
termed the metapopulation, can persist indefinitely if rates of local population
extinction are balanced by rates of colonization from surrounding populations. This is
similar to urban agglomeration economies, where small firms may ‘go extinct’ to be
replaced by new firms in the succession of businesses so long as a healthy
re-populating climate exists and there are policies to ensure new firm propagation.
These theories speak to the importance of critical mass of diverse land-uses be that
urban-based firms or agricultural firms, for which knowledge networks engender
propagation and continued agricultural health even as some farms turn over to
11 Figure 3. Visualization of Rugosity. The red line on the outside is the measure of the length of the rural-urban interface. Added to this, one can measure the density of fringe development and the contiguity of surrounding farmland.
These theories have been further connected to spatial planning with advances in the
accessibility of computing, remotely sensed satellite and aerial imagery, development
of geographic information systems (GIS, ARC/INFO was first released in 1982), and
spatial statistical methods (Fortin & Dale 2005). In that sense, the development of
rugosity theory furthers the ecological parallels and can be spatially tested across a
national dataset to explain if an urban area’s form has correlates with the function of
surrounding farmland as ecological theories would predict. The theory of rugosity, or
functional barriers, as it applies to urban morphology contains three main principles:
1. interface exposure, the amount of farmland that is in contact with urban areas
12 2. interface intensity, density of resources or development on the interface (see
Figure 1)
3. patch contiguity, the connectivity or fragmentation of agricultural or urban
land-uses
Only the length of the urban interface as it relates to farmland area or urban area will
be statistically tested in this dissertation due to lack of a national dataset for urban
density, density of farm services. Patch contiguity is partially explored in the 30 case
13
CHAPTER 3. Methodology
The research is divided into two discrete phases: national statistical correlations and
case studies. The first phase of the study is a descriptive and quantitative analysis of
national farmland data at the county-level to find metropolitan-area counties with high
dollar farm output, and select case studies from this data based on rural-urban rugosity
and farm production. The second phase of the research aims to contextualize rugosity
findings in local policy and farm land functionality.
National Scan
The national scan and statistical regression allows a spatial and temporal look into the
association between land in farms, the value of agricultural production, and urban
morphology. A national scan of counties in the continental United States identifies
associations between rugosity, population change (2000-2010), metropolitan farm
output and acreage at the county level over a ten year period (1997-2007). Counties
are pre-screened to have the following criteria: metropolitan statistical area inclusion
and annual agricultural production over $50 million. The pre-screening method
allows the researcher to tailor findings to peri-urban farming counties that still have
consequential farming operations. This national scan will identify if rural-urban
rugosity is associated with farmland acreage stabilization or high value per acre farm
production.
Three calculations of rugosity are explored against the national census and
agricultural data set for appropriateness. Rugosity is measured as the urban area
14 perimeter. These rugosity calculations are spatially joined by county with USDA
amenity scores, U.S.D.A. Agricultural Census data (1997, 2002, 2007), U.S. Census
data (2000, 2010), and 2004 County Typology codes.1 State-fixed effected are
controlled for by relating county variables to their state. As a result, significant
statistical inferences can be made in relation to each rugosity reading to develop an
appropriate measurement.
Descriptive Statistics and Spatial Multivariate Regression
I employed a combination of exploratory (spatial) data analyses and spatial
econometric techniques using several statistical software packages (R, GeoDa and
excel). Descriptive statistics and bivariate analyses were computed first, to explore the
relationships between each of the explanatory variables and the dependent variable y
(i.e. farmland loss or rugosity measurements). Multivariate models were then applied,
with the aim of examining the relative importance of the explanatory variables for the
spatial variation in farmland loss (at the scale of counties). To improve the statistical
inference process, special attention was paid to multicollinearity, spatial heterogeneity
(i.e. heteroskedasticity and/or structural instability) and spatial autocorrelation.
1 An area's economic and social characteristics have significant effects on its development and
15 State and regional control variables were created to control for fixed effects that could
be due to specific policies or geographies in each state. By obtaining multiple
observations from each state and looking at the effect of rugosity within each county,
the state fixed-effects model removes the effect of state-level omitted variable bias.
The following correlation statistics were conducted on the county shapefiles:
mono-variate spatial autocorrelation, bi-mono-variate correlation, and multi-mono-variate spatially
weighted regression in GeoDA with controls for state-based effects. The pearson
correlation product for every set of variables measures the extent to which two
variables "vary together." These correlations were used to identify variables that track
together and to limit using co-linear variables in the regression model created in the
subsequent sections. A paired t-test assuming unequal variances was used on 118
counties paired based on statistically similar population and farm acres, but
significantly statistically different measures of rugosity.
For planning, and particularly the study of urban morphology, place-based effects
matter in crafting policy and explaining farming patterns. For this reason, spatial
multi-variate regression in GeoDa 0.9.5-i (Anselin, 2003b) was used to confirm
associations found in the descriptive correlation statistics.
Top 30 Counties with the Most Non-Concentric Urban Areas
To identify if rugosity is a byproduct of specific land-use planning tools or goals, the
top 30 counties with the most non-concentric urban areas are analyzed for state and
16 analyzed based on satellite imagery of land typologies bounding the UA to ascertain if
certain bounding land-uses influence rugosity. Land-use governing policies are
analyzed through review of state planning support, county comprehensive plans,
county zoning ordinances, and acres preserved by farmland preservation programs.
Like surrounding land-use, preserved farms would also act as hard boundaries for UA.
Secondary literature and studies were used where found to explore the extent to which
county-level planning was effective.
Case Studies on Rugosity and Farmland Loss: four counties
Case studies have three goals: 1) To verify national quantitative findings about the
form of urban morphology and its impacts on farmland function; 2) To explain
planning contexts for creating urban form and farmland functionality; and 3) To tease
apart the impact of rugosity and planning practice on farmland loss. I employed an
embedded multi-case study in four counties: high rugosity and high farmland loss;
high rugosity and low farmland loss; low rugosity and high farmland loss; and low
rugosity and low farmland loss. Cases were chosen based on proximity to similar
markets with similar farm acreages, and statistically dissimilar rugosity across all
three measurements (UA perimeter, concentricity, and farmland rugosity). Counties
were selected from the national sample with the criteria of being located in
Metropolitan Statistical Areas as defined by the 2000 Census with annual agricultural
production over $50M as defined by the 1997 Agricultural Census.
17 1. County context: geography, demography, growth management policies,
number of farms, and a map of rugosity.
a. State-level plans, mandates, and enabling legislation
b. County-level plans and ordinances
c. Farmland preservation and grassroots farmland protection in the
county
d. Scholarly literature evaluating policy success in each county
2. Farm services within each county are compiled, categorized, and analyzed for
typology. Types of farm services may include agricultural tourism, farmers
markets, Community Supported Agriculture, or waste management. A map of
farm services between individual farms and markets is created for each of the
four case study counties. This map will help evaluate the distance between
collaborating farms and urban areas, direction of farm service movement, and
geographical patterns of farm service typologies. See appendix for
IRB-approved recruitment letter and farm/market questionnaire.
3. The context for creating and maintaining farm services is noted in program
director interviews. Information on federal, state and county-level programs
operating within each county is gathered through a web search and interviews
with experts. Program directors and coordinators are invited for a semi
open-ended interview to explore the context surrounding each collaboration project
and policies that encourage or discourage each farm-city
collaboration/network. See appendix for IRB-approved interview recruitment
18 Agricultural Farm-to-Market Network Mapping
This phase of research quantifies the function of farmland in relation to urban
morphologies by mapping farm first point of sale/donation for raw product and
services (composting and school visits) to customers, institutions, and distributors.
Immediate farm marketing channels are the simplest and most transparent part of the
food system: products go straight from producers to users, and money or goodwill
travels back in the other direction via direct, personal interactions with the farmer. To
explore if these direct relationships are geographically bounded, first point of sale or
donation, direct-farm service networks are extrapolated in Gephi and mapped over
urban and farmland morphologies so that network direction, average distance, and
magnitude can be derived for each category of farm-network in relation to landscape
patterns.
Farm-to-market data was scrapped from farm websites listings on googlemaps, county
farm listings, local harvest, and buyer associations (see appendix). Study county
farmers were queried with an electronic questionnaire through email and/or facebook
to identify their products and direct sale/donation markets (wholesalers, CSA member
zipcodes, restaurants, institutions; see appendix). Markets were confirmed through an
email and/or facebook inquiry, which asked them to identify other direct sale farms in
a double verified snow-ball sampling technique (see appendix for email format).
Market and farm locations were geocoded by latitude and longitude based on the
exact address. Farm and market addresses were geocoded for longitude and latitude
19 retail location with satellite imagery. Location was triangulated using the aerial view
from google maps, aerial view from itouchmap, and farm webpages to confirm the
geographical coordinates and ascertain if the wholesale/retailer is located on a farm
and would therefore be considered a farmgate. CSA member purchases were coded at
the zipcode level to protect client confidentiality. This technique allowed the
researcher to capture direct farm networks within, moving into or going from study
counties.
Farm networks for direct food sales and ancillary farm services originating or ending
in case study counties were mapped and analyzed for distance, direction, type,
number, and social network neighbors using Gephi and a custom-made program
created by Jonas Persson. Using the ‘geolayout’ in Gephi, this map of networks was
projected with mercurial projection over a map of remote-sensed urban areas and
farmland based on USDA remote sensing satellite imagery data (cropscape,
http://nassgeodata.gmu.edu/CropScape/).2 Farmland data is available as Geotiff files,
which are raster data. The cultivated crop mask data layer has a 30 meter spatial
resolution and covers the continental United States. Because the remote sensing farm
data are too detailed for analysis, they were amended for a coarser estimate. Using
geoprocessing in the Spaital Analyst toolbox, I selected ‘generalization’ with a
‘majority filter = 4’ such that the kernel of the filter would represent four direct
orthogonal neighbors, each representing 30 square meters of remotely sensed
farmland. This changes the resolution of farm data to 90 sq meters and removes farm
data that does not have four orthogonal neighbors. From this estimate of farm parcel
2 Remote sensing farmdata is based on Cropland Data Layers from 2012. The crop mask data
20 location, I could calculate the overlap with UA to determine how accurate each land
description was. I could also overlay the Gephi geospatial network information to
ascertain where networks were located in relation to satellite imagery of farmland and
urban areas.
This research served as background case research for the interviews and helped the
researcher to understand the social networks surrounding direct food sales and
ancillary farm-city programs. For example, some counties may rely more on farmgate
sales over CSAs. These farm-networks could influence land-use or be a product of
local farm policies. Knowledge of farm networks helped the researcher orient
interview questions about particular types of farm services in each study county.
Interviews
The third phase relates county-level program data to network analysis, to draw growth
management and policy-based conclusions for future work. The third phase draws
from 30 minute semi-open-ended program-director interviews from farm service
umbrella groups (Buy Fresh, Buy Local; Agricultural Extension Office; County
Planning Departments; Farm Bureaus, see appendix for list of interviewees) to assess
farm program establishment, extent, longevity, context, and product for the four case
study counties (see appendix for interview format). All interviews were conducted by
phone with the exception of those in Chester County, which were conducted in
person. Planning policies that enable or hinder farm-city collaborations are identified
21 program and county to draw growth management and policy-based conclusions for
22
CHAPTER 4. Deriving Rugosity from Planning Theory, History and
Practice
Urban and agricultural land value theories have not yet been married to create a
unifying theory of how cities grow within their regions. Scholarly research has
focused on the standard Von Thünen model of higher land values clustering in the
center of urban areas, with land values tapering off steadily the further parcels are
from the center. Data-driven models, however, have not supported these theories
(Heikkila et al, 1989; Boyle and Kiel, 2001; Thorsnes, 2002; Bourassa et al, 2004;
McConnell and Walls, 2005). Meta-analyses of peri-urban amenity values show an
uptick in price per square-foot for housing and land values on the fringe indicated
non-theorized value and desirability of the urban-rural fringe (Bergstrom and Ready,
2009). These findings suggest that land and housing near more rural or scenic areas
can command higher prices than certain inner neighborhoods and suburbs.
Reframing urban history with attention to urban effects on peri-urban farmland
situates a growing city, not in a vacuum of land values, but in its region. To
understand growth, one must understand the economic dynamics, demographic
changes, and planning regimes of rural areas. This research suggests that the theory
of bid-rent models should be adjusted to account for the desirability to live near the
fringe; likewise, planning theory should acknowledge this recurrent phenomenon,
which has been a factor in the United States becoming a Suburban Nation with more
of its population in suburbs than in central cities or rural areas combined. With this
new understanding of high land values on the fringe, cities can be better fitted with
rural-23 urban interface in combination with land preservation policies to minimize unwanted
concentric growth or urban growth over prime, high-value farm and scenic lands.
Combining urban and rural development theory gives rise to a new growth
management paradigm most akin to the ecological concept of rugosity, the
relationship between a functional surface and the environment through which is
absorbs nutrients or exudes waste. Cities, much like living organisms, uptake
nutrients, produce products, and exude waste. In ecology, the measurement of a coral
reef’s rugosity (surface to area ratio) is useful as an indicator of surface area available
for nutrient transport. The rugosity of the seafloor may indicate the amount of
available habitat available for colonization by benthic organisms. Similarly, the
rugosity of an urban area in relation to farmland may indicate the amount of
functional interface available for farm-city ecosystem service and market interactions,
where more urban rugosity indicates greater farm-city collaboration.
Urban Theory
The current understanding of planners who manage urban growth systems is derived
largely from central place theory and data-driven empirical testing of this theory
through spatial analysis. Johann Heinrich Von Thünen is commonly cited as the
founding father of central place theory, though, in fact, his 1826 model was designed
to explain the allocation of agricultural uses. Von Thünen defines the bid-rent curve
as the maximum profit the land would generate if it were devoted to the highest
economic activity. The “highest and best use” principle is found in property
24 value per acre, and because urban land use is often considered the ‘highest and best’
use of land, this can result in pressure to valorize peri-urban farmland for its
development potential and not agricultural productivity. Peri-urban farms may be
subject to high property taxes in the absence of use-value assessment.
In central place theory, land rent is a function of distance from the city center, with
the basic assumption that the farther away from the city, the greater the transportation
costs. Higher-valued land uses would be more economically profitable, and could
afford to locate closer to the central market at the city core, thereby saving on
transportation costs. In terms of agriculture, cash crops are, therefore, located closer
to their markets at the city core, and the uncultivated wilderness furthest from the city
has a bid-rent value of zero reflecting its lack of marketable use. In the Von Thünen
bid-rent model, land values are driven by the demand to be close to central markets
and limited by the profit return from production minus the cost of transportation.
Von Thünen’s model has served as the basis for the monocentric models of city
development and agglomeration economies (Marshall, 1890; Hoover 1936 and 1948),
elaborated upon by Alonso (1964), Mills (1967) and Muth (1969). Later urban
theorists focused, not on agricultural goods, but on residential, commercial and
industrial land uses, to explain how high bid-rent prices are located closer to the city
center where a denser population drives higher demand for products in terms of jobs
and retail. Harris and Ullman (1945) later suggested a model where cities expand, not
around one single central business district, but around several amenity nuclei
25 suggested a tapering off of urban densities similar to what is broadly proposed by the
Andres Duany transect models (Duany and Talen, 2002), which have been widely
adopted by practicing planners.
The underlying assumption by proponents of these models is that population density
dictates land values and location of services (Alig et al., 2004). As such, urban
theorists began to focus on population dynamics as the driver of land values. The
question of whether a city is capable of growing in population, physical space or
economy has been the subsequent source of debate. Production specialization,
infrastructure endowment, central location, or agglomeration economies have
alternatively been emphasized as driving forces of urban population growth (Short,
2006).
Unable to satisfactorily explain urban growth drivers, theorists have insisted on
dissolving cities from their regions in favor of a globalized view of what powers
urban growth. Amin and Thrift note that the ‘‘city’s boundaries have become far too
permeable and stretched, both geographically and socially, for it to be theorized as a
whole’’ (2002, p. 8). More recently, urban theorists have sought to tie city growth to
a global network of cities, noting that urban rates of expansion are tied to city
interconnectedness within the global network of city economies (Hawley, 1968; Pred,
1973; Smith and Weller, 1977; Castells, 1996; Leamer and Storper, 2001). Sassen
(2001) conceptualizes the city as a collection of intersecting, globally-reaching flows
not a bounded metropolis. In this theory, cities are specialized economically to play
26 they export their products to the global market. Contrary to expectation,
specialization appears to play a limited role in urban growth (La Gory and Nelson,
1978). Social and cultural geographers like Sassen (2001) and Amin and Thrift
(2002) argue for new ways of thinking about the drivers of urban growth, though they
neglect to look for these drivers in the immediate regional surroundings of cities.
With a few exceptions, urban theorists have yet to situate the city in its region in any
meaningful way (Jacobs, 1984). What unites the above urban theories represents a
significant diversion from Von Thünen’s early model, where land value is based on
the potential agricultural use of immediate rural lands- factors of soil quality, terrain,
transportation modes and markets. By not acknowledging the potential economic
worth of rural amenities, these urban theories have failed to ground themselves in a
regional context. This oversight is particularly puzzling given the acknowledgement
of amenity value in natural landscapes (Richardo, 1911; Bergstrom and Ready, 2009).
Some scholars even go so far as to diagnose sprawl and amenity valuation as an
artifact of artificially low property taxes that do not encourage land conservation, but
prioritize development potential and land speculation (Gihring, 1999).
In sum, urban theorists have been loath to consider the linkages between rural and
urban land as important in generating value or growth. “Whereas agricultural land is
an independent production unit, where rent is set according to the plot’s own
characteristics, land in the city has its usefulness and rent largely determined by its
linkages with, and access to, other land, buildings and urban facilities” (Kivell, 1993,
27 determined by linkages to markets, and urban theorists have largely looked inward at
urban land values, ignoring the linkages with rural lands. Urban theorists’ ignorance
about rural development and the silo-ing of urban theory contributes to general
confusion over explaining the current trends in land values and growth, where lands
further from the urban core are more highly valued than expected (Figure 4).
Figure 4. Land value as a function of distance from the center city. Notice that the counterurbanism trend reflects a higher than anticipated land value for fringe settlements. Many such graphs use population density in exchange for land value with similar findings that show a preference for fringe growth patterns.
Urban History
Often, these theoretical inclinations manifest in professional planning and its history,
which has sought explanatory frameworks for understanding how and why people
choose to live together in cities (see Mumford, 1961 and Short, 2006). Planning
theory and history fetishize dense urban agglomerations, and largely neglect the
phenomenon of choosing rural landscapes (Wellman, 1974; Graham and Marvin,
28 broadly as three patterns: urban, suburban or rural; the U.S. had a majority rural
population until 1920. Briefly from 1920-50, the majority of Americans lived in
cities as compared to suburbia or rural areas, and from then on suburbia took over as
the dominant settlement trend (U.S. Census 1920, Nechyba and Walsh, 2004).
Despite only briefly having a majority of the population in cities, Peter Hall’s (1989)
classic summation of planning history couches professional planning in terms of a
series of “City” movements. Ironically, these movements which seek to glorify the
city, simultaneously point to the unhealthy urban environment of cities as causes for
both urban renewal and urban dispersion, the latter of which is represented by the
preference for suburban living since 1950.
The urban–rural dichotomy is deeply ingrained in current planning systems, though it
was not as evident at the birth of the profession. President Roosevelt’s 1909
Commission on Country Life, an early federal attempt at policy recommendations for
urbanization, suggested an urban land-use pattern that would benefit expanding urban
and rural areas alike by preserving natural scenery in strips alongside urbanizing
areas. The Commission asserted that, “this in no way interferes with the agricultural
utilization of the land, but rather increases it. The scenery is, in fact, capitalized, so
that it adds to the property values and contributes to local patriotism and to the thrift
of the commonwealth” (United States Commission on Country Life, 1909, p. 53). In
the absence of such a national policy of compact urban development in close
proximity to working farmland, urban development proceeded haphazardly, devaluing
both the urban core and the rural farm areas. Already at the Third National Planning
Conference (1912), Mr. J Randolph Coolidge Jr. noted the “problem of the blighted
29 without continual upkeep while people relocate at the fringe where new development
is serviced by modern infrastructure (p. 100-12). Coolidge heralded the coming of the
suburb in relation to the decline of the city and consumption of scenic, rural lands.
Turn of the century planners identified the desirability and profitability of fringe
development, along with a suitable landscape treatment that would benefit cities and
farmland. Planning took another route, allowing and sometimes advocating for low
density ex-urban growth.
Data-driven models on the location of urban growth have shown that ex-urban areas,
those located well outside established urban and suburban boundaries, have witnessed
the largest population growth since 1960 (Lamb, 1983; Nelson, 1992; Fulton et al.,
2001; Heimlich and Anderson, 2001; Theobald, 2001; Davis et al 2004; Berube et al.,
2006; Brown et al., 2005, p 1855-71). Ex-urban communities are heterogeneous
landscapes made up of farms, suburban-style subdivisions, large-lot residential
developments, commercial centers, and undeveloped open spaces (Nelson, 1992;
Daniels, 1999; Green et al, 2005). Absolute numbers also show a preference for
growth in fringe counties while urban areas decline. As a result of the lack of
cohesive planning theory for the process of urbanization, a new model of urban
expansion is needed to explain the current phenomenon of decentralization,
30 Farmland loss is not simply a matter of market preference and depressed agricultural
values, but is also subject to the vagaries of public policy. Local government
investment in pro-growth development via sewer and water extension line subsidies
contributes to sprawl (Daniels, 1998). If counties are pro-growth, more urban
expansion can be expected. Loudon County, Virginia and Montgomery County,
Maryland across the Potomac River offer a prime example of similar land topologies,
development pressures, and different local government emphases on growth with
resulting differences in farmland loss and urban development. Researchers have
shown that agricultural use-value taxation of land has worked to keep down the
holding costs for farmers and land speculators until land values rise and the owners
are willing to sell the land for a non-farm use (Daniels and Bowers, 1997). The
property tax savings to the farmer are in effect capitalized into the value of the
farmland for eventual sale for non-farm use. These market manipulations further
distort of the bid-rent curve.
The extreme dispersion of urban land-use patterns, as they have become unhinged
from public transportation systems and bounding parameters of high value crops has
eluded planning theorists. To be fair, the lowest densities of urban development were
never the concentration of urban theorists. Perhaps this is why metropolitan theorists
fail when they try to model the drivers and limits of ex-urban growth where
commuting can be extreme, and residential location decisions are driven by ‘‘unpriced
spatial influences’’ (Anas et al. 1998, p. 1451) including environmental amenity and
lifestyle—not house prices, workplace accessibility and rational economic choice. As
31 model of urban expansion is needed to explain the current phenomenon of
decentralization, disinvestment in center cities, and amenity valuation of open lands.
Rural Development Theory
Rural development theory- particularly as it pertains to fringe development and
growth management- is a relatively new field covering the outgrowth of urban areas
into farmlands (Van der Ploeg et al, 2000). Prior to the recent phenomenon of urban
sprawl, rural development theory was most concerned with migration of rural people
to the city, as well as community and economic development to improve the standard
of living in small towns that were predominantly engaged in foodstuff production. In
the United States, rural policy has been dominated by farm policy.
Johann Heinrich Von Thünen, the founding father of urban theory, is also the
founding father of rural development (Sinclair, 1967). The Von Thünen model
predicts the form of peri-urban agriculture with the following results:
1. Dairying, with its highly perishable product- milk, lies closest to the urban
center, since dairy products must get to market quickly.
2. Timber and firewood, produced for fuel and building materials, are planted in
the second ring as they are heavy and expensive to transport into the city.
3. Transportation costs of crops are less high, therefore the third zone consists of
extensive fields crops such as grain. Grains last longer than dairy products and
are much lighter than fuel, reducing total transport costs; they can be located
32 4. Ranching is located in the outermost productive ring because animals can be
driven into the city for butchering.
5. The final ring consists of wilderness with no marketable activities. This land
has a null value in the bid-rent model correlating to the lack of use one can
extract from the property due to the exorbitant cost of transporting the product.
Since Von Thünen created his models, there have been significant changes in
transportation, energy supply, and tax policy. As transportation becomes less
expensive, the Von Thünen model retains its layers, but becomes spread out over
more space, pushing the rings further from the city. One could argue that
transportation costs have become so inexpensive that any resemblance of rings of
production has decayed into a nebulous haze. Advancements in refrigeration,
pasteurization and preservation have also enabled food to come from further away,
removing the necessity for proximity to urban markets (Cronon, 1991). As energy
supply has changed from renewable, locally produced sources, such as timber, to oil
and power generation plants, the need to have timber near cities also became obsolete.
The mortgage interest deduction and property tax deduction distort the bid rent curve
in favor of those looking to move to the fringe. While farmers do see a premium
payment from direct sales and benefit from large markets (Gale, 1997), the theoretical
Von Thünen city has become unbounded, divorced from surrounding, competing
agricultural land interests and subject only to the real estate market in housing,
commercial property, office space, and industry. The limiting factor to urban
33 crops. If the crops fetch lower prices than residential housing markets, agricultural
land-uses will be replaced with urban land-uses.
Following Von Thünen’s early work, Hart (1998) sought to explain the dynamics of
urbanization on rural development. Hart used the imagery of urbanization creating
“bow waves” that spread into agricultural buffer zones on the rural-urban fringe
(1976, 1991). He defined peri-urban agriculture as “the zone of intensively
cultivated, high-priced agricultural land that always remains in front of the expanding
urban edge. The high price and the intensive cultivation of the agricultural land in the
bow wave stem entirely from location, not from any inherent quality of the soil. The
agricultural activities of the bow wave simply move farther out when the land is
converted to urban use, as inevitably it will be” (Hart, 1998:328). This wave shapes
the land rents, quantity, commodity type, and organization of agricultural production
(Heaton, 1980; Audirac 1999). It also shifts production away from livestock and
grains to horticulture and intensive crops, such as fruits and vegetables.
According to many data-driven models, the Von Thünen/Hart model holds merit
(Barnard and Lucier 1998; Furuseth and Pierce 1982; Heimlich 1988; Heimlich and
Anderson 2001; Otte 1974; Vesterby and Krupa 1993, 2001; Thomas and Howell,
2003). Cities are bound by suburbs which eventually are bounded by high value
cropland and dairies. Metropolitan Statistical Areas (MSAs), defined by the Bureau
of the Census, contain 20 percent of U.S. land area and 83 percent of the U.S.
population (Bureau of the Census, GARMS, 2010). MSAs are the modern stand-in