*Corresponding author, E-mail: [email protected]
EFFECT OF DROUGHT ON GROWTH ATTRIBUTES OF TOMATO (LYCOPERSICON
ESCULENTUM MILL.) GENOTYPES
MUKESH L. CHAVAN*, B.S. JANAGOUDAR, P.R. DHARMATTI AND R.V. KOTI Department of Crop Physiology, University of Agricultural Sciences (UAS), Dharwad, Karnataka, India
Received on 24 Oct., 2008, Revised on 22 Feb., 2010
SUMMARY
Studies were undertaken to find the detrimental effect of drought on growth attributes of tomato (Lycopersicon esculentum Mill.) plants were evaluated in the field experiment at KRC College of Horticulture, Arabhavi, Karnataka. Experiment was laid out with two levels of irrigation and 50 tomato genotypes by adopting factorial RBD with two replications. Drought was imposed two weeks after transplanting in both the IW/CPE ratio (ratio of irrigation water to cumulative pan evaporation) of 0.40 and 1.20 treatments. Irrigation was given when the pan evaporation reading reached 41.66 mm (1.20 IW/CPE ratio) and 125 mm (0.40 IW/CPE ratio). As the stress increased from 1.2 to 0.4 IW/CPE ratio, there was reduction in LAI, NAR and RGR was noticed at all the growth stage whereas, per cent light transmission was increased. At 45 DAT, irrespective of the irrigation levels, genotype L-3 had significantly maximum LAI, 75 DAT and at harvest, significantly maximum LAI was found in the genotype L- 33. During 45-75 DAT, genotype Arka Meghali had significantly higher NAR and RGR, and genotype GK-3 recorded significantly maximum NAR and RGR at 45 DAT- harvest whereas, during 75 DAT to harvest, the genotype L-13 recorded significantly maximum NAR and L-30 recorded significantly higher RGR. Among the genotypes, L-37 recorded significantly maximum per cent light transmission
Key words: IW/CPE ratio, LAI, NAR, RGR, Tomato
higher level with higher NAR during reproduction phase have greater influence on yield (Haloi and Baldev 1986).
Tomato (Lycopersicon esculentum Mill.), which belongs to the family solanaceae, is one of the most popular and widely grown vegetables in the world. Tomato production in India has been on the increase during the last two decades. Although, the fruit yield per unit area and time is fairly good in India, there is still scope to increase the production to meet the increasing demand through adoption of improved agrotechiques, especially irrigation. Considering the potentiality of this crop, there is plenty of scope for its improvement, especially under the drought situation. INTRODUCTION
Indian J. Plant Physiol., Vol. 15, No. 1, (N.S.) pp. 11-18 (Jan.-Mar., 2010) Crop scientists are still concerned about it as it remains
the single most important factor affecting the yield potentials of crop species. Water is a scarce resource for irrigation. Although the concept of drought resistance is viewed differently by molecular biologist, biochemist, physiologists and agronomists, the major concern is, to enhance the biomass returns under limited input of water which is a characteristic feature of rainfed agriculture. Therefore, some of the adoptive mechanisms of plants to moisture stress, which do not decrease plant yield to a greater extent, assume greater importance.
There are several physiological and biochemical traits contributing to the drought tolerance nature of horticultural crops. However, large number of tomato genotypes have not been screened for drought tolerance or exploited for their cultivation under drought situation. Hence, the present investigation was carried out to screen the tomato genotypes for growth attributes, yield potential and drought tolerant related traits. Hence, an attempt was made to study the effect of drought on the growth attributes in tomato.
MATERIALS AND METHODS
Studies were undertaken to find effect of irrigation on growth attributes in tomato (Lycopersicon esculentum Mill.) in the field experiment at KRC College of Horticulture, Arabhavi, Karnataka during 2003-04. Arabhavi is situated in Northern dry zone of Karnataka state (zone-3), lying 16°15’ north latitude, 75°45’ east longitude and at an altitude of 612.03 meters above mean sea level. The experiment was conducted on medium deep black soil with 50 tomato genotypes viz., Alco Basa, Arka Abhay, Arka Alok, Arka Ashish, Arka Meghali, GK-1, GK-2, GK-3, IIHR 2274, Megha (L-15), Nandi, PKM-1, PR-1, Punjab Chhauhara, S-22, Sankranthi, Vaibhav, L-1, L-2, L-3, L-5, L-6, L-10, L-10 (P), L-11, L-12, L-13, L-15, L-16, L-17, L-18, L-19, L-26, L-27, L-28, L-29, L-30, L-31, L-32, L-33, L-33-1, L-34, L-34-1, L-35, L-37, L-38, L-38-L-34-1, L-40-3, L-43, L-44 and water stress was imposed on 15th day onwards after transplanting. Irrigation was scheduled based on the evaporimeter reading. Open pan evaporation was recorded in mm/day. Cumulative pan evaporation (CPE) was calculated and quantity of water to be irrigated
through furrow was measured with the help of V-notch installed at the plot head. Accordingly, the measured quantity of water was applied to the plots as per the irrigation schedules. It was applied based on IW/CPE ratio, where in depth of irrigation (IW) was maintained constantly at 50 mm. Soon after reaching the particular ratio based on the cumulative pan evaporation, irrigation was scheduled to particular treatment. In the 0.4 IW/ CPE ratio, crop was irrigated for every 125 mm of CPE where as in 1.20 ratio irrigation was given for every 41.66 mm of CPE. The experiment was laid out in factorial randomised block design with two replications. Crop was supplied with fertilizers and other cultivation operations including plant protection measures were carried out as per recommended package of practices of University of Agricultural Sciences, Dharwad (Annon 2002).
Various growth parameters viz., relative growth rate (RGR), net assimilation rate (NAR) and leaf area index were calculated by following the standard methods as described by Blackman (1919), Gregory (1926) and Power et al. (1967) and per cent light transmission (PLT) was calculated as per Yoshida et al. (1972). Leaf area was taken at 45, 75 DAT at harvest and the data obtained was used to calculate LAI whereas, NAR and RGR was recorded at interval of 45-75 DAT, 45 DAT – harvest and 75 DAT- harvest, whereas per cent light transmission was recorded at 45 DAT. Fisher’s method of analysis of variance was applied for the analysis and interpretation of the experimental data as given by Panse and Sukhatme (1967).
RESULTS AND DISCUSSION
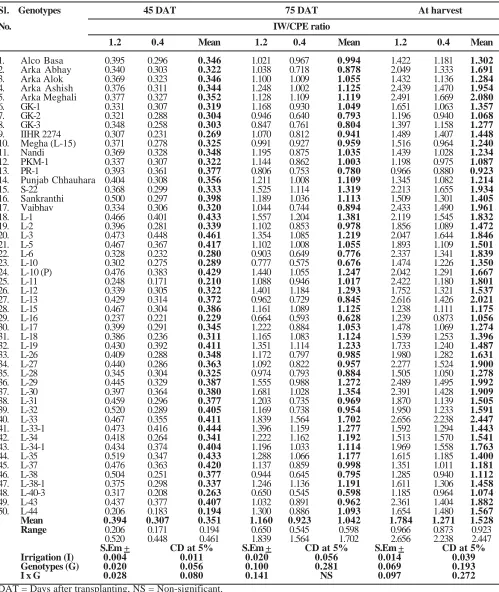
Leaf area index (LAI) is the most important variable and it can be widely changed by agronomical manipulation. LAI indicated significant difference among the irrigation levels and genotypes at all the growth stages (Table 1). Interaction between the genotypes and irrigation levels had significant difference only at 45 DAT and at harvest.
Table 1. Influence of irrigation levels on leaf area index (LAI) of tomato genotypes at various growth stages
Sl. Genotypes 45 DAT 75 DAT At harvest
No. IW/CPE ratio
1.2 0.4 Mean 1.2 0.4 Mean 1.2 0.4 Mean
1. Alco Basa 0.395 0.296 0.346 1.021 0.967 0.994 1.422 1.181 1.302
2. Arka Abhay 0.340 0.303 0.322 1.038 0.718 0.878 2.049 1.333 1.691
3. Arka Alok 0.369 0.323 0.346 1.100 1.009 1.055 1.432 1.136 1.284
4. Arka Ashish 0.376 0.311 0.344 1.248 1.002 1.125 2.439 1.470 1.954
5. Arka Meghali 0.377 0.327 0.352 1.128 1.109 1.119 2.491 1.669 2.080
6. GK-1 0.331 0.307 0.319 1.168 0.930 1.049 1.651 1.063 1.357
7. GK-2 0.321 0.288 0.304 0.946 0.640 0.793 1.196 0.940 1.068
8. GK-3 0.348 0.258 0.303 0.847 0.761 0.804 1.397 1.158 1.277
9. IIHR 2274 0.307 0.231 0.269 1.070 0.812 0.941 1.489 1.407 1.448
10. Megha (L-15) 0.371 0.278 0.325 0.991 0.927 0.959 1.516 0.964 1.240
11. Nandi 0.369 0.328 0.348 1.195 0.875 1.035 1.439 1.028 1.234
12. PKM-1 0.337 0.307 0.322 1.144 0.862 1.003 1.198 0.975 1.087
13. PR-1 0.393 0.361 0.377 0.806 0.753 0.780 0.966 0.880 0.923
14. Punjab Chhauhara 0.404 0.308 0.356 1.211 1.008 1.109 1.345 1.082 1.214
15. S-22 0.368 0.299 0.333 1.525 1.114 1.319 2.213 1.655 1.934
16. Sankranthi 0.500 0.297 0.398 1.189 1.036 1.113 1.509 1.301 1.405
17. Vaibhav 0.334 0.306 0.320 1.044 0.744 0.894 2.433 1.490 1.961
18. L-1 0.466 0.401 0.433 1.557 1.204 1.381 2.119 1.545 1.832
19. L-2 0.396 0.281 0.339 1.102 0.853 0.978 1.856 1.089 1.472
20. L-3 0.473 0.448 0.461 1.354 1.085 1.219 2.047 1.644 1.846
21. L-5 0.467 0.367 0.417 1.102 1.008 1.055 1.893 1.109 1.501
22. L-6 0.328 0.232 0.280 0.903 0.649 0.776 2.337 1.341 1.839
23. L-10 0.302 0.275 0.289 0.777 0.575 0.676 1.474 1.226 1.350
24. L-10 (P) 0.476 0.383 0.429 1.440 1.055 1.247 2.042 1.291 1.667
25. L-11 0.248 0.171 0.210 1.088 0.946 1.017 2.422 1.180 1.801
26. L-12 0.339 0.305 0.322 1.401 1.184 1.293 1.752 1.321 1.537
27. L-13 0.429 0.314 0.372 0.962 0.729 0.845 2.616 1.426 2.021
28. L-15 0.467 0.304 0.386 1.161 1.089 1.125 1.238 1.111 1.175
29. L-16 0.237 0.221 0.229 0.664 0.593 0.628 1.239 0.873 1.056
30. L-17 0.399 0.291 0.345 1.222 0.884 1.053 1.478 1.069 1.274
31. L-18 0.386 0.236 0.311 1.165 1.083 1.124 1.539 1.253 1.396
32. L-19 0.430 0.392 0.411 1.351 1.114 1.233 1.733 1.240 1.487
33. L-26 0.409 0.288 0.348 1.172 0.797 0.985 1.980 1.282 1.631
34. L-27 0.440 0.286 0.363 1.092 0.822 0.957 2.277 1.524 1.900
35. L-28 0.345 0.304 0.325 0.974 0.793 0.884 1.505 1.050 1.278
36. L-29 0.445 0.329 0.387 1.555 0.988 1.272 2.489 1.495 1.992
37. L-30 0.397 0.364 0.380 1.681 1.028 1.354 2.391 1.428 1.909
38. L-31 0.459 0.296 0.377 1.203 0.735 0.969 1.870 1.139 1.505
39. L-32 0.520 0.289 0.405 1.169 0.738 0.954 1.950 1.233 1.591
40. L-33 0.467 0.355 0.411 1.839 1.564 1.702 2.656 2.238 2.447
41. L-33-1 0.473 0.416 0.444 1.396 1.159 1.277 1.592 1.294 1.443
42. L-34 0.418 0.264 0.341 1.222 1.162 1.192 1.513 1.570 1.541
43. L-34-1 0.434 0.374 0.404 1.196 1.033 1.114 1.969 1.558 1.763
44. L-35 0.519 0.347 0.433 1.288 1.066 1.177 1.615 1.185 1.400
45. L-37 0.476 0.363 0.420 1.137 0.859 0.998 1.351 1.011 1.181
46. L-38 0.504 0.251 0.377 0.944 0.645 0.795 1.285 0.940 1.112
47. L-38-1 0.375 0.298 0.337 1.246 1.136 1.191 1.611 1.306 1.458
48. L-40-3 0.317 0.208 0.263 0.650 0.545 0.598 1.185 0.964 1.074
49. L-43 0.437 0.377 0.407 1.032 0.891 0.962 2.361 1.404 1.882
50. L-44 0.206 0.183 0.194 1.300 0.886 1.093 1.654 1.480 1.567 Mean 0.394 0.307 0.351 1.160 0.923 1.042 1.784 1.271 1.528 Range 0.206 0.171 0.194 0.650 0.545 0.598 0.966 0.873 0.923
0.520 0.448 0.461 1.839 1.564 1.702 2.656 2.238 2.447
S.Em + CD at 5% S.Em + CD at 5% S.Em + CD at 5% Irrigation (I) 0.004 0.011 0.020 0.056 0.014 0.039 Genotypes (G) 0.020 0.056 0.100 0.281 0.069 0.193 I x G 0.028 0.080 0.141 NS 0.097 0.272
Indian J. Plant Physiol., Vol. 15, No. 1, (N.S.) pp. 11-18 (Jan.-Mar., 2010) form 1.2 to 0.4 IW/CPE ratio, there was reduction in
LAI throughout the growth stages (22.08, 20.43 and 28.76 per cent at 45, 75 DAT and harvest, respectively).
At 45 DAT, performance of genotypes across the irrigation showed that, genotype L-3 had significantly maximum LAI and minimum was in the genotype L-44. With respect to the interaction between the different genotypes and stress levels, significantly maximum LAI was exhibited by the genotype L-32 at mild stress of 1.2 IW/CPE ratio and significantly lower LAI was recorded in the genotype L-11 at sever stress of 0.4 IW/CPE ratio. Whereas, during 75 DAT, irrespective of the irrigation levels, significantly maximum LAI was found in the genotype L- 33 while, the minimum LAI was recorded in the genotype L- 40-3 and the same genotypes recorded significantly maximum and minimum LAI for interactions between different genotypes and mild and sever drought of 1.2 and 0.4 IW/CPE ratios. While, genotype L-33 was exhibited significantly higher LAI across the irrigation levels and also for the interaction among the genotypes and both the stress levels at harvest. Whereas, PR-1 recorded minimum LAI cross the irrigation levels and also for the interaction at 1.2 IW/CPE ratio. Present investigation is in confirmity with earlier findings of Banerjee and Saha (1985) in potato, Haloi and Baldev (1986) in chickpea, Panda et al. (2004) in mustard and Narayanappa et al. (2004) in davana.
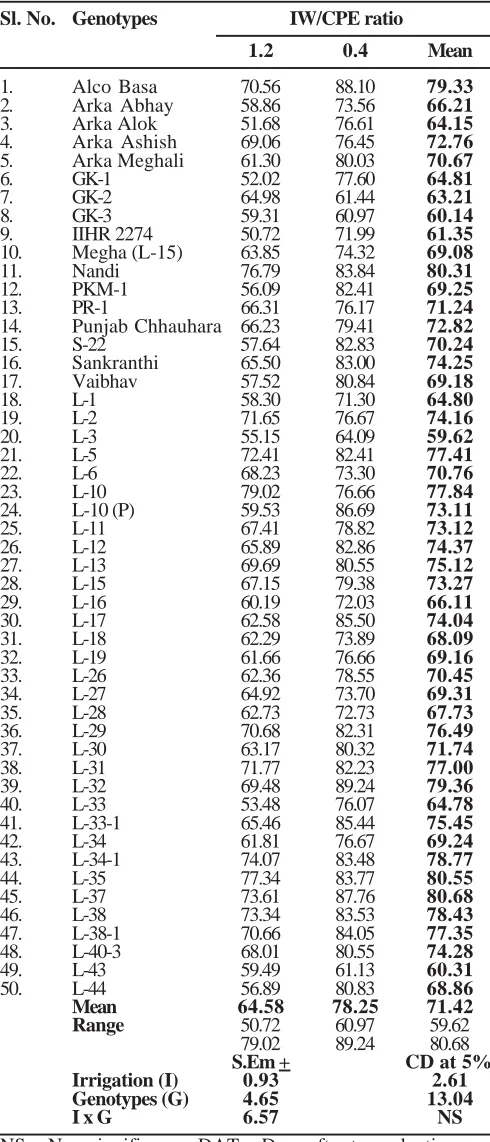
Under the stress conditions, canopy development was reduced which intern lead to increase in percent light transmission with in the canopy. Per cent light transmission was found significant among irrigation levels and genotypes but not for interaction (Table 2). Significantly higher per cent light transmission was observed at 0.4 IW/CPE ratio (78.25) compared to 1.2 IW/CPE ratio (64.58). As the stress level increase from 1.2 to 0.4 IW/CPE ratio there was significant increase in per cent light transmission to an extent of 21.2 per cent. Among the genotypes, L-37 recorded significantly maximum per cent light transmission (80.68). Per cent light transmission was increased significantly with increase in water deficit. Present investigation is in confirmity with Thakur et al. (2000) in Capsicum annum.
Table 2. Influence of irrigation levels on per cent light transmission in tomato genotypes at 45 DAT
Sl. No. Genotypes IW/CPE ratio
1.2 0.4 Mean
1. Alco Basa 70.56 88.10 79.33
2. Arka Abhay 58.86 73.56 66.21
3. Arka Alok 51.68 76.61 64.15
4. Arka Ashish 69.06 76.45 72.76
5. Arka Meghali 61.30 80.03 70.67
6. GK-1 52.02 77.60 64.81
7. GK-2 64.98 61.44 63.21
8. GK-3 59.31 60.97 60.14
9. IIHR 2274 50.72 71.99 61.35
10. Megha (L-15) 63.85 74.32 69.08
11. Nandi 76.79 83.84 80.31
12. PKM-1 56.09 82.41 69.25
13. PR-1 66.31 76.17 71.24
14. Punjab Chhauhara 66.23 79.41 72.82
15. S-22 57.64 82.83 70.24
16. Sankranthi 65.50 83.00 74.25
17. Vaibhav 57.52 80.84 69.18
18. L-1 58.30 71.30 64.80
19. L-2 71.65 76.67 74.16
20. L-3 55.15 64.09 59.62
21. L-5 72.41 82.41 77.41
22. L-6 68.23 73.30 70.76
23. L-10 79.02 76.66 77.84
24. L-10 (P) 59.53 86.69 73.11
25. L-11 67.41 78.82 73.12
26. L-12 65.89 82.86 74.37
27. L-13 69.69 80.55 75.12
28. L-15 67.15 79.38 73.27
29. L-16 60.19 72.03 66.11
30. L-17 62.58 85.50 74.04
31. L-18 62.29 73.89 68.09
32. L-19 61.66 76.66 69.16
33. L-26 62.36 78.55 70.45
34. L-27 64.92 73.70 69.31
35. L-28 62.73 72.73 67.73
36. L-29 70.68 82.31 76.49
37. L-30 63.17 80.32 71.74
38. L-31 71.77 82.23 77.00
39. L-32 69.48 89.24 79.36
40. L-33 53.48 76.07 64.78
41. L-33-1 65.46 85.44 75.45
42. L-34 61.81 76.67 69.24
43. L-34-1 74.07 83.48 78.77
44. L-35 77.34 83.77 80.55
45. L-37 73.61 87.76 80.68
46. L-38 73.34 83.53 78.43
47. L-38-1 70.66 84.05 77.35
48. L-40-3 68.01 80.55 74.28
49. L-43 59.49 61.13 60.31
50. L-44 56.89 80.83 68.86
Mean 64.58 78.25 71.42 Range 50.72 60.97 59.62
79.02 89.24 80.68
S.Em + CD at 5% Irrigation (I) 0.93 2.61 Genotypes (G) 4.65 13.04
I x G 6.57 NS
Table 3. Net assimilation rate (NAR) (g dm-2 day-1 x 10²) of tomato genotypes as influenced by irrigation levels at different growth stages
Sl. Genotypes 45-75 DAT 45 DAT-Harvest 75 DAT-Harvest
No. IW/CPE ratio
1.2 0.4 Mean 1.2 0.4 Mean 1.2 0.4 Mean
1. Alco Basa 0.70 0.19 0.45 0.37 0.15 0.26 0.36 0.20 0.28
2. Arka Abhay 1.16 0.91 1.03 0.46 0.30 0.38 0.43 0.12 0.28
3. Arka Alok 0.68 0.34 0.51 0.33 0.19 0.26 0.29 0.19 0.24
4. Arka Ashish 1.26 0.44 0.85 0.55 0.31 0.43 0.59 0.43 0.51
5. Arka Meghali 1.25 1.09 1.17 0.49 0.38 0.44 0.48 0.23 0.35
6. GK-1 0.88 0.20 0.54 0.34 0.15 0.24 0.24 0.19 0.21
7. GK-2 0.34 0.27 0.31 0.26 0.22 0.24 0.34 0.31 0.33
8. GK-3 1.05 0.86 0.95 0.60 0.46 0.53 0.68 0.51 0.60
9. IIHR 2274 0.85 0.82 0.83 0.50 0.42 0.46 0.61 0.52 0.56
10. Megha (L-15) 0.44 0.31 0.37 0.26 0.21 0.24 0.31 0.25 0.28
11. Nandi 0.51 0.46 0.49 0.36 0.28 0.32 0.46 0.29 0.38
12. PKM-1 0.63 0.33 0.48 0.40 0.26 0.33 0.46 0.33 0.40
13. PR-1 0.51 0.39 0.45 0.38 0.24 0.31 0.44 0.23 0.33
14. Punjab Chhauhara 0.53 0.45 0.49 0.33 0.25 0.29 0.37 0.25 0.31
15. S-22 0.97 0.87 0.92 0.37 0.33 0.35 0.30 0.26 0.28
16. Sankranthi 0.36 0.35 0.36 0.22 0.17 0.20 0.23 0.17 0.20
17. Vaibhav 0.95 0.63 0.79 0.51 0.41 0.46 0.69 0.56 0.62
18. L-1 0.63 0.50 0.56 0.30 0.26 0.28 0.28 0.26 0.27
19. L-2 0.67 0.61 0.64 0.32 0.28 0.30 0.31 0.23 0.27
20. L-3 0.53 0.17 0.35 0.21 0.10 0.16 0.14 0.11 0.13
21. L-5 0.45 0.19 0.32 0.34 0.20 0.27 0.47 0.31 0.39
22. L-6 0.50 0.41 0.45 0.28 0.25 0.26 0.39 0.34 0.37
23. L-10 0.65 0.44 0.54 0.45 0.30 0.38 0.63 0.42 0.52
24. L-10 (P) 0.39 0.23 0.31 0.31 0.17 0.24 0.45 0.22 0.34
25. L-11 0.92 0.79 0.85 0.45 0.26 0.36 0.62 0.17 0.39
26. L-12 0.77 0.56 0.67 0.31 0.23 0.27 0.24 0.15 0.20
27. L-13 0.68 0.56 0.62 0.57 0.40 0.49 0.94 0.56 0.75
28. L-15 0.66 0.46 0.56 0.38 0.23 0.31 0.33 0.21 0.27
29. L-16 0.76 0.66 0.71 0.37 0.33 0.35 0.40 0.30 0.35
30. L-17 0.45 0.36 0.40 0.29 0.23 0.26 0.34 0.27 0.30
31. L-18 0.79 0.57 0.68 0.36 0.23 0.30 0.30 0.19 0.24
32. L-19 0.32 0.21 0.26 0.30 0.16 0.23 0.45 0.21 0.33
33. L-26 0.68 0.53 0.60 0.37 0.29 0.33 0.42 0.32 0.37
34. L-27 0.58 0.52 0.55 0.37 0.35 0.36 0.50 0.48 0.49
35. L-28 0.64 0.23 0.44 0.33 0.17 0.25 0.34 0.22 0.28
36. L-29 0.57 0.48 0.52 0.41 0.33 0.37 0.59 0.45 0.52
37. L-30 0.62 0.24 0.43 0.47 0.36 0.42 0.71 0.65 0.68
38. L-31 0.79 0.36 0.58 0.40 0.24 0.32 0.41 0.30 0.36
39. L-32 0.81 0.25 0.53 0.42 0.21 0.32 0.43 0.32 0.38
40. L-33 0.69 0.64 0.67 0.39 0.30 0.34 0.48 0.33 0.40
41. L-33-1 0.56 0.32 0.44 0.35 0.21 0.28 0.39 0.24 0.32
42. L-34 0.60 0.37 0.49 0.33 0.17 0.25 0.33 0.18 0.26
43. L-34-1 0.62 0.46 0.54 0.25 0.18 0.22 0.20 0.13 0.16
44. L-35 0.46 0.36 0.41 0.29 0.21 0.25 0.30 0.22 0.26
45. L-37 0.58 0.25 0.41 0.42 0.21 0.32 0.49 0.28 0.39
46. L-38 0.51 0.40 0.45 0.30 0.20 0.25 0.29 0.18 0.24
47. L-38-1 0.59 0.50 0.55 0.28 0.24 0.26 0.26 0.22 0.24
48. L-40-3 0.62 0.49 0.55 0.48 0.30 0.39 0.67 0.39 0.53
49. L-43 0.59 0.43 0.51 0.38 0.27 0.32 0.53 0.32 0.43
50. L-44 1.27 0.57 0.92 0.49 0.28 0.39 0.46 0.37 0.41
Mean 0.68 0.46 0.57 0.37 0.26 0.32 0.43 0.29 0.36 Range 0.32 0.17 0.26 0.21 0.10 0.16 0.14 0.11 0.13 1.27 1.09 1.17 0.60 0.46 0.53 0.94 0.65 0.75
S.Em + CD at 5% S.Em + CD at 5% S.Em + CD at 5% Irrigation (I) 0.02 0.05 0.01 0.02 0.02 0.05 Genotypes (G) 0.08 0.24 0.04 0.12 0.09 0.25
I x G 0.12 NS 0.06 NS 0.13 NS
Indian J. Plant Physiol., Vol. 15, No. 1, (N.S.) pp. 11-18 (Jan.-Mar., 2010)
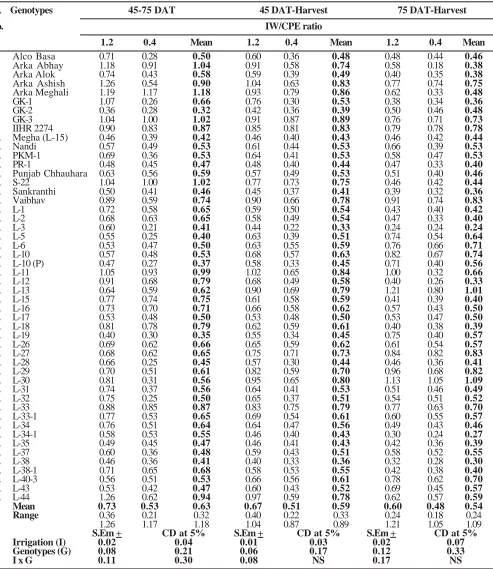
Table 4. Influence of irrigation levels on relative growth rate (RGR) (g g-1 day-1 x 10²) in tomato genotypes at various growth stages
Sl. Genotypes 45-75 DAT 45 DAT-Harvest 75 DAT-Harvest
No. IW/CPE ratio
1.2 0.4 Mean 1.2 0.4 Mean 1.2 0.4 Mean
1. Alco Basa 0.71 0.28 0.50 0.60 0.36 0.48 0.48 0.44 0.46
2. Arka Abhay 1.18 0.91 1.04 0.91 0.58 0.74 0.58 0.18 0.38
3. Arka Alok 0.74 0.43 0.58 0.59 0.39 0.49 0.40 0.35 0.38
4. Arka Ashish 1.26 0.54 0.90 1.04 0.63 0.83 0.77 0.74 0.75
5. Arka Meghali 1.19 1.17 1.18 0.93 0.79 0.86 0.62 0.33 0.48
6. GK-1 1.07 0.26 0.66 0.76 0.30 0.53 0.38 0.34 0.36
7. GK-2 0.36 0.28 0.32 0.42 0.36 0.39 0.50 0.46 0.48
8. GK-3 1.04 1.00 1.02 0.91 0.87 0.89 0.76 0.71 0.73
9. IIHR 2274 0.90 0.83 0.87 0.85 0.81 0.83 0.79 0.78 0.78
10. Megha (L-15) 0.46 0.39 0.42 0.46 0.40 0.43 0.46 0.42 0.44
11. Nandi 0.57 0.49 0.53 0.61 0.44 0.53 0.66 0.39 0.53
12. PKM-1 0.69 0.36 0.53 0.64 0.41 0.53 0.58 0.47 0.53
13. PR-1 0.48 0.45 0.47 0.48 0.40 0.44 0.47 0.33 0.40
14. Punjab Chhauhara 0.63 0.56 0.59 0.57 0.49 0.53 0.51 0.40 0.46
15. S-22 1.04 1.00 1.02 0.77 0.73 0.75 0.46 0.42 0.44
16. Sankranthi 0.50 0.41 0.46 0.45 0.37 0.41 0.39 0.32 0.36
17. Vaibhav 0.89 0.59 0.74 0.90 0.66 0.78 0.91 0.74 0.83
18. L-1 0.72 0.58 0.65 0.59 0.50 0.54 0.43 0.40 0.42
19. L-2 0.68 0.63 0.65 0.58 0.49 0.54 0.47 0.33 0.40
20. L-3 0.60 0.21 0.41 0.44 0.22 0.33 0.24 0.24 0.24
21. L-5 0.55 0.25 0.40 0.63 0.39 0.51 0.74 0.54 0.64
22. L-6 0.53 0.47 0.50 0.63 0.55 0.59 0.76 0.66 0.71
23. L-10 0.57 0.48 0.53 0.68 0.57 0.63 0.82 0.67 0.74
24. L-10 (P) 0.47 0.27 0.37 0.58 0.33 0.45 0.71 0.40 0.56
25. L-11 1.05 0.93 0.99 1.02 0.65 0.84 1.00 0.32 0.66
26. L-12 0.91 0.68 0.79 0.68 0.49 0.58 0.40 0.26 0.33
27. L-13 0.64 0.59 0.62 0.90 0.69 0.79 1.21 0.80 1.01
28. L-15 0.77 0.74 0.75 0.61 0.58 0.59 0.41 0.39 0.40
29. L-16 0.73 0.70 0.71 0.66 0.58 0.62 0.57 0.43 0.50
30. L-17 0.53 0.48 0.50 0.53 0.48 0.50 0.53 0.47 0.50
31. L-18 0.81 0.78 0.79 0.62 0.59 0.61 0.40 0.38 0.39
32. L-19 0.40 0.30 0.35 0.55 0.34 0.45 0.75 0.40 0.57
33. L-26 0.69 0.62 0.66 0.65 0.59 0.62 0.61 0.54 0.57
34. L-27 0.68 0.62 0.65 0.75 0.71 0.73 0.84 0.82 0.83
35. L-28 0.66 0.25 0.45 0.57 0.30 0.44 0.46 0.36 0.41
36. L-29 0.70 0.51 0.61 0.82 0.59 0.70 0.96 0.68 0.82
37. L-30 0.81 0.31 0.56 0.95 0.65 0.80 1.13 1.05 1.09
38. L-31 0.74 0.37 0.56 0.64 0.41 0.53 0.51 0.46 0.49
39. L-32 0.75 0.25 0.50 0.65 0.37 0.51 0.54 0.51 0.52
40. L-33 0.88 0.85 0.87 0.83 0.75 0.79 0.77 0.63 0.70
41. L-33-1 0.77 0.53 0.65 0.69 0.54 0.61 0.60 0.55 0.57
42. L-34 0.76 0.51 0.64 0.64 0.47 0.56 0.49 0.43 0.46
43. L-34-1 0.58 0.53 0.55 0.46 0.40 0.43 0.30 0.24 0.27
44. L-35 0.49 0.45 0.47 0.46 0.41 0.43 0.42 0.36 0.39
45. L-37 0.60 0.36 0.48 0.59 0.43 0.51 0.58 0.52 0.55
46. L-38 0.46 0.36 0.41 0.40 0.33 0.36 0.32 0.28 0.30
47. L-38-1 0.71 0.65 0.68 0.58 0.53 0.55 0.42 0.38 0.40
48. L-40-3 0.56 0.51 0.53 0.66 0.56 0.61 0.78 0.62 0.70
49. L-43 0.53 0.42 0.47 0.60 0.43 0.52 0.69 0.45 0.57
50. L-44 1.26 0.62 0.94 0.97 0.59 0.78 0.62 0.57 0.59
Mean 0.73 0.53 0.63 0.67 0.51 0.59 0.60 0.48 0.54 Range 0.36 0.21 0.32 0.40 0.22 0.33 0.24 0.18 0.24 1.26 1.17 1.18 1.04 0.87 0.89 1.21 1.05 1.09
S.Em + CD at 5% S.Em + CD at 5% S.Em + CD at 5% Irrigation (I) 0.02 0.04 0.01 0.03 0.02 0.07 Genotypes (G) 0.08 0.21 0.06 0.17 0.12 0.33
I x G 0.11 0.30 0.08 NS 0.17 NS
Net assimilation rate was decreased in all the growth stages irrespective of the irrigation schedules. Significant difference among the genotypes and irrigation levels was noticed. Significantly maximum NAR was noticed at the irrigation schedule of 1.2 IW/CPE ratio at all the growth stages during both the years compared to 0.4 IW/CPE ratio (Table 3).
There was 32.4, 29.7 and 32.6 per cent decrease in the NAR was observed as the irrigation levels decreased under the sever stress of 0.4 IW/CPE ratio when compared to 1.2 during 45-75 DAT, 45 DAT- harvest and 75 DAT – harvest, respectively.
During 45-75 DAT, irrespective of the irrigation levels, genotype Arka Meghali had significantly higher NAR and genotype L-19 recorded significantly least NAR across the irrigation levels. Similarly at 45 DAT-harvest, irrespective of the irrigation levels, significantly maximum NAR was recorded in the genotype GK-3 whereas least was in L-3 and same genotypes showed maximum and minimum NAR for interactions at both the stress levels and among different genotypes. During 75 DAT to harvest, performance of genotypes across the irrigation levels and genotypes significantly maximum NAR was notice in the genotype L-13 and least NAR was exhibited genotype L-3. The results of present investigation confirm the earlier findings of Haloi and Baldev (1986) in chickpea and Singh and Singh (1994) in sugarcane and they found that, interception of maximum solar radiation by upper leaves showed higher rate of photosynthesis than the lower leaves. This may account for higher NAR under stress condition as observed in these genotypes and may be regarded as a characteristic feature of drought tolerant.
Significant difference was observed for RGR due to genotypes, irrigation levels at all the growth stages (Table 4). During 45-75 DAT, irrespective of the irrigation levels, genotype Arka Meghali had significantly higher RGR while, the least RGR was recorded in the genotype GK-2. The genotypes Arka Ashish and L-44 had significantly higher interaction at mild stress of 1.2 IW/CPE ratio and the least was noticed in the genotype L-3 at 0.4 IW/CPE ratio. Whereas, during 45 DAT-harvest, genotype GK-3 showed higher RGR. While, at
75 DAT-harvest, genotype L-30 has significantly higher RGR and lesser RGR was reported in the genotype L-3 both at 45 DAT- harvest and 75 DAT- harvest.
Significance for RGR was recorded due to stress levels at all the growth stages i.e. 45-75 DAT, 45 DAT– harvest and 75 DAT–harvest. As the stress level increased, there was reduction in RGR was noticed to an extent of 27.4, 23.9 and 20.0 per cent, respectively. Present investigation in accordance with Ninganur (2002) in cotton, Haloi and Baldev (1986) in chickpea and Singh and Singh (1994) in sugarcane.
It can be concluded that, those genotypes which has ability to maintain better NAR, RGR and LAI under the stress conditions can be used for breeding programme for development of high yielding genotypes under the stress conditions.
REFERENCES
Annonymous. (2002). Improved cultivation practices of horticulture crops (Kannada). University of Agricultural Sciences, Dharwad, pp. 177-183.
Banerjee, N.C. and Saha, B.K. (1985). Effect of different levels of irrigation and potassium on growth and yield of potato. South Indian Horti. 33: 153-157.
Blackman, V.H. (1919). The compound interest law and plant growth. Annals Bot. 33: 353-360.
Gregory, F.G. (1926). The effect of climatic conditions on growth of barley. Annals Bot. 40: 1-26.
Haloi, B. and Baldev, B. (1986). Effect of irrigation on growth attributes in chickpea when grown under different dates of sowing and population pressure. Indian J. Plant Physiol. 24: 14-27.
Narayanappa, M., Thimmegowda, S., Reddy, S.S. and Kumar, O. (2004). Influence of irrigation intervals and planting geometry on growth and yield components of davana.
Karnataka J. Agri. Sci. 17: 224-228.
Indian J. Plant Physiol., Vol. 15, No. 1, (N.S.) pp. 11-18 (Jan.-Mar., 2010)
Panda, B.B., Shivay, Y.S. and Bandyopadhyay, S.K. (2004). Growth and development of Indian mustard (Brassica juncea) under different levels of irrigation and date of sowing. Indian J. Plant Physiol. 9: 419-425.
Panse, V.G. and Sukhatme, P.V. (1967). Statistical Methods for Agricultural Workers, Indian Council of Agricultural Research Publication, New Delhi, pp.152-174.
Power, J.G., Wills, W.O., Gunes, D.L. and Peichman, G.A. (1967). Effect of soil temperature, phosphorous and plant age on growth analysis of barley. Agronomy J. 59: 231-234.
Singh, N.B. and Singh, R.G. (1994). Varietal difference in net assimilation rate and relative growth rate of sugarcane under moisture stress. Indian J. Plant Physiol. 37: 183-184.
Thakur P.S., Thakur, A. and Kanaujia, S.P. (2000). Reversal of water stress. I. Mulching impact on the performance of Capsicum annum under water deficit. Indian J. Hort.
57: 250-254.