MODELING AND PREDICTION OF
RAINFALL DATA USING
DATA MINING
SEEMA MAHAJAN
Assistant Professor L. J. Institute of Engineering & Technology, Ahmedabad, Gujarat, India.
Dr. S. K. VIJ
Director (CE-IT-MCA) SVIT- Vasad-Gujarat, India
Abstract
Rainfall Prediction is an important crucial application of data mining techniques. The long term rainfall prediction is very useful in planning and decision making of agricultural crop pattern and water management strategy. In this study effort has been made to examine the relationship of Gujarat (India) rainfall with important global parameters such as Sea Surface Temperature (SST), Sea Level Pressure (SLP), wind, V-wind, U-windstress and V-U-windstress. Attention has been made to find out correlation of rainfall with these elements. This analysis shows that, Sea Surface Temperature of North Pacific Ocean, Sea Level Pressure of Atlantic Ocean, U-windstress and V-windstress of Atlantic Ocean affect Gujarat rainfall. Further a Stepwise method to perform multilinear regression on these predictors is used to develop a proposed model. One month lagged (June-July) correlation is considered throughout the study as the lagged relationship is more useful for predictive purposes than the simultaneous correlation. The forty years data (1960 – 1999) available from NOAA (National Oceanic and Atmospheric Administration) is used for modeling. Validation of generated monthly rainfall series was done by comparison of generated and measured series. The correlation coefficient between generated and measured rainfall series was found to be 0.8377.
Keywords: Correlation Analysis, Multiple regression, cluster, Rainfall forecasting
1. Introduction
Prediction of rainfall has remained an unsolved problem till date. The variation in the rainfall is primarily attributed to its association with Sea Surface Temperature, Sea Level Pressure, and Wind Speed etc. Several works have been done in this field over past few decades.
wind component is the North-South component of the wind. The U-wind stress and V-wind stress is the stress exerted by the wind on the surface of large bodies of water. It is the force component parallel to the surface, per unit area, as applied by the wind on the surface of large bodies of water. These components are primary mode of energy transfer in Earth's atmosphere. The strength and direction of the winds, generally determined by the rotation of the Earth and the input of energy from the Sun, is the major driving force of surface ocean currents.
Correlation between Gujarat rainfall and rainfall affecting parameters
Kusuma G. Rao & B. N. Goswami [6] and C. K. Gopinathan & J. S. Satry [12] analyze that ocean parameters affects the Indian region rainfall. To identify regions of the world that correlate with Gujarat monthly rainfall, we chose monthly values of all above parameters are 1-month lagged correlated with rainfall amount of Gujarat. Gujarat monsoon starts considerably in July hence mean values of each parameter are one month lagged (i.e. Month of June) and correlated with July month’s mean rainfall. The model is developed using Matlab.
Correlation of Gujarat rainfall and SLP
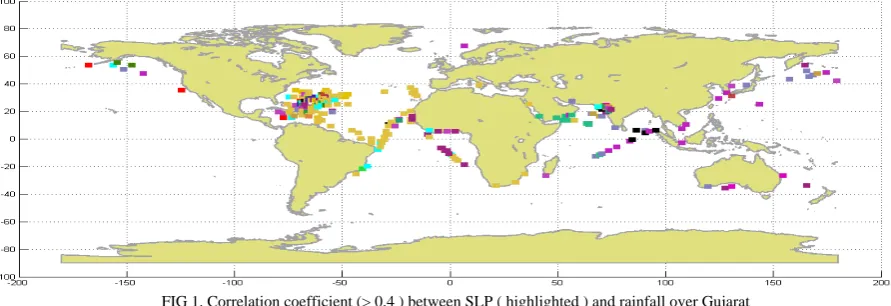
We correlated the SLP of over entire ocean region with Gujarat rainfall. The places are highlighted where the correlation coefficient is greater than 0.4. It is clear from FIG.1 that the Sea Level Pressure of some part of Atlantic Ocean is correlated with Gujarat rain. This is considered as a cluster named SLP. The monthly mean value of this cluster is considered further in multiple regression.
FIG 1. Correlation coefficient (> 0.4 ) between SLP ( highlighted ) and rainfall over Gujarat
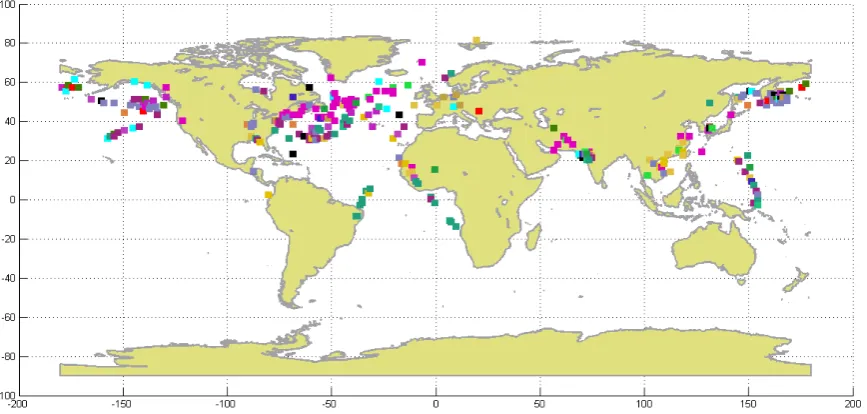
Correlation of Gujarat rainfall and SST
FIG.2. Correlation coefficient (> 0.4 ) between SST ( highlighted ) and rainfall over Gujarat
Correlation of Gujarat rainfall and Uwind
After applying the above strategy with U-wind parameter we got almost same results as in case of SST.
The cluster on North Pacific Ocean is named as wind1 and the correlated area on Atlantic ocean is named as U-wind2. FIG. 3 shows the correlation of Uwind with Gujarat rainfall.
FIG 3. Correlation coefficient (> 0.4 ) between U-wind( highlighted) and rainfall over Gujarat
Correlation of Gujarat rainfall and U-wind stress
FIG. 4 shows that more area of U-wind stress parameter than U-wind parameter are correlated with rainfall. The clusters shown in figure are named as U-windstress1 and U-windstress2.
FIG 4 Correlation coefficient(>0.4) between U-windstress(highlighted) & rainfall over Gujarat
Correlation of Gujarat rainfall and V-wind
The result of above correlation is shown FIG. 5, the clusters are named similarly as in case of above parameter. They are V-wind1 and V-wind2. The correlated places of cluster V-wind 2 are little bit scattered. But still V-wind2 is taken into consideration to see the impact of this place’s V-wind parameter with Gujarat rainfall.
FIG 5. Correlation coefficient(>0.4) between V-wind (highlighted) and rainfall over Gujarat
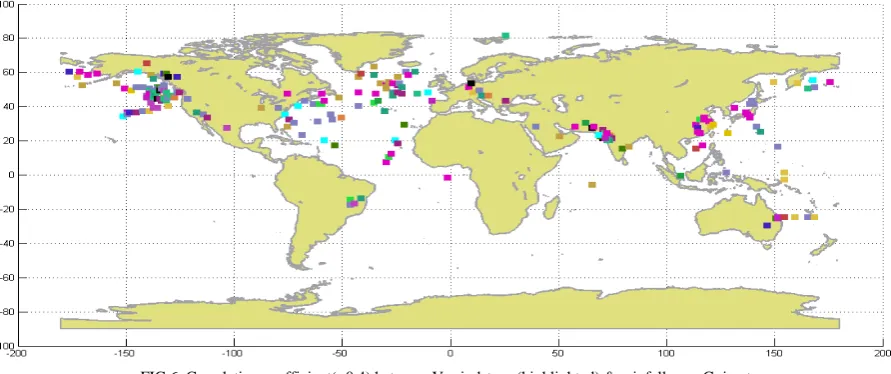
Correlation of Gujarat rainfall and V-wind stress
FIG 6. Correlation coefficient(>0.4) between V-windstress(highlighted) & rainfall over Gujarat
The rainfall is a complex phenomenon and is a function of various atmospheric parameters. These parameters collectively should be considered in the model to increase predictability of rainfall with all these parameters. Hence the analysis is further extended to develop a more precise model as mentioned below.
Above effort shows that all these parameters are affects rainfall. Above mentioned 6 parameters are divided into clusters as listed in table 1.
Table 1 List of parameters (regressors), their corresponding clusters and location.
Parameters Cluster Name Location
SLP SLP Highlighted area ( r2> 0.4) on Atlantic ocean SST SST1 Highlighted area ( r2> 0.4) on North pacific ocean SST SST2 Highlighted area ( r2> 0.4) on Atlantic ocean U-wind U-wind1 Highlighted area ( r2> 0.4) on North pacific ocean U-wind U-wind2 Highlighted area ( r2> 0.4) on Atlantic ocean U-wind stress U-windstress1 Highlighted area ( r2> 0.4) on North pacific ocean U-wind stress U-windstress2 Highlighted area ( r2> 0.4) on Atlantic ocean V-wind V-wind1 Highlighted area ( r2> 0.4) on North pacific ocean V-wind V-wind2 Highlighted area ( r2> 0.4) on Atlantic ocean V-wind stress V-windstress1 Highlighted area ( r2> 0.4) on North pacific ocean V-wind stress V-windstress2 Highlighted area ( r2> 0.4) on Atlantic ocean
During further study these 11 parameters are taken into account. The impact of all these clusters on Gujarat rainfall is analyzed with stepwise regression method. The stepwise regression models the response variable i.e. rainfall as a function of the predictor variables such as SST, SLP, U-wind, U-wind stress, V-wind and V-wind stress. The stepwise regression is a systematic method for adding and removing parameters into the model based on the statistical significance in regression. Depending on the terms included in the initial model and the order in which terms are moved in and out, the method may build different models from same set of parameters. The method terminates when no single step improves the model.
The regression equation using stepwise regression for the mentioned model is –
Y (rainfall) = 51.06 * (SLP) + 47.02 * (SST-1) + 0.66 * (Uwindstress1) + 0.89 * (Uwindstress2)
0 100 200 300 400 500 600 700
0 1 2 3 4 5 6 7 8 9 10 11 12 13 14 15 16 17 18 19 20 21 22 23 24 25 26 27 28 29 30 31 32 33 34 35 36 37 38 39 40 41 42 43 44 45 R ai n fa ll ( m m )
years 1960 as 0
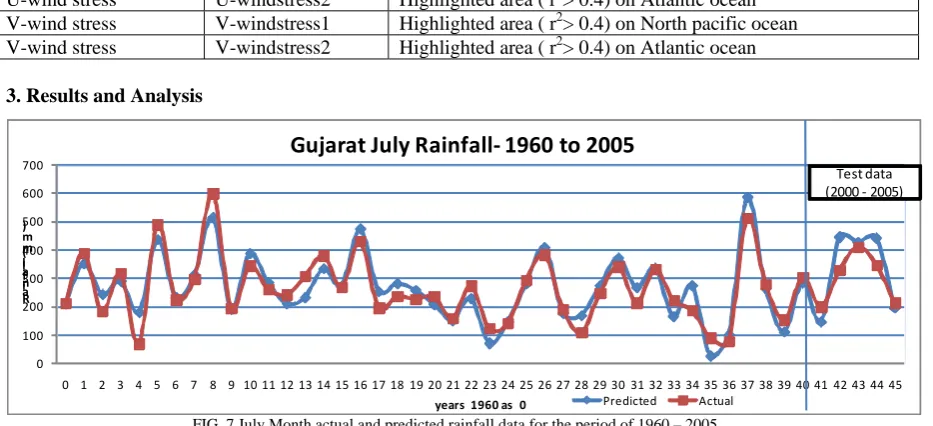
Gujarat July Rainfall- 1960 to 2005
Predicted Actual
Test data (2000 - 2005)
FIG. 7 July Month actual and predicted rainfall data for the period of 1960 – 2005.
FIG. 7 shows rainfall prediction results using the above mentioned model. This study explores the relationship of several parameters with Gujarat rainfall. The parameters specifically U-wind stress and V-wind stress of North Pacific and Atlantic Ocean, SLP of Atlantic Ocean and SST (North Pacific Ocean) significantly correlated with Gujarat Rainfall. The actual rainfall is very close to predicted rainfall and predicted values are highly satisfactory. This methodology can be extended for predicting rainfall of monsoon months of any another Indian region.
5. Conclusion
Above mentioned parameter model is able to simulate the July month rainfall prediction with reasonable accuracy. The same strategy can be applied for the rainfall prediction of August and September for Gujarat region. The model can extended to analyze the rainfall prediction of monsoon season of Gujarat and also for other regions of India.
4. References
[1] A.A.Munot and K. Krishna Kumar, “Long Range Prediction of Indian Summer Monsoon Rainfall” – Indian institute of Tropical
Meteorology, Pune 411008, India (Feb-2007)
[2] C. K. Gopinath & J.S. Sastry – “Relationship between Indian summer monsoon rainfall and position of Pacific Ocean warm pool- 16-July-1990.
[3] D.A.Mooley and B. Parthasarathy ““Indian Summer Monsoon and east equatorial Pacific SST” –Indian Institute of Tropical
Metereology- Pune India.-Nov-2010.
[4] J. Shukla and B.M.Misra, “Relationships between Sea Surface Temperature and Wind Speed Over the central Arabian Sea, and
Monsoon Rainfall over India”, Monthly Weather Review - Massachusells Institute of Technology, Cambridge-02139, 12 (May 1977).
[5] Rajashri Sen Jaiswal and S. Uma, Department of Physics., Sona College of Technology, Salem 636005, Tamilnadu, India “Total Rainfall in Relation to Meteorological Parameters over Trivandram” (7-11-July 2008).
[6] Kusuma G. Rao and B.N.Goswami, “Interannual Variation of Sea Surface Temperature over Arabian Sea and the Indian Monsoon: A New Perspective” – Monthly Weather Review- Indian Institute of Science, Bangalore, India (2 Sep 1987)
[7] Muhammad Muslehuddin*,Hazrat Mir, and Nadeem Faisal, “Sindh (June-September) Monsoon Rainfall Prediction”, -Pakistan Journal of Meteorology – Vo 2: Issue 4(Nov-2005)
[8] M.Kannan, S.Prabhakaran, P.Ramachandran, “Rainfall Forecasting Using Data Mining Technique”, International Journal of Engineering & Technology (Vol.2 (6), 2010).
[9] Monsoon and Environment Research Group of Peking University, “China monsoon Rainfall Prediction and Pacific Surface-Subsurface Sea Temperature Anomalies”-Science in China Press –(Feb-2009).
[10] S.Janakiraman, Mohit Ved,Ramesh Naidu Laveti, “Prediction of the Indian Summer Monsoon Rainfall Using a State –of-the-art coupled ocean-atmosphere model” – Indian Institute of Science Bangalore- Current Science, Vol.100 (February-2011).
[11] Zaw, W. T., Naing,T.T,University of Computer Studies, Yangon “Modeling of Rainfall Prediction over Myanmar Using Polynomial Regression”- (22-24 Jan-2009).