DEVELOPMENT AND VALIDATION OF A RP- HPLC METHOD FOR SIMULTANEOUS ESTIMATION OF OMEPRAZOLE AND CINITAPRIDE IN BULK AND CAPSULE DOSAGE FORM
5
0
0
Full text
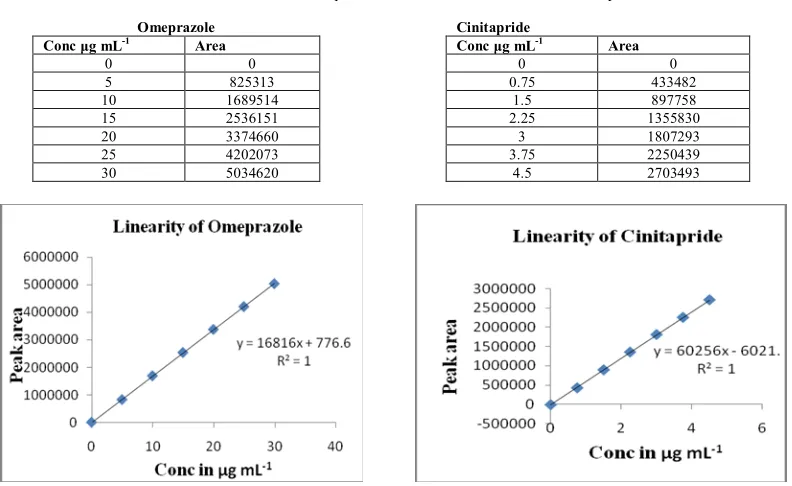
(2) G. Nagarajan et al. IRJP 2013, 4 (2). mol.wt: 402.4873 Figure 2. Structure of cinitapride.. MATERIALS AND METHODS Pure standard of Omeprazole and Cinitapride (Assigned purity 99.98%) was obtained as a gift sample from Shasun Chemicals Pvt Ltd Puducherry India. The gift samples were used as standard without further purification. HPLC grade water, methanol (Qualigens), potassium di hydrogen phosphate, di potassium hydrogen phosphate, phosphoric acid, sodiumperchloricacid and triethylamine (S.D. fine chemicals, Mumbai, India), were used throughout the experiment. Commercial pharmaceutical preparation (BURPEX), ZYDUS (CADILA)) which was claimed to contain 20 mg of Omeprazole and 3 mg of Cinitapride is used in analysis. The chemical structure and purity of the sample obtained was confirmed by TLC, IR, Melting point studies. HPLC grade Acetonitrile from Merck specialties Pvt Ltd, Mumbai. Water HPLC grade was obtained from Rankem laboratories. Instrumentation and Chromatographic Conditions High performance liquid chromatography, HPLC (WATERS 2695), UV-VIS detector was used. Isocratic elution of mobile phase comprising of Chromatographic analysis was performed on a Symmetry C8 column (150x 4.5 mm, 5μm) column ambient temperature with a mixture of mixed phosphate buffer and Acetonitrile in the ratio 50:50 (mixed phosphate buffer preparation: 1.625 gm of potassium di hydrogen phosphate and 0.3 gm of di potassium hydrogen phosphate in 550ml HPLC grade water, pH= 6.0 adjust with phosphoric acid) as mobile phase, at a flow rate of 1.0 mL min-1. UV detection was performed at 287 nm. The retention times of Omeprazole and Cinitapride were 2.49 and 3.650 min. The column temperature was maintained at ambient and the volume of injection was 20 μL. Prior to injection of analyte, the column was equilibrated for 30 min with mobile phase. Preparation of mobile phase The HPLC grade solvents were used for the preparation of mobile phase, isocratic elution of mobile phase comprising of with a mixture mixed phosphate buffer and Acetonitrile in the ratio 50:50 (mixed phosphate buffer preparation: 1.625 gm of potassium di hydrogen phosphate and 0.3 gm of di potassium hydrogen phosphate in 550ml HPLC grade water, pH= 6.0 adjust with phosphoric acid) as mobile phase and filtered before use through a 0.45 μm membrane filter, sonicated and pumped from the solvent reservoir to the column at a flow rate of 1 mL min1 Standard solution Standard stock solutions 1 mg mL-1 of Omeprazole and Cinitapride were prepared in mobile phase and further diluted in mobile phase. The working standard solutions were prepared in mobile phase to contain mixture of Omeprazole. and Cinitapride in over the linearity range from 5–30 μg mL-1 and 0.75-4.5 μg mL-1. Assay in formulation Twenty capsules each containing and their average weight was calculated. The capsules were crushed to furnish a homogeneous powder and a quantity equivalent to one capsule were weighed in to a 100 mL volumetric flask, dissolve in mobile phase, sonicated for about 15 min and then made up to volume with mobile phase. The solution was stirred for 10 min using a magnetic stirrer and filtered into a 100 mL volumetric flask through 0.45 μm membrane filter. The residue was washed 3 times with 10 mL of mobile phase, and then the volume was completed to 100 mL with the same solvent. Further add mobile phase to obtain an expected concentration of 20 μg mL-1 Omeprazole and 3 μg mL-1 Cinitapride. All determinations were conducted in triplicate. RESULTS AND DISCUSSIONS The proposed HPLC method required fewer reagents and materials and it is simple and less time consuming. This method could be used in quality control test in pharmaceutical industries. The chromatogram of Omeprazole and Cinitapride were shown in (Fig.3). There was clear resolution between Omeprazole and Cinitapride with retention time of 2.49 and 3.650 minutes, respectively.. Figure 3. Typical chromatogram of Omeprazole and Cinitapride. Linearity The response was determined to be linear over the range of 5 μg mL-1 to 30 μg mL-1 (5, 10, 15, 20, 25, 30) for Omeprazole and 0.75- 4.5 μg mL-1 (0.75, 1.5, 2.25, 3, 3.75, 4.5) for Cinitapride. The solutions were injected into HPLC system. Each of the concentration was injected to get reproduciable response. The run time was 15 min and the peak areas were measured (Table 1 & 2). The calibration curve was plotted as concentration of the respective drug versus the response at each level. The purposed method was evaluated by its correlation coefficient and intercept value calculated by statistical study. They were represented by the linear regression equation (Fig 4 and 5 calibration curve). Y Omeprazole = 16816x + 776.6, Coefficient of correlation (r2) value = 1 YCinitapride = 60256x – 6021 Coefficient of correlation (r2) value = 1. Page 132.
(3) G. Nagarajan et al. IRJP 2013, 4 (2) Table 1. For Peak Area of Omeprazole Conc μg mL-1 0 5 10 15 20 25 30. Table 2. For Peak area of Cinitapride. Omeprazole Area. Cinitapride Conc μg mL-1 0 0.75 1.5 2.25 3 3.75 4.5. 0 825313 1689514 2536151 3374660 4202073 5034620. Figure 4. Calibration curve for Omeprazole. Accuracy std. Avg Accuracy sample 50%spike. Avg Amt. recovered %Recovery 100%spike. Avg Amt. recovered %Recovery 150%spike. Avg Amt. recovered %Recovered. Area 0 433482 897758 1355830 1807293 2250439 2703493. Figue 5. Calibration curve for Cinitapride. Table 3. Result of recovery studies Omeprazole 3348808 3346729 3344522 3346686.333 3353076 5017734 5015945 5016512 5016730.333 49.71 99.42. Cinitapride 1793366 1792553 1791485 1792468 1795553 2690958 2691038 2691602 2691199.333 49.97 99.93. 6652635 6656763 6651418 6653605.333 98.62 98.62. 3580528 3583244 3579640 3581137.333 99.62 99.62. 8344114 8345064 8368344 8352507.333 149.38 99.59. 4488981 4490676 4503191 4494282.667 150.56 100.37. Accuracy The accuracy is the closeness of the measured value to the true value for the sample. Accuracy was found out by recovery study from prepared solution (three replicates) with standard solution, of the label claim. Aliquots of 50%, 100%, 150% weight of sample drug solution were pipetted into each of three volumetric flasks and prepare the serial dilution to get 23 µg mL-1. To prepare for two each standard drug solution were pipetted into each of six volumetric flasks. To this 10 mL of Omeprazole standard drug solution of 200 μg mL-1 was added to each of three volumetric flask respectively. To this 10 mL of Cinitapride standard drug solution of 30 μg mL-1 was added to each of three volumetric flask respectively. The volume was made up to 100 mL with mobile phase.20 µL of each solution was injected and. chromatograms were recorded. The range was found between 98.62 % to 100.37 % respectively. The values of recovery justify the accuracy of the method. The % recovery values were obtained within the standard limit which confirms that the method is accurate and free from any positive or negative interference of the excipients (Table 3). Limit of Detection and Quantification Limit of detection is determined by the analysis of samples with known concentrations of analyte and by establishing the minimum level at which the analyte can be reliably detected. The detection limit (LOD) and quantitation limit (LOQ) may be expressed as: L.O.D. = 3.3(SD/S) L.O.Q. = 10(SD/S). Page 133.
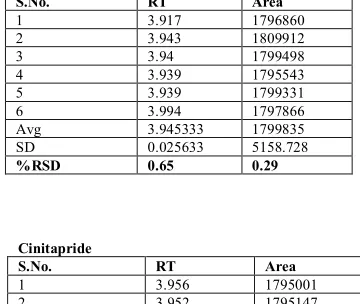
(4) G. Nagarajan et al. IRJP 2013, 4 (2) Where, SD = Standard deviation of the response, S = Slope of the calibration curve. The slope S may be estimated from the calibration curve of the analyte. The LOD was found to be 1.43570 µg mL-1 and 0.08600 μg mL-1 and LOQ was found to be 4.35080 μg mL-1 and 0.26070 μg mL-1 for Omeprazole and Cinitapride respectively which represents that sensitivity of the method is high. Precision Repeatability involves analysis of replicates by the analyst using the same equipment and method and conducting the. precision study over short period of time while reproducibility involves precision study at different occasions, different laboratories, and different batch of reagent, different analysts, and different equipments. The repeatability study which was conducted on the solution having the concentration of about 20 μg mL-1 for Omeprazole and 3 μg mL-1 for Cinitapride showed a RSD of 0.22 % for Omeprazole and 0.09 % for Cinitapride. It was concluded that the analytical technique showed good repeatability (Table 4).. Table 4. Results of repeatability analysis (Method precision and System precision). Method precision Omeprazole S.No. 1 2 3 4 5 6 Avg SD %RSD. RT 2.633 2.632 2.632 2.632 2.632 2.687 2.641333 0.022376 0.85. Area 3360201 3382022 3361575 3353294 3358171 3343379 3359774 12741.71 0.38. Cinitapride S.No. 1 2 3 4 5 6 Avg SD %RSD. RT 3.917 3.943 3.94 3.939 3.939 3.994 3.945333 0.025633 0.65. Area 1796860 1809912 1799498 1795543 1799331 1797866 1799835 5158.728 0.29. System precision Omeprazole S.No. 1 2 3 4 5 6 Avg SD %RSD. RT 2.633 2.633 2.635 2.634 2.634 2.633 2.633667 0.000816 0.03. Area 3354162 3353373 3355997 3356414 3363668 3372308 3359320 7335.56 0.22. Reproducibility and Ruggedness The ruggedness of an analytical method is determined by analysis of aliquots from homogenous lots by different analysts using operational and environmental conditions that. Cinitapride S.No. 1 2 3 4 5 6 Avg SD %RSD. Area 1795001 1795147 1798388 1797250 1798146 1798272 1797034 1571.179 0.09. may differ but are still within the specified parameters of the assay. The assay was performed in different condition, different analyst, and different dates (Table 5).. Table 5. Results of reproducibility Omeprazole 99.21% Average Percentage Recovery SD between set of analysis on same date 12741.71 SD between set of analysis on different date 7335.56 RSD between set of analysis on same date 0.38%, RSD between set of analysis on different date 0.22%,. Robustness The robustness of the method was determined by deliberate changes in the method like alteration in pH of the mobile phase, percentage organic content, changes in the wavelength. The robustness of the method shows that there were no marked changes in the chromatographic parameters, which demonstrates that the method developed is robust. Specificity The selectivity of an analytical method is its ability to measure accurately and specifically the analyte of interest in the presence of components that may be expected to be present in the sample matrix. If an analytical procedure is able to separate and resolve the various components of a mixture and detect the analyte qualitatively the method is called selective. It has been observed that there are no peaks of diluents and placebo at main peak’s. Hence, the. RT 3.956 3.952 3.964 3.954 3.949 3.945 3.953333 0.006501 0.16. Cinitapride 99.97 % 5158.728 1571.179 0.29% 0.09%. chromatographic system used for the estimation of Omeprazole and Cinitapride is very selective and specific .Specificity studies indicating that the excipients did not interfere with the analysis. For demonstrating the specificity of the method for drug formulation the drug was spiked and the representative chromatogram (Fig.6). Page 134.
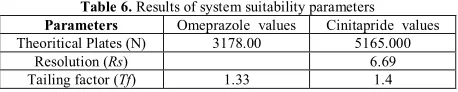
(5) G. Nagarajan et al. IRJP 2013, 4 (2) 4.. 5.. 6.. 7. Figure 6. Specificity Chromatograms of Omeprazole and Cinitapride. System Suitability A binary solution of 20 μg mL-1 of Omeprazole and 3 μg mL1 of Cinitapride (in triplicate) was prepared and same was injected, then the system suitability parameters like resolution factor (Rs), tailing factor (Tf) and theortical plates (N) were calculated and recorded in Table 6. The values for system suitability parameters showed feasibility of this method for routine pharmaceutical application. Table 6. Results of system suitability parameters Omeprazole values Cinitapride values Parameters Theoritical Plates (N) 3178.00 5165.000 Resolution (Rs) 6.69 Tailing factor (Tf) 1.33 1.4. CONCLUSION The proposed RP-HPLC method is found to be simple, accurate, precise, linear, and specific for quantitative estimation of Omeprazole and Cinitapride in bulk and its formulation. The proposed RP-HPLC method is cost effective and less time consuming. The values for system suitability parameters showed feasibility of this method for routine pharmaceutical application. Hence the present HPLC method is suitable for routine assay of Omeprazole and Cinitapride in raw materials and in pharmaceutical formulations in the quality control laboratories. ACKNOWLEDGEMENT The authors are highly thankful to Shree Dr. KV Subba Reddy, Chairman, DR KV Subba reddy group of institution, Kurnool, Andhra Pradesh, India, for providing all the facilities to carry out the work. And thanks to Shasun Chemicals, Puducherry, India, for providing a sample of Omeprazole and Cinitapride as a gift. REFERENCES 1. Indian pharmacopoeia, Indian pharmacopoeia commission.2: p 1813. 2. O’Neil M.J. editor The Merck Index..Whitehouse Station (NJ,USA):Merck and Co Inc 2006;14: 2297. 3. Sweetman S. C, Martindale Ed, The Complete drug reference Pharmaceutical press , 2002;35:1220.. 8.. 9.. 10.. 11.. 12.. 13.. 14.. 15.. 16.. 17.. Syeda Humaira, Akalanka Dey, S.Appala Raju, and Syed Sanaullah Development and Validation of a Rapid RP HPLC Method for the Determination of Cinitapride Hydrogen Tartarate in Solid Oral Dosage Forms .E-Journal of Chemistry. 2011; 8: 1424-1429. Fábio S. Murakami, Ariane P. Cruz, Rafael N. Pereira, Bruno R.Valente & Marcos A. S. Silva Development and Validation of a RP‐HPLC Method to Quantify Omeprazole in Delayed Release Tablets. Journal of Liquid Chromatography & Related Technologies. 2007; 30(1):113-121. Samer Houshe, Ghada Bach our, M.Fawaz Chehna Development of Rapid and Simple Analytical Method for Some Proton Pump Inhibitors (PPIs) Using HPLC. Jordan Journal of Pharmaceutical Sciences. 2011; 4(3): 222-236. Patel G.H, Prajapt S.T , Patel C. N , Analytical Method Development And Validation For Simultanious Determination Of Cinitapride And Pantoprazole By Rp-Hplc ",International Journal of Pharmacy&Technology. 2012; 4: 4253-4260. Gregory Podilsky, Markoulina Berger‐Gryllaki, Bernard Testa and André Pannatier, Development and Validation of an HPLC Method for the Simultaneous Monitoring of Bromazepam and Omeprazole, Journal of Liquid Chromatography & Related Technologies. 2008; 31(6):878890.. Chennupati V. Suresh, G. Vidya SagarDevelopment And Validation Of Rp-Hplc Method For The Determination Of Cinitapride In Pure And Pharmaceutical Dosage Forms. Bulletin of Pharmaceutical Research . 2012 ; 1:190. Ashok Reddy. S, Chandra Shekar. K.B, Murali.MDevelopment And Validation Of Rp-Hplc Method To Determine Cinitapride Hydrogen Tartarate In Bulk And Pharmaceutical Formulation, Journal of Global Trends in Pharmaceutical sciences. 2012; 3(2):619-627. Pierina S. Bonato, Fernanda O. Paias(2008) Enantioselective Analysis Of Omeprazole In Pharmaceutical Formulations By Chiral HighPerformance Liquid Chromatography And Capillary Electrophoresis.Journal Of The Brazilian Chemical Society. J. Braz. Chem. Soc. 2008; 15(2). Hemalatha.Pv, Jerad Suresh.A, And Niraimathi.V Quantification Of Cinitapride And Pantoprazole In Bulk And Oral Dosage Form By Visible Spectrophotometric Method .International Journal of Pharmacy and Pharmaceutical Sciences. 2012; 4(3): 279-283. Syeda Humaira, Akalanka Dey, S.Appasla Raju, and Syed (2010) Applications Of Colorimetric Methods For The Determination Of Cinitapride Hydrogen Tartarate In Drug, International Journal of Pharmacy and Pharmaceutical Sciences. 2010; 2(1):134-136.In Satyanarayana. K.V.V, Nageswara Rao.P Validated spectrophotometric methods for the assay of cinitapride hydrogen tartrate in pharmaceuticals,Chemical industry and chemical engineering quarterly. 2012;(1): 65-65. Thangabalan.B, Vijayaraj Kumar.P Development And Validation Of Spectrophotometric Methods For The Determination Of Cinitapride In Pure And In Its Pharmaceutical Formulation ,Asian Journal of Pharmaceutical and Clinical Research. 2012; 5(s): 117-118. Jha, Preeta, Parveen, Rabea, Khan, Suroor A, Alam, Ozair,Ahmad,Sayeed Stability Indicating High-Performance Thin-Layer Chromatographic Method For Quantitative Determination Of Omeprazole In Capsule Dosage Form journal Of AOAC International. 2012; 93( 3): 787-791. Espinosa Bosch.M, Ruiz Sánchez A.J, Sánchez Rojas F ,Bosch Ojed. C Analytical Methodologies For The Determination Of Omeprazole An overview Journal of Pharmaceutical and Biomedical Analysis. 2007; 44(4): 831–844.. Source of support: Nil, Conflict of interest: None Declared. IRJP is an official publication of Moksha Publishing House. Website: www.mokshaph.com. All rights reserved.. Page 135.
(6)
Figure
+2
Related documents
The purpose of this study is to characterize the very eld- erly population, who received emergency general surgery, and examine their surgical outcomes including identifica- tion
The generation interval is defined as the moment of infection of the contact bird relative to the moment of infection of the inoculated bird (i.e. it is given by e2j in trial j if
suis cells were detected on PAECs incubated with the negative control preparation (Figure 5d).. To assess whether the presence
AGDL: Agglomerative clustering on a directed graph; AGMFit: Affiliation graph model fitting; CD: Community discovery; CDlib: Community discovery library; CDTB: Community
attenuated virus, as it is clear from the tissue culture studies that this virus replicates well; direct comparisons in which the two isolates are used to infect a compatible cell
In contrast, PAM incubated 1 h with EPI300 (pMCH-vtaA8 pEGFP) or EPI300 (pMCH-vtaA9 pEGFP) showed a lower percentage of macrophages with fluores- cent bacteria than the control with
This study was conducted to examine the difference in shape of male and female upper and lower dental arches, as well as the difference in their transversal and longitu- dinal
