AN IMPROVED CLUSTERING
ALGORITHM FOR CUSTOMER
SEGMENTATION
PRABHA DHANDAYUDAM
Department of Computer Science and Engineering, Sri Krishna College of Engineering and Technology, Coimbatore, Tamilnadu, India
Dr. ILANGO KRISHNAMURTHI
Department of Computer Science and Engineering, Sri Krishna College of Engineering and Technology, Coimbatore, Tamilnadu, India
Abstract
Customer Segmentation is the process of grouping the customers based on their purchase habit. Data mining is useful in finding knowledge from huge amounts of data. The clustering techniques in data mining can be used for the customer segmentation process so that it clusters the customers in such a way that the customers in one group behave similar when compared to the customers in the other group based on their transaction details. The Recency (R), Frequency (F) and Monetary (M) are the important attributes that determine the purchase behavior of the customer. In this, we have provided an improved clustering algorithm for segmenting customers using RFM values and compared the performance against the traditional techniques like K-means, single link and complete link.
Keywords: Customer Segmentation; Clustering; Customer Relationship Management; RFM method.
1. Introduction
Customer Relationship Management (CRM) technology is a mediator between customer management activities in all stages of a relationship (initiation, maintenance and termination) and business performance [Markus Wubben (2008)]. Customer Segmentation gives a quantifiable way to analyze the customer data and distinguish the customers based on their purchase behavior [Jing Wu and Zheng Lin (2005)]. In this way the customers can be grouped into different categories for which the marketing people can employ targeted marketing and thus retain the customers. Once the customers are segmented, rules can be generated to describe the customers in each group based on their purchase behavior. These rules can be used to classify the new customers to the appropriate group who have similar purchase characteristics. RFM method is very effective for customer segmentation [Jing Wu and Zheng Lin (2005)]. R means recency which indicates the time interval between the present and previous transaction date of a customer. F means frequency which indicates the number of transactions that the customer has done in a particular interval of time. M means monetary which indicates the total value of the customer’s transaction amount. It has been proven that the values of R, F and M decide the characteristics of the customer behavior [Newell (1997)].
Data mining is the process of extracting useful information from huge volumes of data. It finds a useful application in CRM where large amount of customer data are dealt [Ngai et.al. (2009)]. Clustering technique in data mining produces clusters for the given input data where data in one cluster is more similar when compared to data in other clusters [Han and Kamber (2001)]. The similarity is measured in terms of the distance between the data. Distance can be calculated using the Manhattan distance and it is given by
(1)
ni
i i
y
x
y
x
In Eq. 1, n indicates the number of dimensions in the given data, x and y are the data in the data set, d(x, y) is the distance between data x and y. For the customer segmentation, the attributes R, F and M are used as the three dimensions in clustering technique. Customers can be segmented using other Artificial Intelligence (AI) methods like Self Organizing Map (SOM), Genetic Algorithm (GA), Particle Swarm Optimization (PSO) and Artificial Bee Colony (ABC). GA is a part of evolutionary computational technique. It is based on the process of natural evolution using operations like mutation and cross over. The main disadvantage of GA is it is time consuming and it is difficult to make the solution converge to an optimal solution and has stability issues. SOM is an unsupervised neural network learning algorithm. Neural network has interconnected processing elements and achieves input/output relationships. It is a trial and error method and suffers from long training time [Ching-Hsue Cheng and You-Shyang Chen (2009)]. PSO is an evolutionary computation technique developed by Kennedy and Eberhart (1995). Like GA, PSO has a fitness evaluation function that takes the particle’s position and assigns to it a fitness value. The objective is to optimize the fitness function [Chui-Yu Chiu et.al. (2009)]. It has the same demerits as those of GA. ABC are based on the behavior of honey-bees for food collection. A greedy selection mechanism is employed to choose the candidate solution which is tedious [Changsheng Zhang et.al. (2010)].
In this paper, an improved clustering algorithm has been developed so that the customers are segmented to proper groups. The performance of the algorithm is compared with other clustering algorithms like K-means, single link and complete link.
The rest of the paper is organized in the following: In Section 2 we describe the overview of customer segmentation process and clustering algorithms. In section 3 we propose an improved clustering algorithm for customer segmentation. In Section 4 we compare the results obtained using various clustering algorithms. Finally in Section 5 we conclude the best clustering algorithm according to the criteria chosen for comparison.
2. Literature Review
2.1 Customer segmentation
CRM comprises a set of processes and enabling systems supporting a business strategy to build long term, profitable relationships with specific customers [Ling and Yen (2001)]. It is an important technology in every business because all the businesses are customer centric. It consists of identifying, attracting, retaining and developing customers. Customer identification includes target customer analysis and customer segmentation. Target customer analysis analyzes the customer characteristics to seek segments of customers [Woo et.al. (2005)]. Customer segmentation is the process of dividing customers into homogeneous groups on the basis of common attributes [Zeling Wang and Xinghui Lei (2010)]. Customer segmentation is typically done by applying some form of cluster analysis to obtain a set of segments [Mirko Bottcher et.al. (2009)]. The customer identification is followed by customer attraction which motivates each segment of customers in different way. Customer retention and customer development deals with retaining the existing customers and maximizing the customer purchase value respectively [Ngai et.al. (2009)].
Customer segmentation requires a comprehensive understanding of enterprise customers [Huaping Gong and Qiong Xia (2009)]. It is a popular method used by customer attraction phase for selecting customers in each segment [Dyche (2001)]. RFM analysis is used to identify and represent the customer characteristics by three attributes namely Recency (R), Monetary (M) and Frequency (F). R indicates the time interval between the present and previous transaction date of a customer. F indicates the number of transactions that the customer has done in a particular interval of time. M indicates the total value of the customer’s transaction amount. Different groups of customers are segmented using their consuming behavior via RFM attributes. This ensures that the standards which cluster customer value are not established subjectively, so that the clustering standards are established objectively based on RFM attributes [Ching-Hsue Cheng and You-Shyang Chen. (2009)].
2.2 Clustering algorithms
and then successively merges clusters until all points have been merged into a single cluster. Divisive clustering treats all data points in a single cluster and successively breaks the clusters till one data point remains in each cluster. Partitioning algorithms partition the data set into predefined k number of clusters [Han and Kamber (2001)].
2.2.1 Partitioning algorithms
It partitions the database D of n objects into a set of k clusters so that it optimizes the chosen partition criterion. Each object is placed in exactly one of the k non-overlapping clusters. K-means algorithm is based on partition method of clustering. The steps in K-means algorithm are as follows:
(1) Initialize centers for k clusters randomly
(2) Calculate distance between each object to k-cluster centers using the Manhattan distance formula given by Eq. 1
(3) Assign objects to one of the nearest cluster center
(4) Calculate the center for each cluster as the mean value of the objects assigned to it (5) Repeat steps 2 to 4 until the objects assigned to the clusters do not change
In this the assignment of objects to k clusters depends on the initial centers of the clusters. The output differs if the initial centers of the clusters are varied. It is not suitable to discover clusters with non-elliptical shapes because the objects are scattered around the center of the clusters.
2.2.2 Hierarchical algorithms
It creates a hierarchical decomposition of the set of objects either using top down approach or bottom up approach. The agglomerative clustering algorithms use bottom up approach and divisive clustering algorithms use top down approach. It does not require the number of clusters k as the input but requires a termination condition. Single link and complete link algorithms are examples of agglomerative hierarchical clustering method. The steps in single link algorithm are as follows:
(1) Assign each object to its own cluster(singleton cluster)
(2) Calculate the distance from each object to all other objects using Manhattan distance (Eq. 1) and store it in a distance matrix
(3) Identify the two clusters with the shortest distance in the matrix and merge them together
(4) The distance of an object to the new cluster is the minimum distance of the object to the objects in the new cluster
(5) Update the distance of each object to the new cluster in the distance matrix (6) Repeat steps 3 to 5 until the required number of clusters are obtained
It produces non elliptical shapes but produces long and elongated clusters. The steps in complete link algorithm are as follows:
(1) Assign each object to its own cluster (singleton cluster)
(2) Calculate the distance from each object to all other objects using Manhattan distance (Eq. 1) and store it in a distance matrix
(3) Identify the two clusters with the shortest distance in the matrix and merge them together
(4) The distance of an object to the new cluster is the maximum distance of the object to the objects in the new cluster
(5) Update the distance of each object to the new cluster in the distance matrix (6) Repeat steps 3 to 5 until the required number of clusters are obtained
It produces more balanced clusters with equal diameters but it leads to breaking of bigger cluster.
3. Proposed Work
In K-means clustering algorithm output varies according to the initial centers of the clusters which are very difficult to choose correctly. Moreover the data point is scattered around the center. In single link and complete link clustering algorithms the number of clusters is reduced only by one as iteration proceeds. An improved clustering algorithm is provided to overcome the difficulties of K-means, single link and complete link which can be used to segment the customers based on the three attributes R, F and M. The steps are as follows:
(1) Assign each object to its own cluster(singleton cluster)
(3) Find the minimum value in the distance matrix
(4) If the minimum value found in step2 occurs more than once for a pair of clusters in the distance matrix then for all pair of clusters merge the two clusters
(5) Calculate the center for each cluster obtained in step 4 and assign the center value to the objects within that cluster
(6) Repeat steps 2 to 5 until the required number of clusters are obtained
The algorithm starts with n number of clusters where n indicates the number of objects in the data set. The two clusters which have minimum distance are merged. If m indicates the number of cluster pairs which has same minimum distance between them then m cluster pairs are merged individually. If k indicates the number of objects in m clusters then number of clusters reduces by (m-k) for successive iteration. It does not require any initial center value as in k-means but instead updates the center of clusters as it proceeds. In k-means the clustered output depends upon the initial cluster center that is the objects inside a cluster differs if the initial cluster center is changed. In this algorithm the output is consistent for the same data set. In single link and complete link algorithms, the number of clusters reduces by one for successive iteration. The single link calculates the distance between two clusters as the minimum distance of any point in one cluster and any point in other cluster which may lead to elongated clusters in one direction. In this algorithm the distance between the two clusters is the distance between the centers of the clusters and so there is no problem of elongated clusters. The complete link calculates the distance between two clusters as the maximum distance of any point in one cluster and any point in other cluster which tend to break large clusters and all clusters have same diameter. In the improved clustering algorithm the cluster diameter varies depending upon the values of the objects in the data set.
4. Experimental Results
Real data set of the customer transaction details are used for the clustering algorithms. The data set consists of 43,244 records of customer transaction for a period of four months for a fertilizer manufacturing company to their distributors (B2B). For each transaction party id, date of purchase and amount of purchase are used to define R, F and M values. For each distinct party id, R is calculated as the time interval(in terms of days) between his/her last transaction and his previous transaction, F is calculated as the number of his/her transaction records and M is calculated as the sum of his/her purchase amount in the data set. Now the data set has only four attributes namely party id, R, F and M. Next the values of R, F and M are normalized as given below:
For normalizing R
(1) The data set is sorted in descending order of the R
(2) Divide the data set into five equal parts of 20% record in each
(3) Assign numbers 1,2,3,4,5 to first, second, third, fourth, fifth part of records respectively For normalizing F
(1) The data set is sorted in ascending order of the F
(2) Divide the data set into five equal parts of 20% record in each
(3) Assign numbers 1,2,3,4,5 to first, second, third, fourth, fifth part of records respectively For normalizing M
(1) The data set is sorted in ascending order of the M
(2) Divide the data set into five equal parts of 20% record in each
(3) Assign numbers 1,2,3,4,5 to first, second, third, fourth, fifth part of records respectively
After normalization the values of R, F and M are from 1 to 5 [Seyed Mohammad et.al. (2010)]. The normalized data set is now used by k-means, single link, complete link and improved clustering algorithms to produce their results. The performance of the clustering algorithms in terms of quality was measured by four criteria [Chui-Yu Chiu et.al. (2009)]. The four criteria are Mean Square Error (MSE), Intracluster distance, Inter cluster distance and Intra cluster distance divided by Inter cluster distance. The MSE is defined as
(2)
The intra cluster distance is the Manhattan distance between data within a cluster. It is given by
(3) X 2
) (
1 1,
The inter cluster distance is the Manhattan distance between the centre of the clusters. It is given by
(4)
In Eq. 2, 3, 4, n indicates the number of objects, k indicates number of clusters and mj indicates the center of jth cluster. The objective of the clustering algorithm is to minimize MSE, minimize intra cluster distance, maximize inter cluster distance and thus minimize intra / inter cluster distance.
Customers in the real data set are segmented into clusters using k-means, single link, complete link and improved clustering algorithms. The MSE is calculated using Eq. 2 for each algorithm by varying the number of clusters as 2, 3 and 4. The output is shown graphically in Fig. 1.The objective of the clustering algorithm is to minimize the MSE so that the deviation of the objects from its center is less. From the Fig. 1 it is observed that the MSE decreases as the number of clusters is increased. It is also observed that the improved clustering algorithm m has the least MSE.
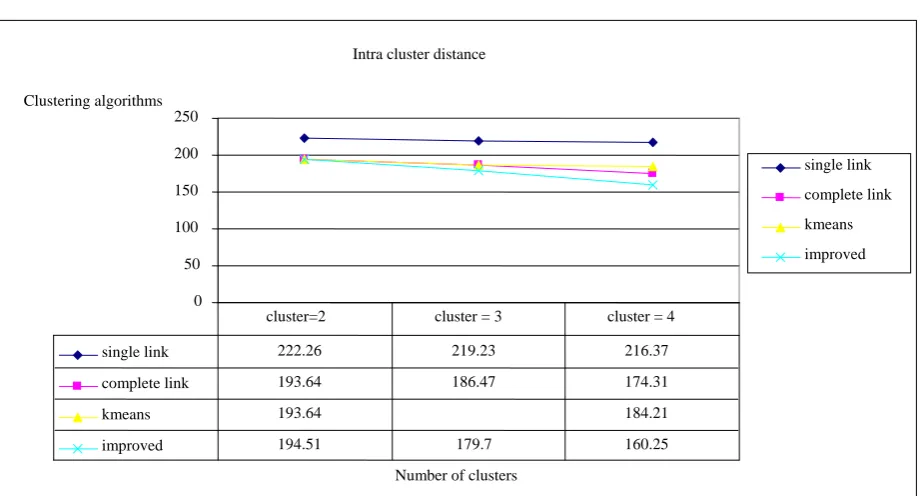
The Intra cluster distance is calculated using Eq. 3 for each algorithm by varying the number of clusters as 2, 3 and 4. The output is shown graphically in Fig. 2. The objective of the clustering algorithm is to minimize the Intra cluster distance so that the deviation of the objects within their cluster is less. From the Fig. 2 it is observed that the Intra cluster distance decreases as the number of clusters is increased. It is also observed that the improved clustering algorithm has the least intra cluster distance.
The Inter cluster distance is calculated using Eq. 4 for each algorithm by varying the number of clusters as 2, 3 and 4. The output is shown graphically in Fig. 3. The objective of the clustering algorithm is to maximize the inter cluster distance so that the distance between the cluster centers are far away. From the Fig. 3 it is observed that the Inter cluster distance increases as the number of clusters is increased. It is also observed that the improved clustering algorithm has the highest intra cluster distance.
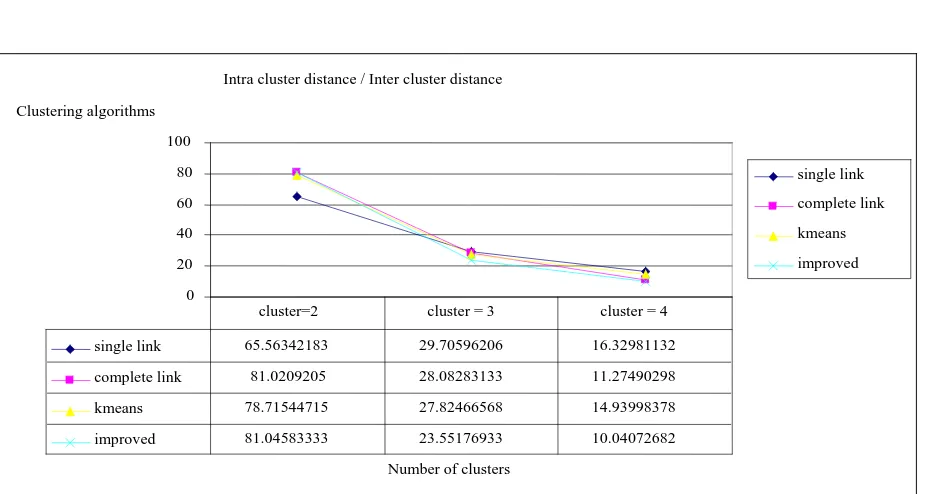
The Intra cluster distance / Inter cluster distance is calculated for all the algorithms with number of clusters as 2, 3 and 4. The output is shown graphically in Fig. 4. The objective of the clustering algorithm is to minimize the above calculated value. From the Fig. 4 it is observed that the value decreases as the number of clusters increase. It is also observed that the improved clustering algorithm has the minimum value of ratio between intra cluster distance and inter cluster distance.
The distance between the merging clusters increases as the number of clusters is reduced and to obtain the required number of clusters the clustering algorithm merges the clusters which are far away. This produces increase in MSE, increase in intra cluster distance, decrease in inter cluster distance, increase in ratio between intra cluster distance and inter cluster distance when there is a decrease in number of clusters. The statement can be verified using the two extreme conditions: number of clusters is equal to one and number of clusters is equal to the number of objects. When the number of cluster is equal to one, all the objects are in same cluster that is it has the highest MSE, highest intra cluster distance, lowest inter cluster distance and highest value for the ratio between intra cluster distance and inter cluster distance. When the number of clusters is equal to number of objects, each individual object constitutes a cluster that is it has the lowest MSE, lowest intra cluster distance, highest inter cluster distance and lowest value for the ratio between intra cluster distance and inter cluster distance.
The improved clustering algorithm produces the least MSE, least intra cluster distance, highest intra cluster distance and least value for the ratio between intra cluster distance and inter cluster distance because in each iteration the pair of clusters of same distance are merged in parallel instead of merging only one pair of cluster at a time. The parallel merging of cluster pairs improves the quality of clustering algorithm.
k
i
k
i j
j
i m
m d
1 1
Fig. 1 Mean Squared Error for clustering algorithms
Fig. 2 Intra cluster distance for clustering algorithms Intra cluster distance
0 50 100 150 200 250
Number of clusters Clustering algorithms
single link complete link kmeans improved
single link 222.26 219.23 216.37 complete link 193.64 186.47 174.31 kmeans 193.64 184.21 improved 194.51 179.7 160.25 cluster=2 cluster = 3 cluster = 4
Mean Square Error
0 100 200 300 400 500 600
Number of clusters Clustering algorithm
single link complete link kmeans improved
Fig. 3 Inter cluster distance for clustering algorithms
Fig. 4 Intra cluster distance / Inter cluster distance for clustering algorithms
5. Conclusion
Customer Relationship Management is a technology that manages relationship with customers in order to improve the performance of business. In CRM, the customer segmentation plays an important role in identifying the customers by grouping similar customers. In this paper clustering technique in data mining has been used for customer segmentation. It has been shown that different clustering algorithms results in different cluster outputs and their performance have been compared. For a good clustering algorithm, the customers within the cluster should behave more similar when compared to the customers in other clusters so performance evaluation criteria
Inter cluster distance
0 5 10 15 20
Number of clusters Clustering algorithms
single link complete link kmeans improved
single link 3.39 7.38 13.25 complete link 2.39 6.64 15.46 kmeans 2.46 6.73 12.33 improved 2.4 7.63 15.96 cluster=2 cluster = 3 cluster = 4
Intra cluster distance / Inter cluster distance
0 20 40 60 80 100
Number of clusters Clustering algorithms
single link complete link kmeans improved
were chosen accordingly. It has also been shown that the improved clustering algorithm produces better results when compared to k-means, single link and complete link algorithms.
References
[1] Markus Wubben. (2008): Analytical CRM, Chapter 2, pp. 11 – 48.
[2] Jing Wu; Zheng Lin. (2005): Research on Customer Segmentation Model by Clustering, In Proceedings of the ACM 7th international conference on Electronic commerce, pp. 316-318.
[3] Newell, F. (1997): The new rules of marketing: How to use one-to-one relationship marketing to be the leader in your industry, McGraw-Hill Publisher.
[4] Ngai E.W.T.; Li Xiu; D.C.K. Chau. (2009): Application of data mining techniques in customer relationship management: A literature review and classification, Expert Systems with Applications, 36(2), pp. 2592-2602.
[5] Han, J.; Kamber, M. (2001): Data mining: Concepts and techniques, Morgan Kaufmann Publisher.
[6] Ching-Hsue Cheng; You-Shyang Chen. (2009): Classifying the segmentation of customer value via RFM model and RS theory, Expert Systems with Applications, 36(3), pp.4176-4184.
[7] Chui-Yu Chiu; Yi-Feng Chen; I-Ting Kuo; He Chun Ku. (2009): An intelligent market segmentation system using k-means and particle swarm optimization, Expert Systems with Applications, 36, pp. 4558-4565.
[8] Changsheng Zhang; Danton Ouyang; Jiaxu Ning. (2010): An artificial bee colony approach for clustering, Expert Systems with Applications, pp. 4761-4767.
[9] Ling.; and Yen.D.C. (2001): Customer relationship management: An analysis framework and implementation strategies, Journal of Computer Information Systems, 41, pp. 82–97.
[10] Woo, J. Y.; Bae, S. M.; and Park, S. C. (2005): Visualization method for customer targeting using customer map, Expert Systems with Applications, 28, pp. 763–772.
[11] Zeling Wang; Xinghui Lei. (2010): Study on Customer Retention under Dynamic Markets. In Proceedings of Second International Conference on Networks Security, Wireless Communications and Trusted Computing, 2, pp. 514-517.
[12] Mirko Bottcher; Martin Spott; Detlef Nauck; Rudolf Kruse. (2009): Mining changing customer segments in dynamic markets, Expert Systems with Applications, 36(3), pp. 155-164.
[13] Huaping Gong; Qiong Xia. (2009): Study on Application of Customer Segmentation Based on Data Mining Technology, In Proceedings of the 2009 ETP International Conference on Future Computer and Communication, IEEE Computer Society Washington, DC, pp. 167-170..
[14] Dyche, J. (2001): The CRM handbook: A business guide to customer relationship management, Addison Wesley Publisher.