Abstract-- Post-release detection of a software vulnerability does not only cost a company money to fix, but also results
in loss of reputation and damaging litigation. Techniques to prevent and detect vulnerabilities prior to release, therefore, are valuable. We performed empirical case studies on two large, widely-used open source projects: the Mozilla Firefox web browser and the Red Hat Enterprise Linux kernel. We investigated whether software metrics obtained early in the software development life cycle are discriminative of vulnerable code locations, and can guide actions for an organization to take for improvement of code and development team. We also investigated whether the metrics are predictive of vulnerabilities so that prediction models can prioritize validation and verification efforts. The metrics fall into three categories: complexity, code churn, and developer activity metrics. The results indicate that the metrics are discriminative and predictive of vulnerabilities. The predictive model on the three categories of metrics predicted 70.8% of the known vulnerabilities by selecting only 10.9% of the project’s files. Similarly, the model for the Red Hat Enterprise Linux kernel found 68.8% of the known vulnerabilities by selecting only 13.0% of the files.
Index Terms-- Software Security, Software Vulnerability, Process metrics, Product metrics, Fault Prediction,
Vulnerability Prediction.
I. INTRODUCTION
single security problem can cause severe damage to an organization by not only incurring
large costs for late fixes, but by losing invaluable assets and credibility and leading to legal
issues. Annual world-wide losses caused from cyber attacks have been reported to be as high as
$226 billion[8]. Loss in stock market value in the days after an attack is estimated at $50 million
to $200 million per organization [8]. Therefore, organizations must prioritize vulnerability
detection efforts and prevent vulnerabilities from being injected.
One way of identifying the most vulnerable code locations is to use characteristics of the
software product itself. Perhaps complex code is more likely to be vulnerable than simple code.
Manuscript received March 18, 2009. This work was supported in part by National Science Foundation Grant No. 0716176 and the U.S. Army Research Office (ARO) under grant W911NF-08-1-0105 managed by NCSU Secure Open Systems Initiative (SOSI).
Y. Shin is with North Carolina State University, Raleigh, NC 27695 USA (telephone: 919-946-0781, e-mail: yonghee.shin@ ncsu.edu). A. Meneely is with North Carolina State University, Raleigh, NC 27695 USA (e-mail: [email protected]).
L. Williams is with North Carolina State University, Raleigh, NC 27695 USA (e-mail: [email protected]). J. Osborne is with North Carolina State University, Raleigh, NC 27695 USA (e-mail: [email protected]).
Evaluating Complexity, Code Churn, and
Developer Activity Metrics as Indicators of
Software Vulnerabilities
Yonghee SHIN, Student Member, IEEE, Andrew MENEELY, Student Member, IEEE, Laurie WILLIAMS, Member, IEEE, and Jason OSBORNE
Another way of identifying the most vulnerable code locations is to use characteristics of the
process of code development. Perhaps code that has undergone recent changes (i.e. code churn)
might have new vulnerabilities. Perhaps files worked on by software developers who work alone
are more likely to be vulnerable than the files worked on by collaborating developers. These
characteristics of software product and process can be quantified by complexity, code churn, and
developer activity metrics [4, 24, 25, 28]. Complexity metrics measure the structural complexity
of code and design such as the number of branches in code. Code churn metrics measure the
number of check-ins and amount of code changes occurred during development of code.
Developer activity metrics quantify the relationship between developers and code.
When metrics are discriminative of vulnerabilities (e.g. a high value of a metric indicates a
vulnerability), insight can be provided for development teams to take actions to prevent
vulnerabilities from being injected by restructuring code or reorganizing the development team.
We call discriminative metrics that can be used by organizations to drive improvement
actionable discriminative metrics (ADM). If, for example, complex code is likely to be
vulnerable, then development teams can use this fact to avoid unnecessarily complex code.
Alternatively, code churn is often inevitable and metrics of code churn do not offer clear
recommendations to developers to improve software quality. Therefore, we classify code churn
metrics as non-actionable.
We call metrics that can be used during development to predict the reliability of a product or
the location of vulnerabilities predictive metrics [2]. Predictive metrics can be used to prioritize
inspection and testing efforts to economically detect vulnerabilities.
The goal of this paper is twofold: (a) to evaluate whether complexity and developer activity
vulnerabilities; and (b) to evaluate whether complexity, code churn, and developer activity
metrics are predictive of vulnerable locations of code. To complete this goal, we performed
empirical studies on two widely-used, large scale open source projects: the Mozilla Firefox1 web
browser and the Linux kernel2 as distributed in Red Hat Enterprise Linux3. We analyzed 34
releases of Mozilla Firefox and one release of Red Hat Linux that consist of over three millions
lines of source code in each release. We collected the reported vulnerability information
spanning four years. From 197 vulnerability reports for Mozilla Firefox we identified 1197
instances of file changes to fix vulnerabilities. From 192 vulnerability reports for Red Hat we
identified 258 instances of file changes to fix vulnerabilities. We also collected complexity, code
churn, and developer activity metrics from the two projects and performed an empirical
evaluation of the metrics.
The rest of the paper is organized as follows: Section II defines background terms used in this
paper. Section III provides related work. Section IV discusses the hypotheses behind the metrics
and provides our methodology for evaluating the hypotheses. In Sections V and VI, we describe
the empirical case studies on the Mozilla Firefox web browser and the Red Hat Enterprise Linux
kernel. Section VII discusses our observations from the case studies and Section VIII discusses
the threats to validity of our study. Section IX summarizes our work.
II. BACKGROUND
This section describes the terms that we will use in this paper.
A. Internal and External Metrics
Since software quality, such as reliability or security, can be measured only after release,
metrics that are available early in the development life cycle can be used to estimate software
1 http://www.mozilla.com/firefox/ 2
http://kernel.org/
quality prior to release. Internal metrics measure the “non-executable software product during its
development stages” such as code and design specification [16]. An external metric measures
“the quality of the software product by measuring the behavior of the system” [16]. The internal
metrics we use in this study are complexity, code churn, and developer activity. We use these
internal metrics as predictors of the external metric of discovered software vulnerabilities. The
external metric we are evaluating in this study is nominal: whether or not a file is vulnerable or
neutral. We consider a file to be vulnerable if the file was found to have at least one vulnerability
that required a patch after release. A vulnerability is “an instance of a [fault] in the specification,
development, or configuration of software such that its execution can violate an [implicit or
explicit] security policy” [19].
B. Discriminative Power and Predictability
Discriminative power is defined as the ability to “discriminate between high-quality software
components and low-quality software components” [2]. Discriminative power is used for quality
control of software by evaluating software components against predetermined critical values
of metrics and by identifying components that fall outside quality limits [35]. In our study,
discriminative power is the ability to discriminate vulnerable code from neutral code.
Predictability is defined as the ability of a metric measured at time T1 to predict the software
quality at time T2 with required accuracy. Whether the required accuracy is satisfied or not is
determined by testing whether the predicted quality and the actual quality of software is within a
certain error range [2].
Note that while both of discriminative power and predictability evaluate the ability to classify
code as vulnerable or neutral, their purposes are different. The main purpose for evaluating
to improve software security, for example, by redesigning code based on the measures of metrics
or by reorganizing the team. The main purpose for evaluating predictability in this study is to
take corrective actions on the vulnerabilities found in the code locations predicted as vulnerable
by further inspection or testing. Discriminative power and discriminant analysis, a statistical
modeling technique that will be explained in Section IV, are different in our study. While
discriminant analysis can be used to evaluate both of discriminative power and predictability, we
used discriminant analysis only for the purpose of prediction in our study.
C. Binary Classification Evaluation Criteria
We perform binary classification to predict vulnerable files. A binary classifier can make two
possible errors: false positives (FP) and false negatives (FN). A FP is the classification of a
neutral file as a vulnerable file, and a FN is the classification of a vulnerable file as neutral. A
correctly classified vulnerable file is a true positive (TP), and a correctly classified neutral file is
a true negative (TN). A FP may cause a team to do additional testing or inspection of a file only
to find no vulnerabilities. A FN may allow a vulnerability to escape to the field after release. For
evaluating binary classification models, we use recall, precision, inspection rate, and
vulnerability rate.
Recall (R) is defined as the percentage of vulnerable files found: R=TP*100/(TP+FN).
Precision (P) is defined as the percentage of correctly predicted vulnerable files:
P=TP*100/(TP+FP).
Inspection rate (IR) is the percentage of files that were classified as vulnerable:
The inspection rate represents the percentage of files required for inspection or testing to achieve
the reported recall. For example, a IR=20% and R=80% means that 20% of files were classified
as vulnerable and those predicted vulnerable files contained 80% of actual vulnerabilities.
Vulnerability rate (VR) is the percentage of the number of vulnerabilities that were included in
the files classified as vulnerable:
VR = (Number of vulnerabilities in the files classified as vulnerable)*100 / (Total number of
vulnerabilities).
Note that VR is similar to recall, but differs where recall counts the number of vulnerable files,
VR counts the number of vulnerabilities in each file that was classified as vulnerable.
D. Network Analysis
In this paper, we use several terms from network analysis [6] and provide their meaning with
respect to developer and contribution networks in Section IV. Network analysis is the study of
characterizing and quantifying network structures, represented by graphs [6]. In network
analysis, vertices of a graph are called nodes, and edges are called connections. A sequence of
non-repeating, adjacent nodes is a path, and a shortest path between two nodes is called a
geodesic path (note that geodesic paths are not necessarily unique).
Centrality metrics are used to quantify the location of one node relative to other nodes in the
network. The centrality metrics we use for developer activity are degree, closeness, and
betweenness metrics. The degree metric is defined as the number of neighbors directly connected
to a node. The closeness centrality of node v is defined as the average distance from v to any
other node in the network that can be reached fromv. The betweenness centrality [6] of node v
Cluster metrics are used to measure the strength of interconnection between groups of nodes.
A cluster of nodes is a set of nodes such that there are more edges within a set of nodes (intra-set
edges) than edges between a set and other sets of nodes (inter-set edges). The cluster metric we
use for developer activity is edge betweenness [13]. The edge betweenness of edge e is defined
as the number of geodesic paths which pass through e. Since clusters have many intra-cluster
edges, edges within clusters have a low betweenness; conversely, edges between two clusters
have a high betweenness [13].
III. RELATED WORK
This section introduces a few studies on software vulnerability prediction. Then we provide
some prior studies that have used complexity, code churn, and developer metrics to predict
faults.
A. Vulnerability Prediction
Alhazmi et al. [3] investigated whether the number of latent vulnerabilities in a software
system can be predicted. The researchers analyzed the Windows and Red Hat Enterprise Linux
operating systems and observed that the ratio of vulnerabilities to the total number of faults falls
in the range of 1%~5%. If this ratio is constantly true across projects, the discovered
vulnerability densities can be a useful indicator to estimate the efforts to find undiscovered
vulnerabilities. While their study is useful for estimating the effort required to identify and
correct undiscovered security vulnerabilities, our approach provides specific locations of the
vulnerabilities in source code.
Neuhaus et al. [31] introduces a tool, Vulture, to automatically map vulnerability reports to
patterns of imports (#include) and function calls in vulnerable components using pattern
mining techniques. Vulture identified 45% of all vulnerable components (recall) using import
analysis, and 70% of all identified vulnerable components were true vulnerable components
(precision) using function call analysis. Vulture was also able to identify 82% of actual
vulnerabilities in the top 30% of files ranked in the order of predicted vulnerabilities. Our study
was also performed on Mozilla, but using different metrics that can be obtained from
development process as well as from source code.
Gegick et al. [12] modeled vulnerabilities in a large commercial telecommunications
software system. These researchers used source lines of code, alert density from a statistic
analysis tool, and code churn information. One of the models they tried identified 100% of
vulnerable components with an 8% false positive rate. However, the model predicted
vulnerabilities only at the component level and cannot direct developers to more specific
vulnerable code locations. Gegick et al. [11] also investigated whether non-security failure
information can be used to predict security failures. In their case study on a Cisco software
system, the number of failure reports per component was used as an internal metric to classify
vulnerable and neutral components. Their classification and regression tree model was able to
identify 57% of vulnerable components from the top 9% of components ranked in the order of
predicted probability of vulnerability with a 48% false positive rate. Our study provides
predictions at the file level and uses metrics that are available prior to release.
Shin and Williams [36] investigated whether the traditional code level complexity metrics
such as cyclomatic complexity can be used as indicators of vulnerabilities in the Mozilla
JavaScript Engine. Their results show that the correlations between complexity metrics and
traditional code level complexity metrics can be used as indicators of vulnerabilities, but further
investigation is required with new complexity metrics and other types of metrics including
process information.
B. Fault Prediction with complexity, code churn, and developer metrics
Basili et al. [4] showed the usefulness of object oriented (OO) design metrics to predict
fault-proneness in a study performed on eight medium-sized information management systems. The
logistic regression model with OO design metrics detected 88% of faulty classes and correctly
predicted 60% of classes as faulty. Briand et al. [7] also used OO design metrics to predict
defects and their logistic regression model classified fault-prone classes at over 80% of precision
and found over 90% of faulty classes. Nagappan et al. [29] found that sets of complexity metrics
are correlated with post-release defects using five major Microsoft product components,
including Internet Explorer 6. Menzies et al. [25] explored three data mining modeling
techniques, OneR, J48, and naïve Bayes, using code metrics to predict defects in MDP, a
repository for NASA data set. Their model using naïve Bayes was able to predict defects with
71% recall and 25% false positive rate.
Nagappan and Ball [26] investigated the usefulness of code churn information on Windows
Server 2003 to estimate post-release failures. The Pearson correlation and Spearman rank
correlation between estimated failures and actual post-release failures were 0.889 and 0.929
respectively for the best model. As an effort to improve the performance of prediction, several
studies have been performed with combined models of complexity, code churn, and other
metrics to improve the accuracy of prediction. Ostrand et al. [33] used code churn information
together with other metrics including lines of source code, file age, file type, and prior fault
predicted faults using negative binomial regression. Nagappan et al. [27, 28] also performed
empirical case studies on fault prediction with Windows XP and Windows Server 2003 using
code churn metrics and code dependency within and between modules. Both studies used a
multiple linear regression model on principal components and the Spearman rank correlations
between actual post-release failures and estimated failures were 0.64 and 0.68 at the best cases,
respectively.
We use two concepts to measure developer activity: developer networks and contribution
networks. The concept of a developer network has come from several sources, including [14,
24]. Gonzales-Barahona and Lopez-Fernandez [14] were the first to propose the idea of creating
developer networks as models of collaboration from source repositories to differentiate and
characterize projects. Meneely et al. [24] applied social network analysis to the developer
network in a telecommunications product to predict failures in files. Pinzger et al. [34] were the
first to propose the contribution network as a quantification of the direct and indirect contribution
of developers on specific resources of the project. Pinzger et al. found that files that were
contributed to by many developers, especially by developers who were making many different
contributions themselves, were found to be more failure-prone than files developed in relative
isolation. Other efforts exist [15, 30, 41] to quantify developer activity in projects, mostly via
counting the number of distinct developers who changed a file as we did in our study.
IV. METHODOLOGY
This section explains our methodology to explore the relationship between complexity, code
churn, and developer activity metrics and software vulnerabilities. For this purpose, we examine
provide the hypotheses for discriminative power and predictability of the metrics. Then, we
provide the evaluation criteria for the hypotheses and also explain our prediction models.
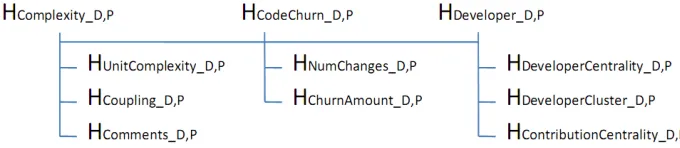
We organize our hypotheses in a three level hierarchy. The top level hypotheses correspond to
the three categories of metrics. The second level hypotheses correspond to the smaller
subcategories of metrics. The third level hypotheses correspond to discriminative power and
predictability for each individual metric.Fig. 1 shows the first and second level hypotheses. The
suffixes “_D” and “_P” represent the hypotheses for discriminative power and for predictability,
respectively.
Fig. 1. Hierarchy of hypotheses
A. Hypotheses for Discriminative Power
1) Complexity Metrics
Security experts often relate complexity and security [10, 23]. Complex code is more difficult
to understand and test, so developers may have a higher chance of introducing undetected errors.
We hypothesize that complexity metrics can indicate security vulnerabilities as follows:
HComplexity_D: Vulnerable files are more complex than neutral files.
We break this general hypothesis down into three more specific hypotheses: unit complexity,
coupling (interaction complexity), and comment metrics.
Developers might introduce more errors when code is complex and difficult to understand.
One characteristic of complex code is having a high number of decisions/branches. Code with
vulnerabilities not being found before release. A popular formulation of this kind of complexity
is cyclomatic complexity [22]. For the code with same level of complexity, longer code might be
more difficult to understand and maintain than shorter code. Our specific hypothesis related to
unit complexity is stated as:
HUnitComplexity_D: Vulnerable files have a higher unit complexity than neutral files.
The metrics we use to evaluate HUnitComplexity_D and their definitions are provided in Table I.
A second type of complexity is calculated based upon dependencies from one code unit to
other code units. If a code unit has many dependencies (or many other units depend on one code
unit), that unit is said to be highly coupled. When a unit is highly coupled with other code units
that are not closely related in their functions, change in a unit can be unnecessarily propagated to
other code units and improve a chance to introduce errors. Our specific hypothesis related to
coupling is, therefore, stated as:
HCoupling_D: Vulnerable files have a higher coupling than neutral files.
The metrics we use to evaluate HCoupling_D and their definitions are provided in Table I.
One way to reduce psychological burden imposed by complex code is to add comments [38,
40]. Comments can be used to record the rationale of design decisions so that the rationale is
understood when the code is modified by the same developer a long time after the code is
implemented or by other developers. Communication by comments between developers is
valuable in open source projects for which many developers can contribute on the same code
segment. Our specific hypothesis related to comments is therefore stated as:
2) Code Churn
Code is constantly evolving throughout the development process. Each new change in the
system brings a new risk of introducing a vulnerability.
Our first level hypothesis on the relationship between code churn and vulnerabilities is as
follows:
HCodeChurn_D: Vulnerable files have a higher code churn than neutral files.
Code churn can be counted in terms of the number of check-ins into a version control system
and the number of lines that have been added or deleted by code change. Thus, our second level
hypotheses related to code churn metrics are stated as:
HNumChanges_D: Vulnerable files have more frequent check-ins than neutral files.
TABLEI
DEFINITIONS OF COMPLEXITY METRICS
Related Hypothesis
Metric Definition
HUnitComplexity
CountLineCode The number of lines of code in a file CountDeclClass The number of classes defined in a file CountDeclFunction The number of functions defined in a file
CountLineCodeDecl The number of lines of code in a file devoted to declarations CountLinePreprocessor The number of lines of code in a file devoted to preprocessing SumEssential The sum of essential complexity, where essential complexity is
defined as the number of branches after reducing all the programming primitives such as a for loop in a function’s control flow graph into a node iteratively until the graph cannot be reduced any further. Completely well-structured code has essential complexity 1 [22, 39] SumCyclomaticStrict The sum of the strict cyclomatic complexity, where strict cyclomatic
complexity is defined as the number of conditional statements in a function
SumMaxNesting The sum of the MaxNesting in a file, where MaxNesting is defined as the maximum nesting level of control constructs such as if or
while statements in a function
MaxCyclomaticStrict The maximum of strict cyclomatic complexity in a file MaxMaxNesting The maximum of MaxNesting in a file
HCoupling
SumFanIn The sum of FanIn, where FanIn is defined as the number of inputs to a function such as parameters and global variables
SumFanOut The sum of FanOut, where FanOut is defined as the number of assignment to the parameters to call a function or global variables
MaxFanIn The maximum of FanIn
MaxFanOut The maximum of FanOut
HChurnAmount_D: Vulnerable files have more lines of code that have been changed than neutral
files.
The metrics we use to evaluate HCodeChurn_D and their definitions are provided in Table II.
TABLEII
DEFINITIONS OF CODE CHURN METRICS
Related Hypothesis
Metric Definition
HNumChanges NumChanges The number of check-ins for a file since the creation of a file
HChurnAmount
LinesChanged The cumulated number of code lines changed since the creation of a file LinesNew The cumulated number of new code lines since the creation of a file
3) Developer Activity
Software development is generally performed by development teams working together on a
common project. Lack of team cohesion, miscommunications, or misguided effort can all result
in problematic software, including security problems [23]. Version control data can be used to
construct a developer network and a contribution network based upon “which developer worked
on which file,” using network analysis defined in Section II. Then we can compute developer
centrality, developer clusters, and contribution centrality from those networks.
3.1) Developer Network Centrality
In our developer network, two developers are connected if they have both made a change to at
least one file in common during the period of time under study. The result is an undirected,
unweighted, and simple graph where each node represents a developer and edges are based on
whether or not they have worked on the same file during the same release.
A central developer has a high degree, a high betweenness, and/or a low closeness. Refer to
[24] for a more in-depth example of how centrality metrics are derived from developer networks.
In this study, we are using developer network centrality metrics to evaluate the following
HDeveloperCentrality_D: Vulnerable files are more likely to have been worked on by non-central
developers than neutral files.
We explain the meaning of high and low values of the metrics that might be associated with
high vulnerabilities in Table III. Note that we chose to not study DNMaxDegree,
DNMinCloseness, and DNMaxBetweenness because, for example, a high DNMaxDegree means
at least one central developer worked on the file, which is not as helpful as knowing that high
DNMinDegree denotes that all developers who worked on a file were central. In other words,
since most files in a project are worked on by at least one central developer, metrics that indicate
that at least one developer worked on a file tend to be homogenous and not particularly useful.
TABLEIII
MEANING OF DEVELOPER ACTIVITY METRICS
Related Hypothesis Metric Problematic When
Meaning
HDeveloperCentrality
DNMinDegree Low
File was changed by developers who are not central to the network
DNAvgDegree Low
DNMaxCloseness High
DNAvgCloseness High
DNMinBetweenness Low
DNAvgBetweenness Low
HDeveloperClustering
DNMaxEdgeBetweenness High File was contributed to by more than one cluster of developers, with few other files being worked on by each cluster DNAvgEdgeBetweenness High
HContributionCentrality
NumDevs High File was changed by many developers
CNCloseness High File was changed by developers who
focused on many other files
CNBetweenness High
3.2) Developer Network Cluster
Metrics of developer centrality give us information about individual developers, but we also
wonder the relationship between groups of developers. In our developer network, a file that is
between two clusters was worked on by two groups of developers, and those two groups did not
many files in common, or they would be part of the same cluster. In this study, we are using
developer network cluster metrics to evaluate the following hypothesis:
HDeveloperCluster_D: Vulnerable files are more likely to be changed by multiple, separate
developer clusters than neutral files.
For this study, we use the edge betweenness clustering technique [6] for discovering developer
clusters. We are interested in identifying the files that lie between clusters. Since edges and files
have a many-to-many relationship, we use the average and maximum of edge betweenness on
the developer network as provided in Table III.
3.3) Contribution Network
A contribution network is a quantification of the focus made on the relationship between a file
and developers instead of relationship between developers. Originally described by Pinzger et al
[34], the contribution network uses an undirected, weighted, and bipartite graph with two types
of nodes: developers and files. An edge exists where a developer made changes to a file. The
weight of an edge is the number of version control commits a developer made to the file. If a file
has high centrality, then that file was changed by many developers who made changes to many
other files – referred to as an “unfocused contribution.” [34] We evaluate the following
hypotheses:
HContributionCentrality_D: Vulnerable files are more likely to have an unfocused contribution than
neutral files.
Table III provides the meaning of the contribution network metrics.
B. Hypotheses for Predictability
When the individual metrics have discriminative power, the individual metrics and the
high prediction performance. We hypothesize that complexity, code churn, and developer activity
metrics individually and combined together in a model can predict vulnerabilities with over 70%
recall or VR and less than 30% IR. A model that satisfies these criteria indicates that over 70%
of vulnerable files or vulnerabilities could be detected by inspecting only 30% of the files. Note
that even when precision is very low, the prediction model is helpful for the organization to
economically detect vulnerabilities if organization can find high percentage of vulnerabilities
with small amount of inspection efforts. Therefore, we considered recall, VR, and IR as the most
important evaluation criteria in our study. Since recall and IR often trade off, obtaining high
recall and low IR at the same time is a challenging goal. Considering that the economic effect
that a single security vulnerability can bring to an organization, we favored high recall and VR to
a low IR. However, organizations may choose their own criteria depending on their quality goal
for their software products.
C. Evaluation of Hypotheses
To evaluate discriminative power of individual metrics, we used Mann-Whitney-Wilcoxon
(MWW) test to investigate the null hypothesis that the distribution of a given individual metric
measurement among all vulnerable files is the same as that for the metric among all neutral files.
The MWW is a non-parametric procedure that enables testing for equality of distributions
without making any assumptions about the distributions themselves, like the assumption of
normality [20]. To see the association direction (i.e. positively or negatively correlated), we
compared the means of the measures of internal metrics for the vulnerable and neutral files. We
considered our hypotheses for discriminative power are supported when the results from MWW
test are statistically significant at 0.05 level and when the association is in the direction
considered the higher level hypothesis is also supported. For example, if HUnitComplexity_D,
HCouplng_D, or HComments_D is supported, we considier HComplexity_D supported.
To evaluate predictability, we built prediction models using discriminant analysis and
Bayesian network modeling. First, we evaluated the predictability for univariate models with
individual metrics. Then, we evaluated predictability of a multivariate model by combining
metrics into a single model. Because our goal is to predict future vulnerabilities that have not
been observed yet, we used cross-validation. In cross-validation, we build or ``fit" models using
subsets of the data called training data, and evaluate these fitted models on separate data sets,
called test data. We performed next-release validation for Mozilla Firefox that has multiple
releases. Next-release validation at release N uses all of the data sets previous to N as the
training data and release N as the test data. We report the average of the results across all
releases. Alternatively, we used ten iterations of three-fold cross validation for Red Hat because
we analyzed a single release. Three-fold cross validation validates a model by dividing the data
set into thirds, using two thirds as the training data, and one third as the test data. The prediction
is then repeated three times with each of the three data sets as being test data set exactly once.
We repeated the whole process ten times and averaged the results.
Our hypotheses on predictability are supported when the models built from our metrics
provide over 70% recall or VR with less than 30% IR as described in Section IV.B.
D. Prediction Models
We utilized two classification techniques, linear discriminant analysis and Bayesian network,
to evaluate the performance of internal metrics. The two techniques have been used in fault
Linear discriminant analysis is a multivariate classification technique that uses the linear
function of p variables that achieves maximum separation among two or more groups [17].
Discriminant analysis has widespread applications, including facial recognition [21, 37]. Our
other multivariate modeling technique is the Bayesian network, which is a binary classification
technique based on Bayesian probability inference. In a Bayesian network, each internal metric
is represented by a node in a graph, and connections between nodes exist where there is a
conditional dependence observed between variables in the training set. Bayesian networks have
also been used in many applications, including gene expression [32] and satellite failure
monitoring systems [5].
To select the metrics for multivariate models that combine multiple metrics, we used a
stepwise variable selection method, proc stepdisc, provide by SAS4 statistical analysis tool. First
we selected metrics by applying stepwise selection method on discriminant analysis. We then
applied the same set of metrics to Bayesian network modeling to see whether the performances
of predictions are different depending on modeling techniques. Stepwise variable selection
method selects one variable at a time so that the model with the selected metrics maximizes the
classification between the two classes of a dependent variable [1]. If already-selected metrics do
not contribute significantly to the classification based on Wilks' lambda likelihood ratio criterion
[1], the variables are removed from the model. The variable selection repeats until no more
metrics meet the criteria for entry (p < .15) or removal (p < .15).
We used SAS v9.1.3 for the discriminant analysis and Weka5 v3.6.0 for the Bayesian network
modeling.
4
http://www.sas.com/
V. CASE STUDY 1:MOZILLA FIREFOX
Our first case study has been performed on the Mozilla Firefox, a widely-used open source
web browser. Mozilla Firefox had 34 releases at the time of data collection developed for four
years. Each release consists of over 10,000 files and over three million lines of source code.
A. Data Collection
We collected vulnerability information from Mozilla Foundation Security Advisories
(MFSAs) 6. Each MFSA includes bug ids that are linked to the Bugzilla7 bug tracking system.
Mozilla developers also add bug ids to the log of the CVS version control system8 when they
check in the files to the CVS after the vulnerabilities have been fixed. We searched the bug ids
from the CVS log to find the files that have been changed to fix vulnerabilities. The number of
MFSAs for Firefox was 197 as of August, 2nd, 2008. The vulnerability fixes for the MFSAs were
reported in 546 bug reports.
To collect complexity metrics, we used Understand C++9, a commercial metrics collection
tool. We obtained code churn and developer activity metrics from the CVS version control
system.
At the time of data collection, Firefox 1.0 and Firefox 2.0.0.16 were the first and the last
releases that had vulnerability reports. The gap between releases ranged from one to two months.
Since the vulnerable files were too few to perform statistical analysis at each release, we
combined the number of vulnerabilities for three consecutive releases and used that information
to predict the vulnerabilities at the fourth releases. We collected metrics for 11 combined
releases. The combined releases are denoted as R1 to R11 in this paper. We limited our analysis
6
http://www.mozilla.org/security/announce/
7 http://www.bugzilla.org/ 8
https://developer.mozilla.org/en/Mozilla_Source_Code_Via_CVS
to C/C++ and their header files to obtain complexity metrics. Table IV provides the project
statistics for the combined 11 releases.
The big increase of the number of files in R4 and R7 indicate that there were major changes in
those releases. The periods between most of the combined releases were three to four months.
However, Firefox 2.0.0.8, Firefox 2.0.0.9, and Firefox 2.0.0.10 were released within a month.
Lower observed fixes for R9 might be because the time gaps between releases 2.0.0.6 and 2.0.0.8
were shorter than for the other combined releases.
TABLEIV
PROJECT STATISTICS FOR MOZILLA FIREFOX
No. Firefox Release # of Files
KLOC Mean LOC
Files with Vulns.
Total Vulns.
Vulns. per File
% of Files with Vulns.
R1 1.0 / 1.0.1 / 1.0.2 10,320 3,688,444 357 70 84 0.008 0.678
R2 1.0.3 / 1.0.4 / 1.0.5 / 1.0.610 10,321 3,692,161 358 123 134 0.013 1.192
R3 1.0.7 / 1.5 / 1.5.0.1 10,321 3,693,609 358 93 159 0.015 0.901
R4 1.5.0.2 / 1.5.0.3 / 1.5.0.4 10,956 4,012,915 366 100 138 0.013 0.913 R5 1.5.0.5 / 1.5.0.6 / 1.5.0.7 10,961 4,018,972 367 109 153 0.014 0.994 R6 1.5.0.8 / 2.0 / 2.0.0.1 10,961 4,022,681 367 87 124 0.011 0.794 R7 2.0.0.2 / 2.0.0.3 / 2.0.0.4 11,060 4,131,084 374 114 162 0.015 1.031 R8 2.0.0.5 / 2.0.0.6 / 2.0.0.8 11,060 4,138,242 374 55 72 0.007 0.497 R9 2.0.0.8 / 2.0.0.9 / 2.0.0.10 11,076 4,142,497 374 14 15 0.001 0.126 R10 2.0.0.11 / 2.0.0.12 / 2.0.0.13 11,077 4,142,728 374 84 110 0.010 0.758 R11 2.0.0.14 / 2.0.0.15 / 2.0.0.16 11,080 4,145,805 374 27 46 0.004 0.244
B. Discriminative Power Test and Univariate Prediction Results
All of the metrics showed statistically significant difference between vulnerable and neutral
files using MWW test as shown in Table V. We also compared the mean and median of each
metric measurement for two groups of files to find the association direction (positive or negative)
between metrics and vulnerabilities. We performed the comparison for each release and also for
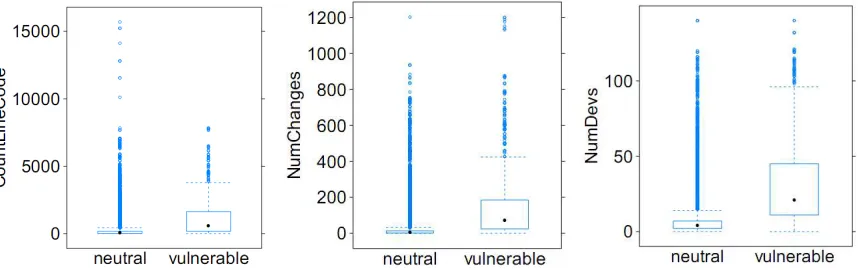
the whole data across releases. The trend was similar for both of the cases. Fig. 2 shows the
boxplots of comparisons of measures between the two groups for three representative metrics in
complexity, code churn, and developer activity metrics; CountLineCode, NumChanges, and
NumDevs. The left side boxplot for each metric shows the distribution of neutral files and the
right side boxplot shows the distribution of vulnerable files. The means and medians of the three
metrics for the vulnerable files were higher than the ones for the neutral files as we expected.
Fig. 2. Comparison of measures for vulnerable and neutral files
The results of MWW test and association directions for all the metrics are presented in Table
V. The plus sign in the Association column indicates that the higher the measure, the more
vulnerable the file tends to be. The minus sign indicates that the higher the measure, the less
vulnerable the file tends to be. The developer degree was the only sign that did not completely
agree: DNMinDegree was negatively correlated but DNAvgDegree was positively correlated.
This means that files are more likely to be vulnerable if they are changed by developers who
work on many other files with other developers on average, but when all of the developers are
central, the file is less likely to be vulnerable. Since this is not a direct contradiction, and the
other developer centrality metrics are supported, we count HDeveloperCentrality_D hypothesis as
supported. Overall, all of the hypotheses for discriminative power were supported except for
DNAvgDegree.
For the predictability of individual metrics, we performed univariate discriminant analysis and
hypotheses for predictability is over 70% recall or VR with less than 30% IR as described in
Section IV. C. We performed the analysis on the raw data, log transformed data, and square root
transformed data. Among those, log transformed data provided the best results. Table V shows
the cross-validated prediction results using discriminant analysis on the log transformed data and
results of hypotheses tests on predictability based on our criteria.
TABLEV
RESULTS OF DISCRIMINATIVE POWER TEST AND UNIVARIATE PREDICTION FOR MOZILLA FIREFOX
Discriminant Analysis Related Hypothesis Metric MWW Associ
ation HD
*
R* P* IR* VR* HP *
HComplexity Complexity Metrics √√√√ √√√√
HUnitComplexity
CountLineCode √ + √√√√ 79.0 2.1 28.7 82.9 √√√√
CountDeclClass √ + √√√√ 52.8 1.1 32.8 52.5 X
CountDeclFunction √ + √√√√ 77.2 1.9 29.6 80.3 √√√√
CountLineCodeDecl √ + √√√√ 79.0 2.2 26.2 82.7 √√√√
CountLinePreprocessor √ + √√√√ 70.1 2.1 24.1 75.0 √√√√
SumEssential √ + √√√√ 76.0 1.9 29.5 78.7 √√√√
SumCyclomaticStrict √ + √√√√ 76.8 1.7 32.9 79.6 X
MaxCyclomaticStrict √ + √√√√ 71.0 1.6 34.5 74.6 X
SumMaxNesting √ + √√√√ 64.8 1.8 26.3 68.3 X
MaxMaxNesting √ + √√√√ 70.4 1.6 35.5 73.5 X
HCoupling
SumFanIn √ + √√√√ 71.9 1.7 30.3 74.4 X
SumFanOut √ + √√√√ 69.8 1.7 30.2 72.2 X
MaxFanIn √ + √√√√ 72.3 1.8 32.6 74.7 X
MaxFanOut √ + √√√√ 68.2 1.5 37.1 71.3 X
HComments CommentDensity √ – √√√√ 84.4 1.3 48.9 86.7 X
HCodeChurn Code Churn Metrics √√√√ √√√√
HNumChanges NumChanges √ + √√√√ 81.5 3.0 20.0 84.7 √√√√
HChurnAmount
LinesChanged √ + √√√√ 81.5 2.4 24.6 84.6 √√√√
LinesNew √ + √√√√ 79.2 2.1 28.3 82.6 √√√√
HDeveloper Developer Metrics √√√√ √√√√
HDeveloperCentrality
DNMinDegree √ – √√√√ 57.0 1.2 36.6 60.5 X
DNAvgDegree √ + X 93.8 1.0 74.7 94.3 X
DNMaxCloseness √ + √√√√ 79.8 1.5 39.0 82.6 X
DNAvgCloseness √ + √√√√ 96.6 0.9 80.2 97.0 X
DNMinBetweenness √ – √√√√ 69.4 1.4 35.2 75.1 X
DNAvgBetweenness √ – √√√√ 96.8 0.9 82.1 97.6 X
HDeveloperClustering
DNMaxEdgeBetweenness √ + √√√√ 85.5 2.3 27.9 87.3 √√√√
DNAvgEdgeBetweenness √ + √√√√ 86.5 2.1 30.5 88.2 X
HContributionCentrality
NumDevs √ + √√√√ 82.9 2.8 21.5 85.5 √√√√
CNCloseness √ + √√√√ 81.3 2.7 22.6 84.4 √√√√
CNBetweenness √ + √√√√ 64.8 4.8 9.6 69.7 X
*. HD: Hypothesis test for discriminative power, R: Recall, P: Precision, IR: Inspection rate, VR: Vulnerability rate, HP:
The prior probability of a file being vulnerable or neutral for discriminant analysis was set to
0.5 in Table V and all the remaining analysis in this study. The bold face in the prediction results
indicates that the metric satisfied the criterion for over 70% recall or VR with less than 30% IR.
All of the code churn metrics supported our hypotheses for predictability. We were also able to
find some sets of complexity and developer activity metrics that supported our hypotheses for
predictability. While the recall and VR are over 70% for most of the metrics, the precision was
very low (below 5%) for all the metrics. Prediction with high recall and low IR is possible even
with this low precision because vulnerabilities were distributed in only a small percentage of
files in our data set.
Note that the metrics that provide high predictability individually do not necessarily provide
high predictability together with other metrics. Conversely, the metrics that provide low
predictability individually might be able to improve the overall predictability when they are used
in a model together with other metrics.
C. Multivariate Prediction Results
We created four models using complexity, code churn, developer activity, and combination of
the three categories of metrics. The independent variables were chosen using the stepwise
selection method described in Section IV.D. We used only the variables with coefficients that
were statistically significant at 0.05 level. We also created models with the log and square root
transformed metrics for the same set of metrics chosen by stepwise selection method for
discriminant analysis. Then we built models using those metrics for discriminant analysis and
Bayesian network. Additionally we also built models using all the collected metrics for Bayesian
network. Since the performance of Bayesian network is not affected by order-preserving data
With discriminant analysis, log transformed data provided the best results in general. With log
transformation, all of the models predicted less than 20% files as vulnerable (IR). Those
predicted vulnerable files in all the models included over 70% of actual vulnerable files (recall)
or over 70% of actual vulnerabilities (VR) in the system. The model with code churn metrics
provided the highest recall and VR, and the combined metrics model provided the lowest IR.
With Bayesian network, the models with all the collected metrics performed better than the
models with metrics selected by stepwise selection method. All of the models provided less than
20% IR. However, only the combined metrics model was able to find over 70% of actual
vulnerable files (recall) with less than 20% IR. Note that recall from multivariate models has not
been necessarily improved from univariate models with our data. However, IR clearly became
lower with multivariate models than with univariate models. Precision was very low (less than
5%) as was in univariate models.
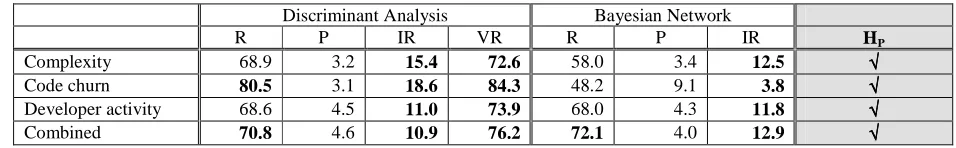
Table VI summarizes the cross-validated prediction results using discriminant analysis on log
transformed metrics and Bayesian network on all the collected metrics. VR was not available for
Bayesian network modeling with the Weka tool.
TABLEVI
RESULTS OF MULTIVARIATE PREDICTION FOR MOZILLA FIREFOX Discriminant Analysis Bayesian Network
R P IR VR R P IR HP
Complexity 68.9 3.2 15.4 72.6 58.0 3.4 12.5 √√√√
Code churn 80.5 3.1 18.6 84.3 48.2 9.1 3.8 √√√√
Developer activity 68.6 4.5 11.0 73.9 68.0 4.3 11.8 √√√√
Combined 70.8 4.6 10.9 76.2 72.1 4.0 12.9 √√√√
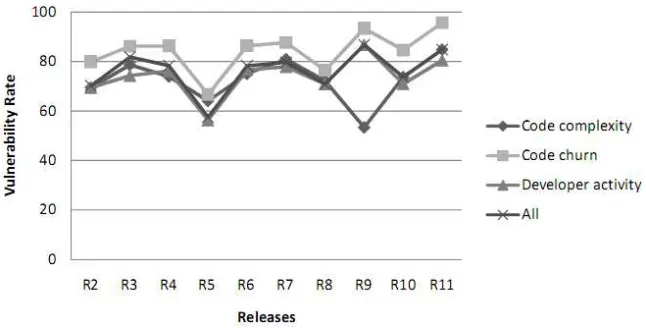
Since our metrics and models target at finding future vulnerabilities, the models should be able
to provide equal or better prediction performance as time passes. Fig. 3 shows the VR across
releases for the discriminant anlaysis models on the complexity, code churn, developer activity,
Fig. 3. Prediction results of disriminant analysis across releases
The predictive performance of the four models was slightly better for later releases than for
earlier releases, which indicates that the models are trained better with the information from
previous releases. The trend of recall over time was the same as that for VR. The decrease in VR
of R8 might be because sudden decrease in reported vulnerabilities for R8. However, the reason
of the sudden decreases in VR of R5 and R9 (complexity model) has not been identified.
VI. CASE STUDY 2:RED HAT ENTERPRISE LINUX KERNEL
Our second case study has been performed on the Linux kernel as it was distributed in the Red
Hat Enterprise Linux 4 (RHEL4) operating system. The Red Hat consists of 13,568 C and their
header files with over three million lines of source code. The details of the project, data
collection, and the prediction results are described in this section.
A. Data Collection
Gathering data for our external metric involved tracing through the development artifacts
related to each vulnerability reported in the Linux kernel. We collected our vulnerability data
(NVD)11, and the Red Hat Security Advisory (RHSR) security metrics database. Since some
vulnerability patches affect only certain releases, we examined each defect report manually to
ensure that developers had decided that patch was, in fact, required. Since we are only interested
in vulnerabilities that existed at the time of release, we did not include vulnerabilities introduced
by post-release patches (a.k.a “regressions”) in our data set. For vulnerabilities that did not have
all of the relevant artifacts (e.g. defect reports, patches), we consulted the director of the RHSR
team to correct the data. Our data set is a comprehensive list of reported, non-regression
vulnerabilities from RHEL4’s release in February 2005 through July 2008. We included only C
and their header files. Because RHEL4 included only one C++ file, we excluded the
CountDeclClass metric from our analysis.
To obtain code churn and developer activity data, we used the Linux kernel source
repository12. The RHEL4 operating system is based on kernel version 2.6.9, so we used all of the
version control data from kernel version 2.6.0 to 2.6.9, which was about approximately 15
months of development and maintenance. Table IX provides the project statistics.
TABLEIX
PROJECT STATISTICS FOR RED HAT LINUX
# of Files LOC Mean LOC Files with Vulns.
Total Vulns. Vulns. per File
% of Files with Vulns.
13,568 3,068,453 226 194 258 0.019 1.4%
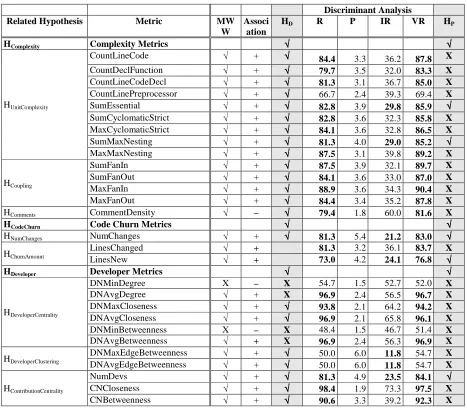
B. Discriminative Power Test and Univariate Prediction Results
All of the metrics showed statistically significant difference between vulnerable and neutral
files using MWW test except for DNMinDegree and DNMinBetweenness. All of the hypotheses
for discriminative power were supported except for DNMinDegree, DNAvgDegree,
DNMinBetweenness, and DNAvgBetweenness. Interestingly, DNAvgDegree was not supported
11
http://nvd.nist.gov/
in Mozilla either (see Section V.B). For the predictability of individual metrics, we performed
univariate discriminant analysis and validated the models using ten iterations of three-fold
cross-validation. Among the metrics, SumEssential, SumMaxNesting, NumChanges, LinesNew, and
NumDevs detected over 70% of vulnerable files with less than 30% IR.
Table X shows the results of discriminative power test and univariate prediction after
cross-validation.
TABLEX
RESULTS OF DISCRIMINATIVE POWER TEST AND UNIVARIATE PREDICTION FOR RED HAT
Discriminant Analysis Related Hypothesis Metric MW
W
Associ ation
HD R P IR VR HP
HComplexity Complexity Metrics √√√√ √√√√
HUnitComplexity
CountLineCode √ + √√√√ 84.4 3.3 36.2 87.8 X
CountDeclFunction √ + √√√√ 79.7 3.5 32.0 83.3 X
CountLineCodeDecl √ + √√√√ 81.3 3.1 36.7 85.0 X
CountLinePreprocessor √ + √√√√ 66.7 2.4 39.3 69.4 X
SumEssential √ + √√√√ 82.8 3.9 29.8 85.9 √√√√
SumCyclomaticStrict √ + √√√√ 82.8 3.6 32.3 85.8 X
MaxCyclomaticStrict √ + √√√√ 84.1 3.6 32.8 86.5 X
SumMaxNesting √ + √√√√ 81.3 4.0 29.0 85.2 √√√√
MaxMaxNesting √ + √√√√ 87.5 3.1 39.8 89.2 X
HCoupling
SumFanIn √ + √√√√ 87.5 3.9 32.1 89.7 X
SumFanOut √ + √√√√ 84.1 3.6 33.0 87.0 X
MaxFanIn √ + √√√√ 88.9 3.6 34.3 90.4 X
MaxFanOut √ + √√√√ 84.4 3.4 35.2 87.8 X
HComments CommentDensity √ – √√√√ 79.4 1.8 60.0 81.6 X
HCodeChurn Code Churn Metrics √√√√ √√√√
HNumChanges NumChanges √ + √√√√ 81.3 5.4 21.2 83.0 √√√√
HChurnAmount
LinesChanged √ + 81.3 3.2 36.1 83.7 X
LinesNew √ + 73.0 4.2 24.1 76.8 √√√√
HDeveloper Developer Metrics √√√√ √√√√
HDeveloperCentrality
DNMinDegree X – X 54.7 1.5 52.7 52.0 X
DNAvgDegree √ + X 96.9 2.4 56.5 96.7 X
DNMaxCloseness √ + √√√√ 93.8 2.1 64.2 94.2 X
DNAvgCloseness √ + √√√√ 96.9 2.1 65.8 96.1 X
DNMinBetweenness X – X 48.4 1.5 46.7 51.4 X
DNAvgBetweenness √ + X 96.9 2.4 56.3 96.9 X
HDeveloperClustering
DNMaxEdgeBetweenness √ + √√√√ 50.0 6.0 11.8 54.7 X
DNAvgEdgeBetweenness √ + √√√√ 50.0 6.0 11.8 54.7 X
HContributionCentrality
NumDevs √ + √√√√ 81.3 4.9 23.5 84.1 √√√√
CNCloseness √ + √√√√ 98.4 1.9 73.3 97.5 X
A. Multivariate Prediction Results
We built multivariate models using the metrics chosen by stepwise variable selection method.
Table XI provides the cross-validation results of discrimininant analysis on log transformed
metrics and Bayesian network on all the collected metrics for each category of metrics. With
discriminant analysis, complexity, code churn, and combined metrics models provided over 70%
recall or VR with less than 30% IR. With Bayesian network modeling, complexity and combined
metrics models provided over 70% recall with less than 30% IR.
TABLEXI
RESULTS OF MULTIVARIATE PREDICTION FOR RED HAT Discriminant Analysis Bayesian Network
R P IR VR R P IR HP
Complexity 79.7 4.5 25.3 83.9 70.8 5.0 20.2 √√√√
Code churn 78.1 5.4 20.5 81.3 21.0 17.2 1.8 √√√√
Developer activity 51.6 9.1 8.0 57.2 61.1 6.5 13.4 X
Combined 68.8 7.5 13.0 75.3 73.9 5.5 19.2 √√√√
VII. DISCUSSION
Most of the complexity, code churn, and developer activity metrics we used in this study were
able to discriminate vulnerable files and neutral files at statistically significant level. The results
from our case study support the following hypotheses across two projects.
HComplexity_D: Vulnerable files are more complex than neutral files.
HCodeChurn_D: Vulnerable files have a higher code churn than neutral files.
HDeveloper_D: Vulnerable files are more likely to have been changed by poor developer activity
than neutral files.
The predictive power of the metrics was different between projects and modeling techniques.
Discriminant analysis performed better than Bayesian network modeling in our study. With
discriminant anaylysis, seven of eight multivariate models presented in Table VI and Table XI
Bayesian network. We also performed logistic regression which is another well known
classification technique. However, using logistic regression, recall for both projects was less than
50%. We do not present the results of logistic regression in this paper because of the limited
space. With discriminant analysis, some of the univariate models outperformed multivariate
models in recall and VR. However, IRs were consistently lower for multivariate models than
univariate models for both projects.
The univariate and multivariate models using complexity, code churn, and combined metrics
supported our hypotheses for predictability across two projects using discriminant anlaysis
and/or Bayesian network. Developer activity metrics did not support our hypotheses for
predictability on Red Hat. Even in this case, however, developer activity metrics were able to
predict over half of the vulnerable files at 8% IR with discriminant analysis and 13.4% IR with
Bayesian network modeling. The combined metrics models provided lowest IR among the
models that supported our hypotheses using discriminant analysis on both projects. Even though
code churn metrics model provided high recall and low IR using discriminant analysis, the
prediction performance with Bayesian network was poor. Overall there was no clear evidence
whether one category of metrics is better than another because some metrics provided relatively
high recall with high inspection rate while other metrics provided relatively low recall with low
inspection rate. For example, code churn metrics provided higher recall than developer metrics,
but also required higher IR than developer metrics. However, all of the models using the three
categories of metrics and the combined metrics were able to predict vulnerabilities with over
VIII. THREATS TO VALIDITY
Internal validity. We performed our case studies on two open source projects whose
vulnerability information is publicly available. Our analysis does not account for latent
(undiscovered) vulnerabilities. Additionally, only fixed vulnerabilities are reported in detail to
avoid the possible attacks from malicious users; unfixed vulnerabilities are usually not publicly
available. However, considering the wide use of the subject projects and the size of community
involved in the development and testing of the projects, we believe the currently reported
vulnerabilities are not too limited to jeopardize our results. Also, the associations between
vulnerabilities and the metrics found in this study do not necessarily indicate causation.
However, we believe our results provide useful insights for organizations to take proactive or
reactive actions to reduce vulnerabilities.
External validity. Our results on vulnerability prediction were not fully consistent between
the two projects and the modeling techniques we used, even though complexity, code churn, and
combined metrics models supported our hypotheses for both of the projects. As with all
empirical studies, our results were limited to the metrics we collected and the modeling
techniques we used in this study. To generalize our observations from this study to other projects
in various domain, size, and operational and usage context, further studies should be performed.
We believe our results can be used to compare with the results from other projects and to
increase the understanding on the relationship between software vulnerabilities and the metrics
investigated in this study.
IX. SUMMARY
Our study explored the relationship between complexity, code churn, and developer activity
that organizations can take actions to change the measures of metrics by redesigning code or
reorganizing a development team when necessary. In our case study on Mozilla Firefox and Red
Hat Enterprise Linux kernel, those actionable metrics showed discriminative power between
vulnerable and neutral files. Therefore, organizations can use complexity and developer activity
metrics to proactively improve software security. For example, while some code cannot avoid
complexity, organizations can use the average values of complexity metrics for vulnerable files
and neutral files as a criterion to redesign unnecessarily complex code. Central developers tend
to produce less vulnerabilities than developers who work alone. Therefore, appropriate corrective
action in a development team such as pair programming or careful distribution of central
developers based on the measures of developer activity metrics is encouraged.
When metrics can predict vulnerabilities, those predictive metrics can be used to prioritize
inspection and testing effort. In our case study, all three categories of metrics had predictability
at one or both projects by providing over 70% recall or vulnerability rate with less than 30%
inspection rate. Code churn metrics provided the best recall for Mozilla Firefox among the
models using the three categories of metrics and combined metrics using discriminant analysis.
Complexity metrics provided the best recall for Red Hat using discriminant analysis. However,
there was no clear evidence whether one category of metrics was better than another. Whether
the prediction results are good or not can be determined by practitioners at organizations.
However, finding 84.3% of vulnerabilities by inspecting only 18.6% of total files (in the case of
code churn metrics model with discriminant analysis on Mozilla Firefox) might be a promising
result to appropriately allocate inspection efforts. Our results are promising. However,