Themed Section: Science and Technology
Cancer Data Classification Using Clustering Techniques
Dr.V.Umadevi1, P. Deepalakshmi2
1Research Director, Department of Computer Science, Jairams Arts and Science College, Karur, Tamil Nadu, India 2Research Scholar, Department of Computer Science, Jairams Arts and Science College, Karur, Tamil Nadu, India
ABSTRACT
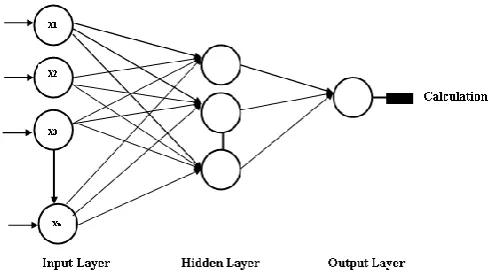
In a multilayered feedforward network, neurons are organized into layers. The input layer is not fully composed of neurons, but rather it consists of some values in a data record, that constitutes inputs to the next layer of neurons. The next layer is called a hidden layer; there may be many hidden nodes. The concluding layer is the output layer, there is only one node for each class. A single forward pass through the network results in the assignment of a value to each output node, and the record is assigned to whichever classifications node had the highest value. Multilayer feedforward networks are trained using the Backpropagation (BP) learning algorithm. Backpropagation training algorithm when applied to a feedforward multilayer neural network then it is known as Backpropagation neural network. Functional signals flows in the forward path and error signals transmit in backward path. That's why it is Error Backpropagation or shortly backpropagation network. The activation function that can be differentiated (such as sigmoid activation function) is chosen for hidden and output layer computational neurons. The algorithm is based on an error-correction rule. Learning is based upon mean squared error and generalized delta rule. The rule applied for weight updation is generalized delta rule.
Keywords: Backpropagation Neural Network , Clustering, Classification, Cancer Data
I.
INTRODUCTIONMuch research is being done in the academics as well as the industries towards the application of bioinformatics that uses computational approaches to solve biological problems. The goal of this field is to retrieve, analyze and interpret the vast and complex genomic data sets that are uncovered in large volumes of genes in molecular biology. Biological data mining posses various challenges like gene discovery, drug discovery, gene finding, revealing unknown relationship with respect to structure and function of genes to understand biological systems. This field faces demands for immediate prediction and classification due to the availability of DNA cancer data, structure information of proteins and microarray technology to provide dynamic information about thousand of genes in data. The aims of Bioinformatics are:
1. To organize data in a way that allows researcher and practitioners to access existing information and to submit new entries as they are produced. 2. To develop tools, software’s and resources that
aid in analyzing and management of data.
3. Use of this data is to analyze and interpret the results in a biologically meaningful manner. 4. To help practitioners in the pharmaceutical
industry by understanding the microarray cancer data structures which helps makes the disease prediction easy.
A. Objectives
researchers for prediction of cancers in cell, molecular function, drug discovery, medical diagnosis etc.
An efficient classification technique needs to be implemented or develop an efficietnt classifier to correctly classifify the unknown genes so that the cancer patient are diagonised correctly and this treatment can be done as per the diagnosis.
To develop an efficietntclassifierwhich can classifify and cluster the new mi-croarray genes correctly using intelligent techniques and optimizes the result.
To cluster the unknown genes and optimize cluster compactness and separation simultaneously for each chromosome.
II.
RELATED WORKIn previous work, due to the presence of large number of genes and high com-plexity of biological networks, there is a great need to develop analytical method-ology to analyze and to exploit the information captured by gene expression data. In the pattern layer of Backpropagation Neural Network(BPNN) model, due to the presence of redundant nodes the computational complexity of the network in-creases and so does the computational cost. The performance of Back-propagation training algorithm applied to a feedforward multilayer neural network and its per-formance depend on the activation function and error-correction rule [6]. Feature extraction of microarray genes has a greater impact on its classification and clus-tering as it is taken as input to any network. The use of gene expression data in discriminating two types of very similar cancers acute myeloid leukemia (AML) and acute lymphoblastic leukemia (ALL) presented in [7]. Classification results are reported in [2] using methods other than neural networks. Here, we explore the role of the feature vector in classification. To achieve the best performance with a learning algorithm on a particular training set, a feature subset selection method should be applied. PCA is an orthogonal transformation of
the coordinate system in which the data are represented. The new transformed coordinate values by which data are represented are called principal components [8].
Principal component analysis has been applied to analyze gene expression data and to improve cluster quality are studied in [9]. The diagnosis of multiple com-mon adult malignancies could be achieved purely by molecular classification, this is done by using Support vector machine algorithm [10]. Support Vector Machines (SVMs) are a popular machine learning method for classification, regres-sion, and other learning tasks are presented in [11]. A class discovery procedure automatically discovered the distinction between acute myeloid leukemia (AML) and acute lymphoblastic leukemia (ALL) without previous knowledge of these classes. An automatically derived class predictor was able to determine the class of new leukemia cases are presented in [2]. One particular machine learning al-gorithm, Support Vector Machines (SVMs), has shown promise in a variety of biological classification tasks, including gene expression microarrays are presented in [10], [12]. SVM method and one of its improved version CSVM as the classifi-er gave a better result using gene expression data [13]. The selection of a small subset of genes out of the thousands of genes in microarray data is important for accurate classification of phenotypes are presented in [14]. Multiobjective genetic algorithms gives fast nondominated sorting approach NSGA-II. In this paper we investigate the Goldberg's notion of non dominated sorting in GA's along with niche and speciation method to nd multiple pareto optimal points simultane-ously [15].
tumor gene expression for Multiclass cancer diagnosis [10].
From the related works it has been concluded that Feature extraction for the microarray cancer data is important for classification and clustering. To reduce features from data is important to increase the efficiencyof the network, hence a principal component analysis is used for feature reduction. In various paper it has shown that SVM has A greater efficiency in performance of classification as it has various parameter to regularize. Multiobjective genetic algorithms is used to obtain non- dominated solutions .
III.
BACK PROPAGATION NEURAL NETWORKS
CLASSIFIERSIn multilayered feedforward network, neurons are organized into layers. The in-put layer is composed not of full neurons, but rather consists simply of the values in a data record, that constitutes inputs to the next layer of neurons. The next layer is called a hidden layer; there may be many hidden nodes. The nal layer is the output layer, where there is one node for each class. A single forward pass through the network results in the assignment of a value to each output node, and the record is assigned to whichever classifications node had the highest value. Mul-tilayer feedforward networks are trained using the Backpropagation (BP) learning algorithm. Backpropagation training algorithm when applied to a feed-forward multilayer neural network is known as Backpropagation neural network. Func-tional signals ows in forward direction and error signals propagate in backward direction. That's why it is Error Backpropagation or shortly backpropagation network. The activation function that can be di erentiated (such as sigmoidal activation function) is chosen for hidden and output layer computational neurons. The algorithm is based on an error - correction rule. Learning is based upon mean squared error and
generalized delta rule. The rule applied for weight updation is generalized delta rule [18], [6]
1. Initialization of weights (w) and biases (b) to random small values and target (t) is fixed. 2. Forward computation: Output of each layer
is y = (wx b). Where w = synaptic weight, x = input and b = bias value. Output of input layer is the input of hidden layer. In this way actual output is calculated.
3. Error is calculated by the difference of target and the actual output at output layer of neuron. Error e = t y.
4. Backward computation in NN: Each layer error is calculated by partial differentiation. For output layer error, e0 = 0:5 (d (hidden) =dy (hidden)) e and For hidden layer error, eh = (d (Yinput) =dYinput) w0ut e0.
5. Weights and biases in each layer are updated according to the computed errors. Updated weight, wnew = wold lr elayer xlayer layer. Updated bias, bnew = bold lr elayer layer where elayer is the error of the particular layer and xlayer is the input that is fed to the layer and lr is the learning rate.
6. Step 2 to 5 is repeated until the acceptable minimized error.
IV.
BP NEURAL NETWORK CLASSIFIER HYBRID
WITH PCA ALGORITHMAlthough back propagation is the most popular learning method in the neural network community, the drawbacks of it are often pointed out are:
1. Very slow computing speed
2. The possibility of getting trapped in local minima.
3. More hidden nodes lead to overwriting and greater capacity of assimilating data.
4. The convergence obtained from backpropagation learning is very slow.
5. The convergence in backpropagation learning is not guaranteed.
A. Why SVM for cancer classification
SVMs are used for cancer classification mainly due to following two reasons:
1. SVMs have demonstrated the ability not only to correctly separate the entities into appropriate classes, but also to identify instances whose established classification is not supports by the data.
2. SVM have many mathematical features that make them attractive for gene expression analysis, including their exibility in choosing a similarity function, sparseness of solution when dealing with the huge data sets, the capacity to hold that huge feature spaces, and the capacity to classify outliers.
B. The SVM Classifier and Kernel Selection
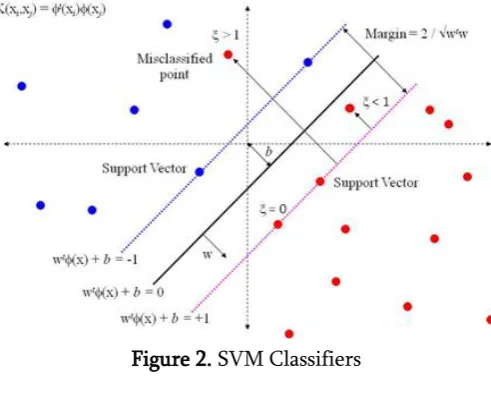
A support vector machine (SVM) [19] is a computer techniques used for the supervised learning process is to analyze and recognize patterns, are derived from statistical learning theory developed by Vladimir N. Vapnik and Corinna Cortes in 1995. The goal of SVM is to produce a model (based on the training set) which predicts the target values of the test set making it as non-probabilistic linear classifiers. Viewing the input data as two sets of vectors in a d-dimensional space, an SVM constructs a separating hyperplane in
that space, which maximizes the margin between the two classes of points. Instinctively, a superior partition is attained by the hyperplane that has the biggest distance to the neighboring data points of both classes. Larger margin or distance between these parallel hyperplanes indicates better generalization error of the classifier [19]. Implies that only support vectors machine matters and other training examples are ignorable.
The SVM is designed for binary-classification problems, assuming the data are linearly separable. Given the training data (xi; yi); i = 1; 2::::m; xi Rn; yi f+1; 1gt where, Rn : is the input space,
Figure 2. SVM Classifiers
V.
PROPOSED WORKAfter the data set is normalized using the following equation, PCA is then implemented for reducing the high dimensional DNA microarray data. On the reduced data set feed forward neural network and SVM are implemented and their performance accuracies are compared.
A. Data Preprocessing and Cleaning
B. Data Normalization
Data normalization is followed after data preprocessing and cleaning. Data normalization is essential to the performance of classifiers. We use Z-min-max normalization method. It transforms the data into the desired range [0, 1].
Xnorm = (Xm n min) = (max min)
Xnorm is the result of the normalization, xm n is the feature (gene) to be normalized, max is upper bound of the gene expression value, and min is lower bound of the gene expression value.
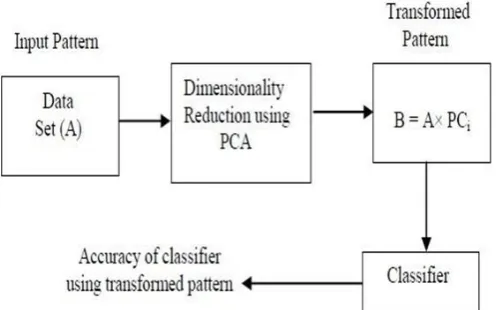
SVM and BPNN often does not gives better accuracy for high dimension, to improve the efficiency, we proposed to apply Principal component analysis on the original data set, to obtain a reduced dataset containing possibly uncorrelated variables without any loss [5], [18]. Then the reduced data set will be applied to SVM and BPNN classifier to improve performance of the classifiers.
Our first contribution is to prove that PCA is able to reduce dimension of features and to provide classification competitive performance than traditional classifiers in terms of speed and predictive accuracy, and precision of convergence [20].
Hybrid approach is being proposed for reduction of features and structure modeling of classifiers using PCA [16], [17]. After the implementation of PCA, two classifiers such as Feed Forward Neural Network (FFNN) trained using BP algorithm and SVM [19] are implemented. The general procedure of the algorithm explained in the Fig 2: the brief overview of our entire proposed process is shown below in Fig 3:
Figure 3. PCA-SVM or PCA-BPNN classifiers for cancer data
The entire data set of all 72 experiments was first Normalized (step 1) and then the dimensionality was further reduced by principal component analysis (PCA) to 34 PCA projections, (2) from the original 7129 expression values. Next, the 34 test experiments were set aside (6) and the 38 training experiments were randomly partitioned into 3 groups from reduced matrix (5). One of these groups was reserved for validation and the remaining 2 groups for training (7). BPNN/SVM models were then trained using for each sample the 34 PCA values as input and the cancer category as output (9). The samples were again randomly partitioned and the entire training process repeated (10). The 34 test experiments were subsequently classified using all the trained models. The entire process (5-10) was repeated.
Figure 4. Schematic illustration of the proposed method for Leukemia cancer data
VI.
IMPLEMENTATION
The simulation process is carried on a machine having Intel(R) core (TM) 2 Duo processor 3.0 GHz and 3 GB of RAM. The MATLAB version used is R2012 (a). This was taken out with 3 microarray cancer data sets.
A. Data Sets
Data Set 1: Leukemia cancer
Number of Instances: 72 (consist of 2 classes for distinguishing: Acute Myeloid Leukemia (AML) and Acute Lymphoblastic Leukemia (ALL). The complete dataset contains 25 AML and 47 ALL samples. 38 samples for training set and 34 samples for test set are chosen for simulation).
Number of Attributes: 7129
Resultant data set (after PCA): 72x34.
The data sets taken from public Kent Ridge Biomedical Data Repository with URL: http://sdmc.lit.org.sg/GEDatasets/Datasets.html. or following
URL:
http://www.inf.ed.ac.uk/teaching/courses/dme/html/d atasets0405.html.
Data Set 2: Ovarian cancer
Number of Instances: 216 (consist of 2 classes for distinctive: Cancer and Normal. The complete dataset contains 121 ovarian cancer and 95 normal cancer samples. 119 samples for training set and 97 samples for test set are chosen for simulation).
Number of Attributes: 4000.
Resultant data set (after PCA): 216x28.
The data set taken from public Kent Ridge
Biomedical Data Repository with the url followed as,
URL: http://
sdmc.lit.org.sg/GEDatasets/Datasets.html. Data Set 3: Colon cancer
Number of Instances: 62 (consist of 2 classes for distinguishing: cancer biopsies and normal biopsies. The samples consist of 36 cancer biopsies collected from cancer data, and 27 normal biopsies collected from healthy part of the colons of the same patient.)
Number of Attributes: 2000.
Resultant data set (after PCA): 62x12.
The data sets taken from
http://microarray.princeton.edu/oncolog.
B. Input Parameters
BPNN Parameters: Number of nodes in hidden layer=3, learning rate=0.2, Number of iterations=1000.
SVM Parameters: C = 2, k= 8, d = 3.
The parameters that should be optimized include penalty parameter C and the kernel function parameters such as the (gamma) and d for the radial basis function (RBF) kernel. Generally d is set to be 2. Thus the kernel value is related to the Euclidean distance between the two samples is related to the kernel width. Correct parameters setting can develop the SVM classification accurateness.
C. Performance Measures
The measure used to evaluate the performance of classifiers:
Accuracy = (correctly classified instances) / (Total no. of instances) *100%
1. Accuracy =(TP+TN) / (TP+FP+TN+FN) 2. Sensitivity = (TP/TP+FN)*100% 3. Specificity = (TN/ TN+FP) * 100%
Where, TP = true positive, TN = true negative FP = false positive, FN = false negative.
VII.
NUMERICAL SIMULATION, RESULTS AND DISCUSSIONInitially simulation was carried out considering the original features and BPNN and SVM classifiers. This classification approach is validated by considering three other data sets i.e. Leukemia cancer, ovarian cancer and colon cancer data.
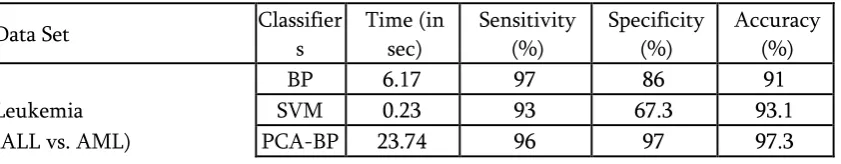
The correctness attained with usual BPNN and SVM were 91% and 93.1% taking Leukemia cancer and 87.1% and 96.2% taking ovarian cancer and 56.7% and 90.03% taking Colon cancer data respectively showing in Table 2 and Table 3.
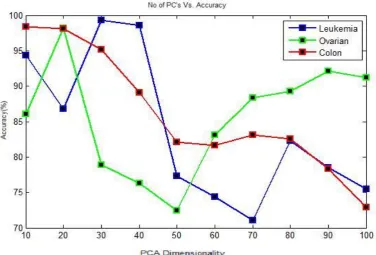
After the implementation of PCA, the data distribution across the first three principal components (PC's) and first two principal components (PC's) are shown below in Fig 5 for Leukemia cancer data set, Fig 6 for Ovarian cancer data set. The classification accuracy varying with number of principal components (PC's) are showing in Table 1. The Accuracy vs. graph is plotted for the principal component which has shown the maximum accuracy in Figure 7. The accuracy obtained with traditional BPNN and SVM were showing in Table 3. The data distribution across the first two features is shown in Figure 7.
(a) 3D representation (b) 2D representation
Figure 5. 3D and 2D Schematic representation of data across first three PC's and two PC's (Leukemia Cancer
data set)
(a) 3D representation (b) 2D representation Figure 6. 3D and 2D Schematic representation of data
across first three PC's and two PC's (Ovarian Cancer data set)
classification results. In Ovarian cancer Latents reduced from 4000 to 28(i.e. reduced by 82%) and Colon cancer from 2000 to 12 Latents (i.e. reduced by 86.05%) are reduced. Considering the reduced features, the accuracy obtained with PCA-BPNN and
PCA-SVM were 97.3% and 98.08% for leukemia cancer and 96.2% and 98.09% for ovarian data set and 95.02% and 97.04% for Colon cancer data set respectively.
Table 1. Accuracy Vs. No. Of Pc's Using Pca-Svm (Leukemia Cancer Data Set)
No of PC's Accuracy (%)
10 86.03
20 89.04
30 98.03
40 98.08
50 97.12
60 97.23
70 88.23
80 90.03
90 94.08
100 98.04
Figure 8. 2D Schematic representation of data across first two features (Leukemia data set) Table 2. CLASSIFICATION RESULTS: SVM KERNELS
Data Set
Classifier s
Time (in sec)
Sensitivity (%)
Specificity (%)
Accuracy (%)
Linear 0.1548 100 93.33 96.08
Leukemia
Polynom
ial 0.0696 100 83.33 87.08
(ALL vs. AML)
RBF 0.1548 100 93.3 98.08
Sigmoid 0.0580 58.9 76.2 58.82
Linear 0.1976 98.3 100 84.02
Ovarian
Polynom
ial 0.1793 98.3 100 98.04
(Cancer Vs. Normal)
RBF 0.0976 80 64.1 74.02
Sigmoid 0.2818 34.4 76.9 59
Linear 0.0956 98.3 100 84.02
Colon
Polynom
ial 0.0451 97.03 98 99.02
(Tumor biopsies Vs. Normal biopsies)
RBF 0.1146 85.2 94.4 84.8
Sigmoid 0.2318 34.4 66.9 69
Table 3. CLASSIFICATION RESULTS: TRADITIONAL BP, SVM, PCA-BP, AND PCA-SVM
Data Set Classifier
s
Time (in sec)
Sensitivity (%)
Specificity (%)
Accuracy (%)
BP 6.17 97 86 91
Leukemia SVM 0.23 93 67.3 93.1
PCA-SVM 0.1548 100 93.3 98.08
BP 20.02 98 88.2 87.1
Ovarian SVM 9.45 68 81 96.2
(Cancer Vs. Normal) PCA-BP 20.02 98 98.2 96.2
PCA-SVM 0.0976 98.3 100 98.09
BP 20.02 48 58.2 56.7
Colon SVM 9.45 88 81 90.03
(Tumor biopsies Vs. Normal
biopsies) PCA-BP 20.02 92.2 88.2 95.02
PCA-SVM 0.0451 97.3 98 97.04
VIII.
CONCLUSION AND FUTURE
ENHANCEMENTS
Classification and Clustering of Bioinformatics data play a vital role in detec-tion of cause of diseases. In this report BPNN, SVM, PCA-SVM and PCA-BP techniques are implemented for clasi cation and BPNN, SVM, MOGA-SVM and MOGA-BP are implemented for classification and clustering both. PCA-BP learn-ing algorithm is designed to reduce network error between the actual output and the desired output of the network in a gradient descent manner for classification. It was observed that PCA-SVM gives maximum accuracy. If the data are concen-trated over a particular linear subspace, PCA provides a technique to compress data and simplify the representation without losing much information. But if the data are concentrated over a non-linear subspace, PCA fails to work well. We pro-pose a novel method for obtaining a nal solution from the set of non-dominated solutions produced by NSGA-II based real-coded multiobjective fuzzy clustering scheme, that optimizes two tness functions i.e., fuzzy compactness ` ' and fuzzy seperation `sep' simultaneously successfully. Results on microarray cancer datasets have been demonstrated and statistical superiority has been established through statistical signifi cance test in terms of accuracy, speci city, sensitivity for clas-si cation and Silhouette Index and
ARI Index for clustering. The experimental results show that the MOGA-SVM approach is more effectiveby comparing it to MOGA-BP, PCA-SVM, PCA-BP, SVM, and BP methods for clustering and classification. As a scope of further research, performance of other popular clas-si ers combined with differentMOGA techniques, have to be tested and different parameters, various operators may be considered for higher efficiency.
IX.
REFERENCES
[1]. M.J. Heller. Dna microarray technology: devices, systems, and applications. Annual review of biomedical engineering, 4(1):129{153, 2002.
[2]. T.R. Golub, D.K. Slonim, P. Tamayo, C. Huard, M. Gaasenbeek, J.P. Mesirov, H. Coller, M.L. Loh, J.R. Downing, M.A. Caligiuri, et al. Molecular classification of cancer: class discovery and class prediction by gene expression monitoring. science, 286(5439):531{537, 1999.
[4]. J Valente De Oliveira, Witold Pedrycz, et al. Advances in fuzzy clustering and its applications. Wiley Online Library, 2007.
[5]. Guoqiang Peter Zhang. Neural networks for classification: a survey. Systems, Man, and Cybernetics, Part C: Applications and Reviews, IEEE Transactions on, 30(4):451{462, 2000. [6]. Andries P Engelbrecht. Computational
intelligence: an introduction. wiley, 2007. [7]. A. Toure and M. Basu. Application of neural
network to gene expression data for cancer classification. In Neural Networks, 2001. Proceedings. IJCNN'01. International Joint Conference on, volume 1, pages 583{587. IEEE, 2001.
[8]. S. Vipsita, B.K. Shee, and S.K. Rath. Protein superfamily classification using kernel principal component analysis and probabilistic neural networks. In India Conference (INDICON), 2011 Annual IEEE, pages 1{6. IEEE, 2011. [9]. K.Y. Yeung and W.L. Ruzzo. An empirical study
on principal component analysis for clustering gene expression data. Technical report, Technical re-port, Department of Computer Science and Engineering, University of Wash-ington, 2000.
[10]. S. Ramaswamy, P. Tamayo, R. Rifkin, S. Mukherjee, C.H. Yeang, M. Angelo, C. Ladd, M. Reich, E. Latulippe, J.P. Mesirov, et al. Multiclass cancer diagnosis using tumor gene expression signatures. Proceedings of the National Academy of Sciences, 98(26):15149{15154, 2001.
[11]. C.C. Chang and C.J. Lin. Libsvm: a library for support vector machines. ACM Transactions on Intelligent Systems and Technology (TIST), 2(3):27, 2011.
[12]. Nello Cristianini and John Shawe-Taylor. An introduction to support vectormachines and other kernel-based learning methods. Cambridge university press, 2000.
[13]. X. Zhang and H. Ke. All/aml cancer classification by gene expression data using svm and csvm approach. GENOME INFORMATICS SERIES, pages 237{239, 2000.
[14]. C. Ding and H. Peng. Minimum redundancy feature selection from microarray gene expression data. Journal of bioinformatics and computational biology, 3(02):185{205, 2005. [15]. Kalyanmoy Deb. Multi-objective optimization.
Multi-objective optimization using evolutionary algorithms, pages 13{46, 2001.
[16]. Imola K Fodor. A survey of dimension reduction techniques, 2002.
[17]. I. Jolli e. Principal component analysis. Wiley Online Library, 2005.
[18]. D.E. Rumelhart, G.E. Hintont, and R.J. Williams. Learning representations by back-propagating errors. Nature, 323(6088):533{536, 1986.
[19]. V. Vapnik. The nature of statistical learning theory. springer, 1999.
[20]. J. Shlens. A tutorial on principal component analysis. Systems Neurobiology Laboratory, University of California at San Diego, 2005. [21]. David E Goldberg. Genetic algorithms in search,
optimization, and machine learning. 1989. [22]. L Davis. 1991, handbook of genetic algorithms,
van nostrand reinhold, new york.
[23]. Ujjwal Maulik and Sanghamitra Bandyopadhyay. Genetic algorithm-based clustering technique. Pattern recognition, 33(9):1455{1465, 2000.
[24]. Ujjwal Maulik and Sanghamitra Bandyopadhyay. Fuzzy partitioning using a real-coded variable-length genetic algorithm for pixel classification. Geo-science and Remote Sensing, IEEE Transactions on, 41(5):1075{1081, 2003.
[26]. Eckart Zitzler, Marco Laumanns, Lothar Thiele, Eckart Zitzler, Eckart Zit-zler, Lothar Thiele, and Lothar Thiele. Spea2: Improving the strength pareto evolutionary algorithm, 2001. [27]. Chankong Vira and Yacov Y Haimes.
Multiobjective decision making: theory and methodology. Number 8. North-Holland, 1983. [28]. Kalyanmoy Deb, Amrit Pratap, Sameer Agarwal,
and TAMT Meyarivan. A fast and elitist multiobjective genetic algorithm: Nsga-ii. Evolutionary Computation, IEEE Transactions on, 6(2):182{197, 2002.
[29]. George E Tsekouras, Dimitris Papageorgiou, Sotiris Kotsiantis, Christos Kalloniatis, and Panagiotis Pintelas. Fuzzy clustering of categorical attributes and its use in analyzing cultural data. International Journal of Computational Intelligence, 1(2):147{151, 2004. [30]. Zhexue Huang and Michael K Ng. A fuzzy
k-modes algorithm for clustering categorical data. Fuzzy Systems, IEEE Transactions on, 7(4):446{452, 1999.
[31]. Ram Bhusan Agrawal, Kalyanmoy Deb, and Ram Bhushan Agrawal. Simu-lated binary crossover for continuous search space. 1994. [32]. MM Raghuwanshi and OG Kakde. Survey on
multiobjective evolutionary and real coded genetic algorithms. In Proceedings of the 8th Asia Paci c symposium on intelligent and evolutionary systems, pages 150{161, 2004. [33]. Peter J Rousseeuw. Silhouettes: a graphical aid
to the interpretation and vali-dation of cluster analysis. Journal of computational and applied mathematics, 20:53{65, 1987.
[34]. Lawrence Hubert and Phipps Arabie. Comparing partitions. Journal of clas-si cation, 2(1):193{218, 1985.
[35]. Sanghamitra Bandyopadhyay, Sriparna Saha,
Ujjwal Maulik, and Kalyanmoy Deb. A simulated annealing-based multiobjective optimization algorithm: Amosa. Evolutionary