Physics and Astronomy Publications
Physics and Astronomy
2-1997
Optical properties and electronic structures of
Ni3Al alloys
Joo Yull Rhee
Hoseo UniversityDavid W. Lynch
Iowa State University, [email protected]
Bruce N. Harmon
Iowa State University, [email protected]
Follow this and additional works at:
http://lib.dr.iastate.edu/physastro_pubs
Part of the
Atomic, Molecular and Optical Physics Commons
, and the
Condensed Matter
Physics Commons
The complete bibliographic information for this item can be found athttp://lib.dr.iastate.edu/physastro_pubs/106. For information on how to cite this item, please visithttp://lib.dr.iastate.edu/howtocite.html.
Optical properties and electronic structures of Ni3Al alloys
Abstract
The dielectric functions of Ni3Al polycrystalline alloys were measured by spectroscopic ellipsometry in the
energy range of 1.5–5.4 eV. The samples were Ni1−xAlx alloys with x=0.2625,0.2525,0.25,0.244, and 0.2359.
One broad peak was observed in the optical-conductivity spectra around 4.4 eV. The band structures and the
optical conductivity were calculated in the Au3Cu structure with the linearized-augmented-plane-wave
method. By including both energy-dependent broadening and an approximate self-energy correction the
calculated optical-conductivity spectrum gives quite good agreement with experiment. The calculation shows
that the main contribution to the 4.4 eV peak comes from the k points close to the Γ-M-R plane and near the
midpoints of the X-M line and Γ-M line.
Keywords
Ames Laboratory, polycrystalline, spectroscopic ellipsometry
Disciplines
Atomic, Molecular and Optical Physics | Condensed Matter Physics | Physics
Comments
This article is from
Physical Review B
55 (1997): 4124, doi:
10.1103/PhysRevB.55.4124
. Posted with
permission.
ARTICLES
Optical properties and electronic structures of Ni
3Al alloys
Joo Yull Rhee
Department of Physics, College of Natural Sciences, Hoseo University, Asan, 336-795 Choongnam, Korea
B. N. Harmon and D. W. Lynch
Ames Laboratory-U.S. Department of Energy and Department of Physics and Astronomy, Iowa State University, Ames, Iowa 50011 ~Received 10 July 1995; revised manuscript received 2 August 1996!
The dielectric functions of Ni3Al polycrystalline alloys were measured by spectroscopic ellipsometry in the
energy range of 1.5–5.4 eV. The samples were Ni12xAlx alloys with x50.2625,0.2525,0.25,0.244, and 0.2359. One broad peak was observed in the optical-conductivity spectra around 4.4 eV. The band structures and the optical conductivity were calculated in the Au3Cu structure with the linearized-augmented-plane-wave
method. By including both energy-dependent broadening and an approximate self-energy correction the cal-culated optical-conductivity spectrum gives quite good agreement with experiment. The calculation shows that the main contribution to the 4.4 eV peak comes from the k points close to the G-M -R plane and near the midpoints of the X-M line andG-M line.@S0163-1829~97!03008-7#
Ni12xAlx intermetallic compounds have received
consid-erable attention because of their unusual physical properties. It forms very stable B2 phase ~cubic CsCl structure! with 0.4<x<0.55 and undergoes martensitic transformation from
B2 phase to face-centered-tetragonal phase for x near 0.38.1
The Ni3Al compounds exhibit weak itinerant
ferromag-netism with Tc541 K and strong exchange-enhanced
para-magnetic properties for 73.5–74.5 at. % Ni concentrations.2 Dhar et al.3,4 measured the heat capacity of Ni3Al alloys under the influence of magnetic fields in the 1.5–20 K range and found an upturn in C/T-versus-T2plots in the low
tem-perature region. They interpreted the upturn as an indication of the enhancement of the effective electronic mass due to spin fluctuations.
The energy band structures of Ni3Al were calculated
sev-eral times to understand the magnetic properties of the alloys.5,6,8–10Hackenbracht and Ku¨bler5calculated the para-magnetic band structures of Ni3Al, NiAl, and NiAl3and the
spin-polarized band structure for Ni3Al using the
augmented-spherical-wave ~ASW! method. Using the local-density approximation for the paramagnetic calculations and the local spin density approximation for the spin-polarized calculation, they calculated various physical quantities such as the density of states, the magnetic moment and its pres-sure derivative, lattice constants, bulk modulus, and heats of formation. Their calculated magnetic moment of Ni3Al is
m50.092mB per unit cell, which is only 40% of the
experi-mental value.11Later Buiting, Ku¨bler, and Mueller6used the same method to derive a high-precision density of states of Ni3Al. By comparing the calculated specific heat with the
experiment they concluded that Ni3Al was still in the
fluc-tuation regime even though it is in a ferromagnetic state. They found that the magnetic moment almost vanishes at the experimental lattice constant ~3.568 Å56.743 a.u.!while it
is 0.203mB per unit cell, which is close to the experimental
value of 0.23mB per unit cell,11at a lattice constant of 3.583 Å~56.771 a.u.!.
Min, Freeman, and Jansen8 used the self-consistent full-potential linearized-augmented-plane-wave~LAPW!method to investigate the electronic structure and magnetic proper-ties of Ni3Al. They performed both paramagnetic and spin-polarized calculations. The energy of the ferromagnetic state is slightly (;1 mRy! lower than the paramagnetic state at the experimental lattice constant. The calculated magnetic moment was 0.15mB per Ni atom and the total moment was
0.44mB per cell. Although the calculated total moment was
twice as large as observed, the authors argued that the spin-orbit interaction might reduce the calculated magnetic mo-ment to 0.26mB per cell, since the spin-orbit interaction
re-duced the exchange splitting by ;40%. Xu et al.9 studied the structural stability of Ni3Al using an all-electron
self-consistent local-density linear-muffin-tin-orbital ~LMTO! method for different crystal structures and for different phases; cubic (L12), tetragonal (D022), and hexagonal
(D019). They found that the ~weakly! ferromagnetic cubic structure is the most stable phase. Their calculated magnetic moment ~0.71mB per cell!was even larger than that of Ref.
8, however, they found that it was reduced remarkably to 0.46mB per cell if the spin-orbit interaction was included. In
this paper we are concerned with room temperature optical experiments and our calculations are therefore for the para-magnetic state. Since two states, one above the Fermi level and one below the Fermi level, are involved in the optical transitions, the measurements in optical properties can give us more information about the electronic structures of the alloys.
Khan et al.10 used the self-consistent LMTO method within the atomic sphere approximation to calculate the band structure and the optical conductivity. They calculated the
PHYSICAL REVIEW B VOLUME 55, NUMBER 7 15 FEBRUARY 1997-I
55
optical-conductivity spectra with and without the inclusion of the dipole-transition-matrix elements and found that the inclusion of the matrix elements is very crucial to make the calculated spectra coincide with the measured one. They also suggested that broadening and self-energy corrections may improve the agreement between the experiment and the theory.
The dielectric function of Ni3Al was measured by
spec-troscopic ellipsometry in the 0.5–5.3 eV region by van der Heide et al.12 The optical-conductivity spectrum showed a weak shoulder at 0.86 eV and a broad, pronounced peak at 4.32 eV. The authors claimed that the experimental results are in good agreement with the theory in which they calcu-lated the spectrum using the band structure of Ref. 6 without inclusion of the dipole-transition-matrix elements.
In this work we report experimental and theoretical results of the optical-conductivity spectra of Ni3Al alloys. The
mea-sured optical conductivity is almost 50% larger than that of Ref. 12 in the 1.5–5.4 eV range. In the course of the optical-conductivity calculation we included the dipole-transition-matrix elements. After the theoretical optical-conductivity spectrum was obtained an energy-dependent broadening was applied. The broadened spectrum was further fitted to the experimental one usingl-fitting procedure~see text below!. The l fitting, which is originated from a simplified attempt to account for the self-energy correction to the excited states,7 is particularly important because it markedly im-proves the agreement between the experimentally and theo-retically determined peak positions. The calculated optical-conductivity spectrum before broadening and after applying the l fitting is very similar to that of Ref. 10, however, our interpretation differs.
The samples were those of Refs. 3 and 4. They were mechanically polished with a series of alumina powders down to 0.05 mm diameter. The samples were then cleaned using acetone and methanol in an ultrasonic cleaner. We measured the dielectric functions using a spectroscopic rotating-analyzer ellipsometer13at room temperature. We did not put the sample in the vacuum chamber. Therefore the sample surface was covered by an oxide film whose maxi-mum thickness ;50 Å might cause errors in measurement up to about 1%.12
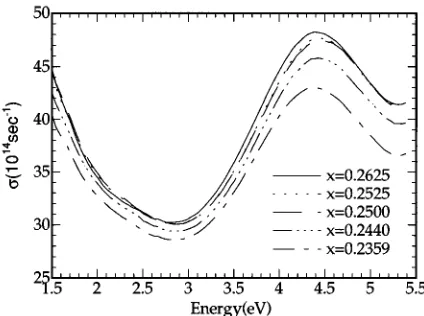
[image:4.612.69.281.60.218.2]The measured optical-conductivity spectra are shown in
Fig. 1. The overall shape of spectrum and the position of the broad peak at 4.4 eV are in good agreement with the previ-ous measurement of Ref. 12. However, there is a large dif-ference in the magnitude of the optical conductivity. Our measurement is almost 50% larger than that of Ref. 12. The difference is probably due to the surface roughness of the sample. In Ref. 12 the authors used 1 mm diam diamond powder, which is significantly larger than our final grade of alumina powder ~0.05 mm!. The large diameter of the pol-ishing powder makes the sample surface rougher and the surface roughness of the sample is approximately the same order of the final grade of the polishing powder. In addition, diamond powder is harder and therefore can severely damage the sample surface more than alumina. The rougher the sample surface the smaller the reflectivity and, in turn, the smaller the optical conductivity. To check this point we ap-plied the three-phase model to simulate the spectrum of Ref. 12 in which the rough overlayer was modeled as a mixture of void and bulk material with a void fraction fv and thick-ness d. We used the Bruggeman effective medium approximation14to obtain the dielectric function of the over-layer. For the dielectric function of the bulk we used our experimental data. If fvis small the dielectric function of the overlayer is given by15
e
˜o.˜e
S
123 fve ˜21
2˜e21
D
, ~1!where˜eo and˜ are the dielectric functions of the overlayere
and the bulk, respectively. fv50.14 and d5 926 Å give a spectrum very close to that of Ref. 12. Although they mea-sured the dielectric functions in an UHV chamber, the effect of a rough surface, about 900 Å thick, is larger than that of the oxide overlayer 50 Å thick.12
We also observed the broad and pronounced peak at 4.4 eV but could not observe the weak shoulder at 0.86 eV be-cause it is outside the spectral limit of our measurement sys-tem.
To determine the origin of the 4.4 eV peak we performed band structure and optical-conductivity calculations for the paramagnetic phase using the LAPW method16in the local-density approximation.17 The lattice constant was 3.568 Å
~56.7425 a.u.! and the muffin-tin radii were 1.231 Å
~52.3265 a.u.! and 1.270 Å~52.400 a.u.! for Al and Ni, respectively. A muffin-tin potential was used. The calculated energy band structure along high-symmetry lines is shown in Fig. 2. The band structure and the density of states are simi-lar to those obtained in previous calculations.5,6,8,9The only notable difference in the band structures between ours and that of Ref. 12 and Ref. 8 is the energy location of the 16th band at the R point and the shape of this band along the
M -R-X direction. In Ref. 8 it is located only 0.1 eV below
the Fermi level EF, and has a local maximum at the R point,
while in Ref. 12 and our work it is located 0.5 eV below
EF and has a local minimum at the R point along the
M -R-X direction, but has a local maximum near the R point
along the R-X direction.
The band structure of Ref. 10 is different from ours and that of Ref. 12 at a few points. First, there are missing bands such as the 13th band in theGpoint and the 16th bands at the
X, M , and R points if they are compared to our and the FIG. 1. Optical conductivities of Ni12xAlxalloys. Note that the
zero of the optical conductivity is suppressed.
other band structures.8,12 Second, the splitting between the 16th and 17th bands at one third of G-X direction is rather large, while our calculation shows almost no splitting. In Ref. 10 it is not clear that the calculation includes spin-orbit coupling, while we included the spin-orbit coupling during the self-consistent calculation. This may explain why the 17th, 18th, and 19th band at the R point do not split in Ref. 10 while they do in our calculation. In Ref. 12 and Ref. 8~no spin-orbit coupling!these bands are not split and are occu-pied. In our calculation the 17th band is split from the 18th and the 19th bands and the 17th band is occupied. Third, the 17th band is unoccupied all along the R-X direction in Ref. 10, however, a fairly large portion of the 17th band in the
R-X direction is occupied for our case and others.8,12
In Ref. 12 the authors compared the experimental spec-trum to the theoretical one by using the band structure cal-culation of Ref. 6, and they did not include the dipole-transition matrix elements, in other words, they evaluated just the joint density of states divided by the angular fre-quency of the incident photon (JDOS/v). The calculated
JDOS/v spectrum shows two peaks~at 3.4 eV and 3.9 eV!
close to the experimental peak at 4.4 eV and the authors assigned these peaks as the origin of the experimental one even though their energies are smaller than the experimental one. They also identified the peaks as transitions from bands 3, 4, 5, and 6 to bands 14, 15, and 16 in the neighborhood of the G point. However, the inclusion of the dipole-transition matrix elements is essential for optical-conductivity calcula-tions and frequently gives completely different results from a
JDOS/v analysis. Indeed our results and those of Ref. 10,
which included the dipole-transition matrix elements in the optical-conductivity calculation, show significantly different spectra and thus our interpretation is different from that given in Ref. 12.
As we see in Fig. 3, the shape of the calculated optical-conductivity spectrum with the dipole-transition matrix ele-ments is very similar to that of Ref. 10. However, there is a discrepancy in the magnitudes. In Ref. 10 the calculated
spectrum~see Fig. 4 of Ref. 10!shows that the magnitude of the 6.0 eV peak is;2.931015 sec21, which is close to the magnitude of the 4.32 eV peak of Ref. 12 (;331015 sec21), while it is only 23 of our measurement.
Since the calculated spectrum shows sharp structures, which are not present in a real experiment because of lifetime ef-fects and the experimental spectral resolution, it should be broadened if theory is to have any chance to agree with ex-periment. Broadening reduces the magnitude of peaks and smears out many sharp structures. The calculated spectrum can be ‘‘adjusted’’ to the measured one in the peak position by al-fitting procedure~see Fig. 2!, however, it is very hard to match the magnitude if the theoretical result of Ref. 10 is used. Meanwhile our calculation is almost twice as large in magnitude as that of Ref. 10. Our calculation also shows some sharp peaks below 1 eV and broad peaks around 7.5 eV and 11 eV. These are missed or too weak to be discernible in the calculation of Ref. 10.
The calculated optical conductivity was broadened using an energy-dependent Lorentzian broadening function of width G(E)5AE2/eV, where E5@Ef(k)2Ei(k)# in eV, to
simulate the imaginary part of the quasiparticle self-energy. We set the upper limit ofG(E)max52 eV for agreement
be-FIG. 2. Band structure of Ni3Al in the Au3Cu structure along
[image:5.612.330.546.60.221.2]high-symmetry lines. The optical direct interband transitions corre-sponding to the 1 eV and 4.4 eV peaks are denoted by the short arrows and long arrows, respectively.
FIG. 3. Theoretical optical conductivity of Ni3Al before
broad-ening.
FIG. 4. Experimental~solid line!and theoretical optical conduc-tivities of Ni3Al. The theoretical ones are calculated with~dashed
line!and without~dotted line!thel fitting after broadening.
[image:5.612.62.294.60.251.2] [image:5.612.330.545.555.715.2]tween experiment and calculation. The broadened, calculated spectrum shows a broad peak around 5.5 eV which is higher in energy than the experimental one. To account for this discrepancy we used a l fitting which has the effect of changing the excited-state energies Eˆn(k) relative to the
en-ergies En(k) calculated from the ground-state potential, given by7
Eˆn~k!5En~k!1l@En~k!2EF#. ~2!
Although the parameter l is dependent on the band index
n and the wave vector k, we assumed it constant. Thus a
positive l has the effect of raising the energies of states above and lowering those below EF; and hence the peaks in
the ‘‘bare’’ excitation spectrum are shifted to higher energy. A negativel shifts bare peaks to lower energies. While we have written Eq.~2!as a self-energy correction to individual states ~following Ref. 7!, this is perhaps misleading, in that we are using a rather simplified correction which is being imposed for the purpose of fitting the excitation spectrum. It is really only concerned with the difference of the self-energy corrections ~for the initial and final states!. Thus a negativel is likely to arise from a large positive self-energy correction on the initial state and a small ~positive! correc-tion to the final state. This is indeed a highly simplified pro-cedure to avoid the very complicated task of evaluating in-dividual state self-energy corrections.
We can now calculate the corrected optical constants, however, three different forms of equations are given in the literature. In Ref. 7 the imaginary part of the dielectric func-tion is
eˆ
2~v!5
1 11le2
S
v
11l
D
~3!and in Ref. 18 the optical conductivity is
sˆ~v!5 1 ~11l!2s
S
v
11l
D
. ~4!Both formulas do not satisfy the sum rule
E
0`
s~v!dv5pne
2
2m , ~5!
where m, e, and n are the electronic mass, charge, and con-centration, respectively. In Ref. 19 the l-fitted optical con-ductivity is given by
sˆ~v!5 1
11ls
S
v
11l
D
, ~6!which satisfies the sum rule of Eq. ~5!. Therefore the de-nominator of the prefactor of right hand side of Eq. ~3! should be squared and that of Eq.~4!should not be squared. Both experimental and theoretical ~with and without the l fitting! spectra are shown in Fig. 4. The broadened optical-conductivity spectrum reproduces the shape of the experi-mental one, however, the magnitude and peak position do not match. With l520.18 the shape and the magnitude of the theoretical spectra agree fairly well with the experimental one. The absolute value of l is larger than those of CoAl (l520.15) ~Ref. 19!and Ni (l520.12).18
Before broadening and l fitting we did not include any adjustable or empirical parameters to make the theoretical spectrum coincide with the measured one. The broadening and l fitting are optimized to give a theoretical spectrum which agrees with the measured one in both the magnitude and the energy position of the 4.4 eV peak.
We have identified the band pair and tetrahedra ~regions in k space!which provide the dominant contributions to the various spectral features by keeping track of that information during the optical-conductivity calculations with appropriate energy windows ~defining the different spectral features!. The main contribution to the 4.4 eV peak~5.5 eV peak in the theory!arises from transitions initiating from band 3~50% of Ni d character and 50% of mixture of Ni and Al s p charac-ter!to k points of theG-M -R plane and the midpoints of the near X-M line and theG-M line to band 18~having a similar character to band 3!. The strong transitions are shown by long arrows in Fig. 2. Very small contributions come from the transitions from band 2 to band 16 located just above
EF at the k point near the G point. Overall there are only
small contributions from k points in the neighborhood of the
G point, unlike the conclusion of Ref. 12.
With the inclusion of the dipole-transition-matrix ele-ments we found large peaks around the 5.5 eV region, while there are two peaks at 3.4 and 3.9 eV in Ref. 12 where the dipole-transition-matrix elements are not included. Although the dipole-transition-matrix elements were included in the calculation of the optical-conductivity in Ref. 10, the authors assign the two peaks in their calculated optical conductivity spectrum to the same origin of k points as that of Ref. 12. The two peaks are not explicitly identified in Ref. 10, how-ever, we assume that they are the ones shown at 4.8 and 5.5 eV. The assignments are not correct for two reasons; first, the inclusion of the dipole-transition-matrix elements in the optical-conductivity calculation changes the peak positions in the optical spectra from the assignments of Ref. 12, and second, the energies of the two transitions listed do not agree with the peak positions of the calculated spectrum, e.g., we find;3.8 eV for the transitions from bands 3 and 4 to bands 14 and 15 near theG point and;3.23 eV for the transitions from bands 5 and 6 to bands 14 and 15 near the same sym-metry point.
In Ref. 12 there is a weak shoulder around 0.8 eV in the experimental spectrum. After broadening and l fitting our calculation shows a strong peak at 1 eV and we assign this peak to the shoulder around 0.8 eV. For this peak most of the strong transitions arise from k points near the M point, from band 9 ~mainly Ni d character!to bands 18 and 19~50% of Ni d character and 50% of mixture of Ni and Al s p charac-ter!, and 1/3 way of G-X line, from band 17 ~mainly Ni d character!to band 18.
In summary, we have measured the dielectric functions of Ni3Al alloys. Our measured optical conductivity is almost
50% larger than a previous measurement.12The discrepancy was hypothesized to be due to the rough overlayer of the previous sample. The rough overlayer was modeled as a mixture of void and bulk and the fitting results provide a plausible explanation for the difference in the two measure-ments. Band structure and optical-conductivity spectra were
calculated using the LAPW method. The calculated optical conductivity, with empirically adjusted real (l fitting! and imaginary~broadening!parts of the quasiparticle self-energy, exhibits good agreement with experiment. The origin of the main peak ~4.4 eV! of the optical-conductivity spectrum is transitions at the k points near the G-M -R plane and mid-points of the X-M line and theG-M line from band 3 to band
18; both bands are similar, with at least 50% Ni d characters, with the dipole transitions primarily from p-d matrix ele-ments on the Ni site.
We wish to thank Professor K. A. Gschneidner, Jr. for providing Ni3Al alloys. The Ames Laboratory is operated
for the U. S. Department of Energy by Iowa State University under Contract No. W-7405-Eng-82.
1Y. Noda, S. M. Shapiro, G. Shirane, Y. Yamada, and L. E.
Tan-ner, Phys. Rev. B 42, 10 397~1990!, and references therein.
2F. R. de Boer, C. J. Schinkel, J. Biesterbos, and S. Proost, J. Appl.
Phys. 40, 1049~1969!.
3S. K. Dhar and K. A. Gschneidner, Jr., Phys. Rev. B 39, 7453 ~1989!.
4S. K. Dhar, K. A. Gschneidner, Jr., L. L. Miller, and D. C.
Johnston, Phys. Rev. B 40, 11 488~1989!.
5D. Hackenbracht and J. Ku¨bler, J. Phys. F 10, 427~1980!. 6J. J. M. Buiting, J. Ku¨bler, and F. M. Mueller, J. Phys. F 13, L179
~1983!.
7B. I. Min, A. J. Freeman, and H. J. F. Jansen, Phys. Rev. B 37,
6757~1988!.
8J. Xu, B. I. Min, A. J. Freeman, and T. Oguchi, Phys. Rev. B 41,
5010~1990!.
9M. A. Khan, A. Kashyap, A. K. Solanki, T. Nautiyal, and S.
Auluck, Phys. Rev. B 48, 16 974~1993!.
10F. R. de Boer, J. J. M. Franse, and P. E. Brommer, Physica B1C 106B, 1~1981!.
11P. A. M. van der Heide, J. J. M. Buiting, L. M. ten Dam, L. W.
M. Schreurs, R. A. de Groot, and A. R. de Vroomen, J. Phys. F
15, 1195~1985!.
12
J. F. Janak, A. R. Williams, and V. L. Moruzzi, Phys. Rev. B 11, 1522~1975!.
13J. Y. Rhee, Ph.D. thesis, Iowa State University, 1992 ~
unpub-lished!, and references therein.
14D. A. G. Bruggeman, Ann. Phys.~Leipzig!24, 636~1935!. 15D. E. Aspnes, E. Kinsbron, and D. D. Bacon, Phys. Rev. B 21,
3291~1980!.
16D. D. Koelling and B. N. Harmon, J. Phys. C 10, 3170~1977!. 17L. Hedin and B. I. Lundqvist, J. Phys. C 4, 2064~1971!. 18D. G. Laurent, J. Callaway, and C. S. Wang, Phys. Rev. B 20,
1134~1979!.
19K. J. Kim, B. N. Harmon, and D. W. Lynch, Phys. Rev. B 43,
1948~1991!.