http://www.sciencepublishinggroup.com/j/am doi: 10.11648/j.am.20180702.15
ISSN: 2327-2503 (Print); ISSN: 2327-252X (Online)
Effect of Pressure on Solidification Process and
Mechanical Properties During Semi-Solid Casting by
Computational Fluid Dynamics (CFD)
Nguyen Hong Hai, Pham Quang
*Key Laboratory of Metal Materials Technology, Hanoi University of Science and Technology, Hanoi, Vietnam
Email address:
*
Corresponding author
To cite this article:
Nguyen Hong Hai, Pham Quang. Effect of Pressure on Solidification Process and Mechanical Properties During Semi-Solid Casting by Computational Fluid Dynamics (CFD). Advances in Materials. Vol. 7, No. 2, 2018, pp. 44-49. doi: 10.11648/j.am.20180702.15
Received: June 19, 2018; Accepted: July 3, 2018; Published: July 31, 2018
Abstract:
This paper focused on the development of Computational Fluid Dynamics (CFD) by a mathematical model based on the control volume method, which would enable efficient simulation of the semi-solid processing of complex industrial casting parts. Theoretical basis of the numerical simulation was briefly introduced. The latent heat was incorporated using the effective specific heat. The mass, momentum and enthalpy transport equation for each phase were solved. The application of the model allowed determining the temperature fields in the metal and the mold at 1 sec and the liquid fraction at time step 0.15 s with three different pressure regimes. The calculated pressure distribution and the evolution of liquid fraction through the material were examined and used to clarify their influence further investigated with tensile and hardness testing.Keywords:
Aluminum Alloy, Modeling, CFD, SEMI-Solid Casting, Solidification, Liquid Fraction, Mechanical Properties1. Introduction
Semi-solid casting process, as its name indicates, is the technological procedure for metals and alloys at semi-solid state. This process was innovated at Massachussets Institute of Technology (MIT) in the 70’ years of previous century [1-7]. So far, it has been the only casting process which gives the nodular structure instead of the dendritic one. One of its advantages is very high economic effectiveness, expressed in
i) accurate shape of castings, that required less subsequent machining; ii) higher mold service and so on.
In general, the solid fraction in semi-solid technology varies from 5 to 60% depending on the technology involved. The semi-solid casting method can be devided on two principal kinds: rheo-casting and thixo-casting. Semi-solid casting method can be combined with others to develop new technologies such as rheo-die casting, compo-casting etc. Some authors named their technology “nano-casting” too.
In the case of rheo-die casting technology (i.e.
combination of rheocasting with die casting) the turbulent flow of metal under high pressure that involves a lot of gas, resulting in the presence of porority in castings, is substituted
by a laminar flow allowing more “peaceful” mold filling due to lower pouring temperature (between liquidus and solidus). However, the viscosity of alloy is certainly higher and, as the result, requires higher pressure. So, the pressure must play a very important role in this process, especiallly in the temperature distribution inside castings and in phase fraction during solidification process. Observation in real castings is not always a good way; instead, the numerical simulation with computational fluid dynamics is applied in our study.
2. Methodology
Computational fluid dynamics (CFD) [19] is a simulation method for fluid flow, heat and mass transfer and the phenomena related to solving the mathematical equations with numerical method. Figure 1 describes the elements in the melt bulk to be simulated via the properties such as flow rate u, pressure p, specific weight ρ and energy E in the fuild flow equation:
+ ∮ = ∮ Γ∇
+ !"
# $
(1)
In the case of compressible as well as incompressible liquids the continuous equation (2) and mass conservation equation (3) can be applied:
%
+ (% )( + (% )+ (%))* = 0 (2)
%+ ∇( ,-) = !
. (3)
where ρ is specific weight,∇ is partial derivative, t is time, v
is velocity and Sm is the mass added to the continuous flow during phase transformation.
This model is applied to simulate the processes involving heat transfer and solid-liquid-vapor transformations, used in the FLUENT software. In this software the target function is enthalpy [20-22]. Enthalpy of a system can be calculated as the sum of apparent, h, and latent heats, ∆H; with href as referent enthalpy, Tref as referent temperature and /0 as isobaric specific heat:
1 = ℎ + Δ1 (4)
ℎ = ℎ$ + 55678/0 4 (5)
Liquid fraction can be determined as:
9 = 0 :; 4 < 4 = >? 9 = 1 :; 4 > 4= B (6)
9 = 5C5DEFGHID
5FGJIGHIDC5DEFGHID :; 4 = < 4 < 4= B (7)
Latent heat ∆H can be found as
Δ1 = 9K (8)
where L is latent heat during crystallization process of metals and alloys. The value of latent heat can vary from 0 (for solid) to L (for liquid). In the case of the solidification of multicomponent alloy, the theoretical liquidus temperature can be calculated as follows:
4= B = 4. = + ∑ = M N (9)
where Yi is weight fraction of i-solute, mi is the curvature for
Yi. For melting/solidification problems, the governing energetic equation can be written in the form:
( 1) +∇. ( ,̅1) =∇. (Q∇4) + ! (10)
with H isenthalpy, ρis specific weight, , RRRR- is liquid velocity,
Ki is the distribution coefficient at solid/liquid interface, and
S is internal source of heat. The solution for temperature field is the irrelative solution of flow equations (1), (2) and (3), governing energetic equation (10) and equation for liquid fraction (7) [25].
By the solidification modeling with FLUENT one can take on account the presence of gas gap between the mold and the solidifying alloy, that creates the heat resistance at boundary, which reduce the heat transfer across boundary. [24] Therefore, the heat flow across boundary, as shown in the Figure 1b, is:
S = 5C5T F
UV WX(YCZ)
(11)
where TW is mold temperature, k is heat conduction coefficient of liquid, β is liquid fraction and [ is heat resistance, which is the inverse quantity of heat conduction coefficient.
3. Modeling of Process
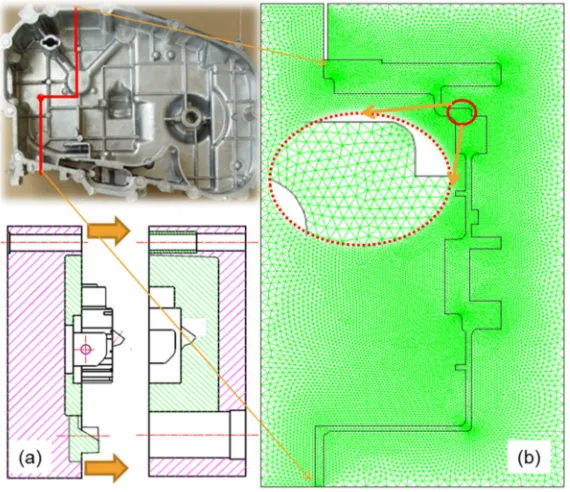
The simulated product was the diesel engine cover RV125 (Figure 1), produced by rheo-die casting. Based on the product configuration and technology design, the appropriate cross-section was chosen for calculation and analyze. This cross-section passed the important parts of the product, such as the canal for oil lubrication, as well as the thick and thin wall of casting.
The numerical simulation to determine the stabilizing time of the alloy crystallization was carried out by used ANSYS FLUENT (ANSYS Workbench - Fluid Flow (FLUENT)) code [25]. The element mesh at curvature or at thin wall was finer for more accurate calculation. The finite element was triangle. The number of element in casting, moving mold and static mold is 7022, 19510, 13902, respectively (Figure 1b). The chemical composition, thermal-physical properties of A356 are shown in Tables 1, 2 [26] and the technological parameters - in Table 3.
Table 1. Chemical composition of A356 alloy.
Cu Mg Mn Si Fe Zn Ti
Figure 1. The casting (a) and the simulation mesh (b).
Table 2. Thermal-physical properties of A356 and mold materials.
Thermal-physical properties Mold AISI 1010 A356
Solid Liquid
Liquidus temp. [K] 888
Solidus temp. [K] 828
Specific weight [kg.m-3] 7500 2700 2380
Specific heat [J.kg-1.K-1] 690 900 1200
Heat conduction coef. [W.m-1.K-1] 35 126 94
Latent heat [J.kg-1] 389000
Viscosity [kg.m-1.s-1] 0.1492 (873 K)
Heat transfer coef. between casting and mold [W.m-2.K-1] 0.02 50 50
Heat transfer coef. between mold and environment [W.m-2.K-1] 100
Table 3. The technological parameters (inputs).
Input parameters Mold Casting Environment
Liquid velocity to the mold [kg.s-1] 50
Liquid speed at gate [m.s-1] 22
Pouring temperature [K] 863
Mold temperature [K] 473
Environment temperature [K] 298
Pressure [atm] 1, 50 and 100
4. Results and Discussion
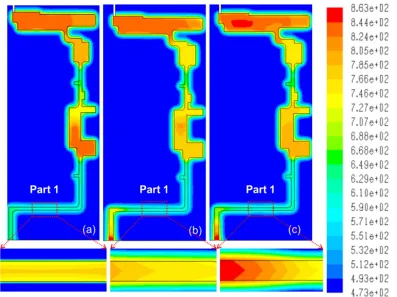
The results of simulation were shown in Figure 2, in which the perfect contact condition between the mold and the casting part was considered. Figures 2a, 2b and 2c show the temperature fields in the metal and the mold, for an initial mold temperature of 473 K at pressures of 1, 50 and 100 atm after one second. It can be seen that the position of the isotherms of the initial mold temperature and initial temperature of semi-solid melt lies on the values of 473 and 863 K. As seen, in the case of the pressure of 1 atm
temperature field of casting part was ranged from 650 to 840 K, the same results are obtained with 50 atm case and from 660 to 860 K for the case of 100 atm.
Figure 2. Temperature fields in the metal and the mold with difference pressures at 1 sec.
In the cases of high pressures (50 and 100 atm), the change in heat flow distribution leads to the change of the crystallization direction, so the picture differs from the conventional casting methods. Crystallization process was
relatively uniform in the whole of the casting part, the temperature distribution was therefore relatively uniform with higher cooling rate, which must have some effect on the grain size and crystal morphology.
Figure 3. Liquid fraction at 0.15 s after pouring under 1, 50 and 100 atm.
Figure 3 shows the liquid fraction at 0, 15 s after pouring upon the pressures of 1, 50 and 100 atm. As seen, in the case of atmospheric pressure (1atm), the solidification proceeds as usually from periphery toward center; the grain morphology is columnar-dendritic. The last region to solidify is center with a lot of defects such as porosity, shrinkage that cannot
be eliminated afterward. In the case of higher pressure (50 and 100 atm) the directional solidification, according to the direction of pressure, can be observed, that allows control the solidification process by creating an appropriate solidification direction.
III under different pressures are taken place.
At region II, under atmospheric pressure (1atm), the solidification process proceeds from periphery toward the center, and depends on the geometrical configuration of casting. Solidification rate at thin wall is higher than that of thick wall. Under 50 atm pressure, the solidification initiates near the gate (with the highest pressure), and does not depend on the geometrical configuration of casting. The same picture is in the case of 100 atm pressure, the only difference is that the solidification rate is slower. This creates more favorable conditions for transferring of pressure into region III; so, the solidification process there (the farthest region of casting) will happen under pressure, or, in other words, all regions of casting will solidify under high enough pressure, resulting in the finer microstructure.
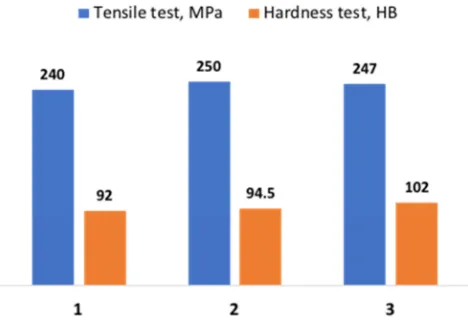
The density (ρ) on casting with different pressures (1, 50 and 100 atm) showed that the density increased from ρ = 2.21 g/cm3 (with 1 atm) to ρ = 2.59 g/cm3 (with 100 atm) (the ASTM standard of 2.67 g/cm3) [26]. In Figure 4, the results of the tensile test and the hardness on the casting specimen with pressures; A survey of three cases samples showed that the tensile strengths reached (240 ÷ 255) MPa and the hardness of the samples were greater than 90 HB.
Figure 4. Mechanical properties on casting with pressures: 1 atm (1), 50 atm (2) and 100 (3).
In the cases of high pressures (50 and 100 atm), the change in heat flow distribution leads to the change of the crystallization direction, so the picture differs from the conventional casting methods. Crystallization process was relatively uniform in the whole of the casting part, the temperature distribution was therefore relatively uniform with higher cooling rate, which must have some effect on the grain size and crystal morphology. [13, 14, 18]
5. Conclusions
The simulation of solidification of A356 alloy in rheo-die casting process with Computational Fluid Dynamics (CFD) was successful. The phase fractions were calculated under different pressures. The effect of pressure (50 and 100 atm) was observed as follows:
The higher pressure applied, the higher solidification rate
at thick part of the casting and the finer alloy microstructure obtained.
The density (ρ) on casting showed that the density increased from 2.21 to 2.59 g/cm3. The tensile strengths reached (240 ÷ 255) MPa and the hardness of the samples were greater than 90 HB
The solidification direction was changed, not from periphery to center, but from the part with higher pressure to that with lower pressure. This could result in reduction of such defects like porosity or shrinkage.
Acknowledgements
This study was carried out at Laboratory of Materials Technology, Hanoi University of Science and Technology in framework of the State-level Research Program KC02-23/06-10.
References
[1] M. C. Flemings, Met. Trans. 22A (1991) 957.
[2] S. P. Midson and K. Brissing, Modern Casting (1997) 41. [3] K. P. Young, CIATF Technical Forum, UK, 1997.
[4] V. I. Rudnev and R. L. Cook, Forging Magazine (1995) 27-30. [5] V. S. Nemkov, V. B. Demidovich, V. I. Rudnev and O. Fishman, Proc. of Electroheat Congress “ELECTROTECH 92”, Montreal (1992) 180-188.
[6] A. Billets, Aluminum Pechiney, 1996.
[7] S. Midson, V. Rudnev and R. Gallik, Proc. 5th Int. Conference on Semi-Solid Processing, Golden, CO (1998) 497-504. [8] J. J. Park, Met. Mater. Int. 20, 317 (2014).
[9] G. Timelli, G. Camicia, S. Ferraro, and R. Molina, Met. Mater. Int. 20, 677 (2014).
[10] B. G. Thomas, Q. Yuan, S. Mahmood, R. Liu and R. Chaudhary, Metallurgical and Materials Transactions B, 45(1), (2014) pp. 22-35.
[11] A. Ludwig, A. Kharicha and M. Wu, (2014). Metallurgical and Materials Transactions B, 45(1), 36-43.
[12] M. G. Mohammadi, et al., Metallurgical and Materials Transaction B, p. 1-10. (2016).
[13] N. H. Hai, D. M. Duc, N. N. Tien, and N. T. Tai, Adv. Tech. Mater. Produ. Proc., (eds. V. Y. Shchukin, G. V. Kozhevnikova and K. D. Kirdun), Belarus National Academy of Sciences, 209 (2011).
[14] P. Quang, N. H. Hai, and D. M. Nghiep, Adv. Tech. Mater. Produ. Proc., (eds. V. Y. Shchukin, G. V. Kozhevnikova and K. D. Kirdun) Belarus National Academy of Sciences, 225 (2011).
[15] D. M. Duc, N. H. Hai, and P. Quang, Sci. Tech. Metals 46, 37 (2013).
[17] N. T. Tai, D. M. Duc, N. H. Hai, and P. Quang, J. Sci. Tech. 5A, 194 (2013).
[18] D. M. Duc, N. H. Hai, and P. Quang, Korean J. Met. Mater., Vol. 55, No. 3 (2017), pp. 202~208.
[19] ANSYS FLUENT 14.1, “Theory guide”, Ch. 1. Basic fluid flow, ANSYS, Inc. (2011).
[20] ANSYS FLUENT 14.1, “Theory guide”, Ch. 17. Solidification and melting, ANSYS, Inc. (2011).
[21] J. R. Viegas, M. W. Rubesin, and C. C. Horstman, Technical Report AIAA-85-0180, AIAA 23rd Aerospace Sciences Meeting, Reno, Nevada (1985).
[22] V. R. Voller, American Metallurgical Society, Palm Desert, CA, 1987.
[23] V. R. Voller, A. D. Brent and K. J. Reid, Technical report, Conference for Solidification Processing, Ranmoor House, Sheffield, September 1987.
[24] V. R. Voller and C. Prakash, Int. J. Heat Mass Transfer, 30 (1987)1709-1720.
[25] ANSYS FLUENT 14.1 Software, ANSYS, Inc. (2011). [26] E. A. Brandes, Smithells metals reference book, Butterworths,