Published online May 30, 2013 (http://www.sciencepublishinggroup.com/j/pbs) doi: 10.11648/j.pbs.20130202.17
Rod and frame alignment times increase when the frame
is tilted
Jeff Bagust
1, Sharon Docherty
2, Rima Abdul Razzak
31 School of Health and Social Care, Bournemouth University, UK 2 AECC, 13-15 Parkwood Road, Bournemouth, UK
3 College of Medicine & Medical Sciences, Arabian Gulf University, PO Box 26671, Manama, Bahrain
Email adress:
[email protected] (J. Bagust), [email protected] (S. Docherty), [email protected] (R. A. Razzak)
To cite this article:
Jeff Bagust, Sharon Docherty, Rima Abdul Razzak. Rod and Frame Alignment Times Increase When the Frame is Tilted. Psychology and Behavioral Sciences. Vol. 2, No. 2, 2013; pp. 66-72. doi: 10.11648/j.pbs.20130202.17
Abstract:
The Rod and Frame test measures an individual’s subjective assessment of visual vertical and horizontal in the presence of a surrounding tilted frame. Attention has focused upon the effects of the surrounding frame upon spatial accuracy (Spatial Frame Effect). We have investigated if the tilted frame also affects the time that subjects take to make the alignment (Temporal Frame Effect). Results:125 subjects performed a computerised Rod and Frame test to investigate the effects of a tilted frame on subjective visual vertical and horizontal. In addition the program recorded the time taken to make each alignment. For most subjects the mean Spatial Frame Effect was small (vertical 1.62, SD 0.93; horizontal 1.9, SD 1.43). The mean time taken to make alignments in the presence of a tilted frame was longer than when the frame was not tilted (vertical, +3.4s, SD 4.4; horizontal, +3.2s, SD 4.5). Differences in the times taken when the rod and frame were presented congruently and incongruently could be fully accounted for by the differences in steps needed to move the rod to its final alignment. No relationship was found between the spatial accuracy and the time to make the alignment and there was no relationship between the Spatial and Temporal Frame Effects. Conclusions: This study suggests that the Spatial, and Temporal, Frame Effects provide information about different aspects of the process of resolving conflicting visual information when making judgments on alignment. In everyday functions such as the maintenance of balance or susceptibility to motion sickness, the increased time taken may be as important as spatial accuracy.Keywords:
Subjective Visual Vertical, Subjective Visual Horizontal, Rod and Frame Test1. Introduction
The Rod and Frame test has been used to assess the accuracy of the perception of subjective visual vertical, and less often subjective visual horizontal, since the late 1940’s when it was developed by Witkin et al [1]. In the test the subject is set the task of aligning a rod to gravitational vertical in the presence of a visual distraction – a surrounding tilted frame. Subjects upon whom the tilt of the surrounding frame has only a minor effect on the perception of vertical are described as being Field Independent. In a small number of people (5 – 20%) the tilt of the frame has a major influence on the perception of visual vertical, these are described as Field Dependent [2-5]. The Rod and Frame test was originally developed as one component of personality testing, but it has also been used to investigate postural control [4], falls in the elderly [6], vestibular dysfunction [7, 8] and neck pain [9, 10].
There are several different versions of the rod and frame test, ranging from variants of the original mechanical device developed by Witkin [11, 12] to computer based rod and frame tests [13-15]. In addition to being easy to administer and not requiring specialist facilities the computer based test can also measure the time taken for each subject to make the alignment.
When observing subjects perform the test we have been impressed by the wide variation in time that it takes them to position the line. Some subjects make the alignment in a time that is close to the minimum possible on the computer, whereas others take over 10 times as long. In a recent review, which was mainly concerned with the functional localisation of activity using f-MRI, Cohen [16] argues that too little attention has been given to time and time-based coding systems in cognitive neuroscience studies.
presentations of the rod and the surrounding frame and recording reaction times [17]; accuracy of detection of the orientation of the rod [18]; or ability to match a hand held rod to the visual stimulus [19]. Corbett et al [17, 20] reported that the reaction times were significantly faster when the rod and frame were tilted in opposite directions (incongruent), than when they were tilted in the same direction (congruent). Although using a different technique Kaleff et al [18] also found a significant difference between congruent and incongruent presentations of the rod and frame.
These studies have all investigated the subject’s response to a single presentation of the rod and frame, sometimes asynchronously. To date no studies have reported in detail on the differences in the effect of tilting the surrounding frame on the time taken to perform the test in the format where the Rod and Frame are presented simultaneously and the task is to align the rod to vertical. The current investigation was designed to describe the distribution of the times taken to perform this version of the test, and to answer the following questions.
i. Does tilting the frame affect the time taken to perform the test?
ii. Is there a relationship between spatial accuracy in aligning the rod and the time taken to perform the test?
iii. Is there a relationship between the Effect and the Temporal Frame Effect?
(The term Spatial Frame Effect (SFE) is used to refer to the errors (degrees) induced in the alignment when the surrounding frame was tilted, whereas the term Temporal Frame Effect (TFE) refers to the change in time taken to perform the alignment when the frame was tilted compared to the untilted frame condition).
iv. Is there a difference in the times taken to adjust the rod between congruent and incongruent presentations of the rod and frame?
2. Methods
2.1. Participants
One hundred and twenty five volunteers from the students and staff of the AECC (age range 15
mean (SD), 32.3 (12.5); 57 males, 68 females) participated in this study. To be included, participants must have been fit and healthy with normal, or corrected to normal, vision. There were no exclusion criteria.
All subjects gave their written consent to participate after being informed of the aims and methods of the study. The study was approved by the local research ethics committee
2.2. Procedures
All participants were required to complete both of the tests for the perception of vertical and horizontal. The order in which the two tests were performed was randomly assigned for each subject. Between tests subjects were given a short break.
presentations of the rod and the surrounding frame and ; accuracy of detection of the orientation of the rod [18]; or ability to match a hand held Corbett et al [17, 20] reported that the reaction times were significantly faster when the rod rections (incongruent), than when they were tilted in the same direction (congruent). Although using a different technique Kaleff et al [18] also found a significant difference between congruent and incongruent presentations of the rod and frame.
dies have all investigated the subject’s response to a single presentation of the rod and frame, sometimes asynchronously. To date no studies have reported in detail on the differences in the effect of tilting the surrounding frame form the test in the format where the Rod and Frame are presented simultaneously and the task is to align the rod to vertical. The current investigation was designed to describe the distribution of the times taken to o answer the following
i. Does tilting the frame affect the time taken to perform
ii. Is there a relationship between spatial accuracy in aligning the rod and the time taken to perform the test?
iii. Is there a relationship between the Spatial Frame
(The term Spatial Frame Effect (SFE) is used to refer to the errors (degrees) induced in the alignment when the surrounding frame was tilted, whereas the term Temporal ange in time taken to perform the alignment when the frame was tilted compared
iv. Is there a difference in the times taken to adjust the rod between congruent and incongruent presentations of the rod
One hundred and twenty five volunteers from the students and staff of the AECC (age range 15 – 62 years; mean (SD), 32.3 (12.5); 57 males, 68 females) participated To be included, participants must have been fit y with normal, or corrected to normal, vision.
All subjects gave their written consent to participate after being informed of the aims and methods of the study. The study was approved by the local research ethics committee.
All participants were required to complete both of the tests for the perception of vertical and horizontal. The order in which the two tests were performed was randomly assigned for each subject. Between tests subjects were given a short
The test was a modified version of the computer Rod and Frame test [15] viewed by the participant through a pair of Olympus Eye-trek FMD 200 video glasses. Wearing the video eyeglasses resulted in an image that spanned a viewing angle of 30 x 23 de
equivalent of viewing a 1.42m screen from a distance of 2m).
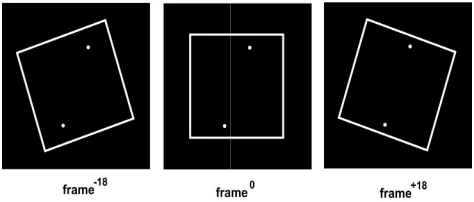
Both the horizontal and vertical tests comprised 14 presentations, the first two of which were for instruction purposes and were not included in the analysis. The remaining 12 presentations consisted of four replicates where the frame (a white square presented on a homogenous black background, Fig 1) was either untilted (frame0); (ii) tilted 18 degrees in a clockwise direction (frame+18); or (ii) 18 degrees in
clockwise direction (frame-18
represent the ends of the virtual rod were displayed in the centre of the screen (within the frame) and had two starting positions - tilted 20 degrees in either a clockwise or counter clockwise direction from gravitational vertical/horizontal. The order of presentation of these permutations of frame and dots was assigned by the computer from a
randomised sequences.
Figure 1. Screen displays showing the frame tilted counter clockwise (frame –18), untilted (frame 0) and clockwise (frame
dots mark the ends of the rod tilted +18°.
The subject’s task was to rotate the dots using the right and left mouse buttons to a position perceived to be vertical or horizontal depending on the test. The dots rotated around their virtual midpoint in 0.5 degree increments. When the participant was satisfied with the alignment of the dots, the program was advanced to the
the space bar of the computer keyboard. Positioning error was recorded by the computer as degrees from gravitational vertical/horizontal. In addition to the positioning error, the program also recorded the time taken to comple
the 12 presentations with a resolution of 0.01s. There was no restriction on the time each subject took to complete the tasks and participants were not told that this was being recorded. Neither the subject nor the operator had access to the recorded data until the end of the recording session.
2.3. Statistical Analysis
Deviations from vertical (or horizontal) were recorded in degrees as positive values if the deviation was in a clockwise direction, and negative values for counter clockwise deviations. These values were imported into The test was a modified version of the computer Rod and Frame test [15] viewed by the participant through a pair of trek FMD 200 video glasses. Wearing the video eyeglasses resulted in an image that spanned a viewing angle of 30 x 23 degrees of the visual field (the equivalent of viewing a 1.42m screen from a distance of
Both the horizontal and vertical tests comprised 14 presentations, the first two of which were for instruction purposes and were not included in the analysis. The emaining 12 presentations consisted of four replicates where the frame (a white square presented on a homogenous black background, Fig 1) was either - (i) ); (ii) tilted 18 degrees in a clockwise ); or (ii) 18 degrees in a counter ). The two white dots used to represent the ends of the virtual rod were displayed in the centre of the screen (within the frame) and had two starting tilted 20 degrees in either a clockwise or counter ckwise direction from gravitational vertical/horizontal. The order of presentation of these permutations of frame and dots was assigned by the computer from a bank of 4
Screen displays showing the frame tilted counter clockwise ) and clockwise (frame +18). In each case the
dots mark the ends of the rod tilted +18°.
The subject’s task was to rotate the dots using the right buttons to a position perceived to be vertical or horizontal depending on the test. The dots rotated around their virtual midpoint in 0.5 degree increments. When the participant was satisfied with the alignment of the dots, the program was advanced to the next presentation by pressing the space bar of the computer keyboard. Positioning error was recorded by the computer as degrees from gravitational vertical/horizontal. In addition to the positioning error, the program also recorded the time taken to complete each of the 12 presentations with a resolution of 0.01s. There was no restriction on the time each subject took to complete the tasks and participants were not told that this was being recorded. Neither the subject nor the operator had access to
orded data until the end of the recording session.
Excel 2003 and used to calculate the mean signed errors for the three frame condition (n = 4 in each case) for each participant. The mean absolute error (unsigned) was also calculated as the mean of the 8 unsigned val
combined frame+18 andframe-18 conditions.
2.4. Spatial Frame Effects (SFE)
The effect of frame tilt on the accuracy of alignment, (the Spatial Frame Effect), was calculated as the difference between the mean error recorded in the presence of a untilted frame (frame0), and the mean error recorded with a tilted frame (SFE-18 , SFE+18).
2.5. Temporal Frame Effect (TFE)
The mean time taken to complete the alignment for each of the three frame (frame0, frame+18,frame
was calculated, and a combined frame tilted (CFT) time calculated by averaging the frame+18 and
TFE was then calculated.
TFE = CFT time - frame0 time, seconds
All statistical analyses were performed using Instat3 (Graphpad, Inc). The data did not conform to a normal distribution and so differences between the frame tilt conditions were investigated using the Friedman Test (Nonparametric Repeated Measures ANOVA)
Dunns Multiple Comparison Test. Significance level was set at p<0.05. Possible relationships between spatial and temporal frame effects were investigated using Linear Regression analysis. Differences between the alignment times in congruent and incongruent rod and frame starting conditions were performed using paired t
transformed data.
3. Results
3.1. Temporal Frame Effect
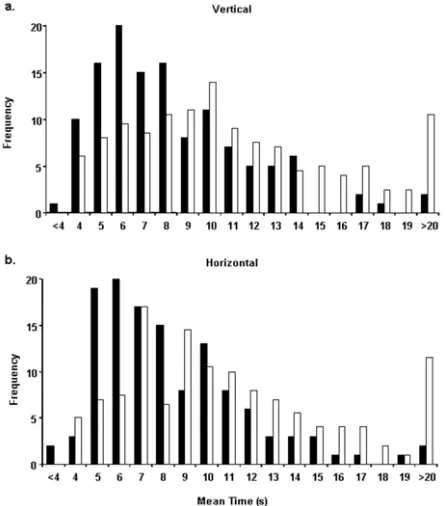
There was a wide range of average times taken to rotate the points into their final position (Fig 2
(3.9 – 59.5 s) and horizontal alignment tests (3.9
The minimum time that could be taken to move the 20 degrees from the start position to the horizontal or vertical position was 3.5 s.
The distribution plots reveal that for the unt
condition the mode time in both the vertical and horizontal tests was in the 6 s bin whereas in the frame tilted condition modes occurred at longer times. In the frame tilted conditions there was also a substantial secondary mode of subjects having mean times equal to or greater than 20s (Fig 2). Comparison of the times recorded in the frame untilted condition with both of the frame tilted conditions individually (minus and plus) and with the combined frame tilted data (average of frame minus and frame plus), showed a highly significant (P<0.001) increase in the positioning time when the frame was tilted in either direction (Table Excel 2003 and used to calculate the mean signed errors for the three frame condition (n = 4 in each case) for each participant. The mean absolute error (unsigned) was also calculated as the mean of the 8 unsigned values for the
conditions.
The effect of frame tilt on the accuracy of alignment, (the Spatial Frame Effect), was calculated as the difference between the mean error recorded in the presence of an ), and the mean error recorded with a
The mean time taken to complete the alignment for each frame-18) conditions and a combined frame tilted (CFT) time andframe-18 times. The
time, seconds
All statistical analyses were performed using Instat3 (Graphpad, Inc). The data did not conform to a normal distribution and so differences between the frame tilt conditions were investigated using the Friedman Test (Nonparametric Repeated Measures ANOVA) and post-hoc
Dunns Multiple Comparison Test. Significance level was set at p<0.05. Possible relationships between spatial and temporal frame effects were investigated using Linear Differences between the alignment d incongruent rod and frame starting conditions were performed using paired t-test on logn
There was a wide range of average times taken to rotate 2) in both the vertical 59.5 s) and horizontal alignment tests (3.9 – 50.3 s). The minimum time that could be taken to move the 20 degrees from the start position to the horizontal or vertical
The distribution plots reveal that for the untilted frame condition the mode time in both the vertical and horizontal tests was in the 6 s bin whereas in the frame tilted condition In the frame tilted conditions there was also a substantial secondary mode of ving mean times equal to or greater than 20s (Fig ). Comparison of the times recorded in the frame untilted condition with both of the frame tilted conditions individually (minus and plus) and with the combined frame d frame plus), showed a highly significant (P<0.001) increase in the positioning time when the frame was tilted in either direction (Table 1).
In the vertical alignment test the combined mean time increased by 3.4 s (38.2%) when the frame was tilted, and b 3.2 s (36.3%) in the horizontal alignment test.
Although there was a significant difference between the time taken to align the points in the untilted and tilted frame conditions, the wide spread of the untilted frame times partially obscures the effect that the frame had on individual timings. This has been addressed in Fig
distribution of the Temporal Frame Effects are plotted. Comparison with the raw timing (Fig
the spread of the frame effect on timing is less dispe with modes for both the vertical and horizontal tests in the less than 1 sec bin, (Table 1, last column) although in both cases 21% of individuals had times which increased by 5 seconds or more when the frame was tilted
Figure 2. Distribution of mean times taken to align dots to a). and b). – horizontal. Solid bars – frame not tilted; Open bars frame tilted 18°. n=125.
Figure 3. Distribution of the TFE times (mean frame tilted untilted) when the frame was tilted 18°. Vertical alignment Horizontal alignment – open bars, n = 125.
In the vertical alignment test the combined mean time increased by 3.4 s (38.2%) when the frame was tilted, and by 3.2 s (36.3%) in the horizontal alignment test.
Although there was a significant difference between the time taken to align the points in the untilted and tilted frame conditions, the wide spread of the untilted frame times
that the frame had on individual timings. This has been addressed in Fig 3 where the distribution of the Temporal Frame Effects are plotted. Comparison with the raw timing (Fig 2, Table 1), shows that the spread of the frame effect on timing is less dispersed, with modes for both the vertical and horizontal tests in the , last column) although in both cases 21% of individuals had times which increased by 5 seconds or more when the frame was tilted.
Distribution of mean times taken to align dots to a). – vertical, frame not tilted; Open bars – combined
Distribution of the TFE times (mean frame tilted – mean frame untilted) when the frame was tilted 18°. Vertical alignment – solid bars,
Vertical Frame Untilted
Mean (s ± SD) 8.9 (3.9) 95% CI (s) 8.2 to 9.5
Median (s) 8.0
Range (s) 3.9 to 26.7
Significance -
Horizontal
Mean (s ± SD) 8.8 (3.5)
95% CI (s) 8.2 to 9.9
Median (s) 7.9
Range (s) 3.9 to 22.0
Significance -
3.2. Spatial Errors
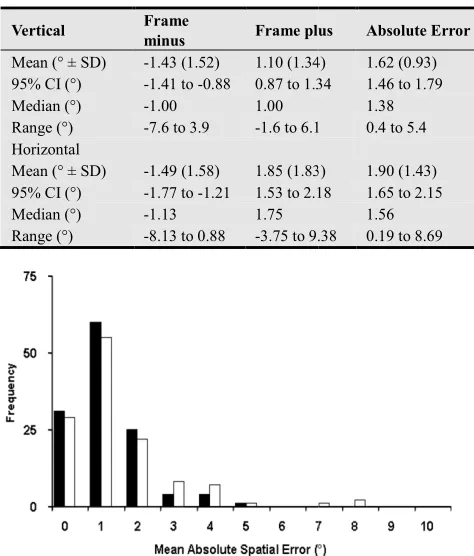
Tilting the frame caused the estimation of vertical or horizontal to be distorted towards the direction of the frame tilt. The effect was apparent with both negative and positive tilts of the frame in both the vertical and horizontal alignment tests. In each test the mean and median of the signed errors were between 1 and 2 degrees of zero (Table although individual errors ranged up to 10 degrees.
The plot of the absolute (unsigned) errors which combines the effects of the negative and positive frame t
similar distribution, with modal values between 1 and 2 degrees and a tail of errors ranging up to 5 degrees in the vertical alignment test, and 8 degrees in the horizontal test (Fig 4, Table 2).
Table 2. Mean spatial errors.
Vertical Frame
minus Frame plus
Mean (° ± SD) -1.43 (1.52) 1.10 (1.34) 95% CI (°) -1.41 to -0.88 0.87 to 1.34
Median (°) -1.00 1.00
Range (°) -7.6 to 3.9 -1.6 to 6.1 Horizontal
Mean (° ± SD) -1.49 (1.58) 1.85 (1.83) 95% CI (°) -1.77 to -1.21 1.53 to 2.18
Median (°) -1.13 1.75
Range (°) -8.13 to 0.88 -3.75 to 9.38
Figure 4. Distribution of mean absolute spatial errors in the presence of
Table 1. Rod alignment times (sec).
Frame tilt minus Frame tilt plus Combined Frame tilted
12.5 (7.7) 12.1 (6.7) 12.3 (6.9)
11.1 to 13.9 10.8 to 13.2 11.1 to 13.5
10.8 10.9 10.7
4.0 to 59.4 4.0 to 44.1 4.1 to 51.7
P<0.001 P<0.001 P<0.001
11.8 (6.9) 11.9 (6.2) 12.0 (6.2)
10.5 to 13.0 10.8 to 13.1 10.9 to 13.1
10.4 10.2 10.6
4.5 to 50.3 4.4 to 34.9 4.5 to 40.1
P<0.001 P<0.001 P<0.001
Tilting the frame caused the estimation of vertical or horizontal to be distorted towards the direction of the frame tilt. The effect was apparent with both negative and positive tilts of the frame in both the vertical and horizontal ch test the mean and median of the signed errors were between 1 and 2 degrees of zero (Table 2), although individual errors ranged up to 10 degrees.
The plot of the absolute (unsigned) errors which combines the effects of the negative and positive frame tilts, showed a similar distribution, with modal values between 1 and 2 degrees and a tail of errors ranging up to 5 degrees in the vertical alignment test, and 8 degrees in the horizontal test
Mean spatial errors.
Frame plus Absolute Error
1.10 (1.34) 1.62 (0.93) 0.87 to 1.34 1.46 to 1.79
1.38 1.6 to 6.1 0.4 to 5.4
1.85 (1.83) 1.90 (1.43) 1.53 to 2.18 1.65 to 2.15
1.56 3.75 to 9.38 0.19 to 8.69
. Distribution of mean absolute spatial errors in the presence of
tilted frames. Vertical alignment – solid bars, Horizontal alignment bars. n = 125.
3.3. Relationship between Spatial Accuracy and Time Taken
There was a wide range in both the size of the positioning errors, and the time taken to make the alignment (Tables 1 and 2). The possibility of a relationship between the accuracy of alignment and the time taken was investigated using linear regression (Table 3). No relationship was found in either the untilted or tilted frame conditions in either the vertical or horizontal alignment tests. The calculated slopes for the line of best fit ranged from
for r2 ranged from 0.002 to 0.137.
Table 3. Relationship between spatial accuracy (Y time (X-axis).
Vertical Slope
No Tilt -0.01
Tilted -0.03
Horizontal
No Tilt -0.01
Tilted 1.59
Linear regression analyses were performed on the data recorded in both the untilted and tilted frame conditions for the horizontal and vertical alignment tests. (n = 125 in all cases).
3.4. Relationship between Spatial Frame Ef Temporal Frame Effect
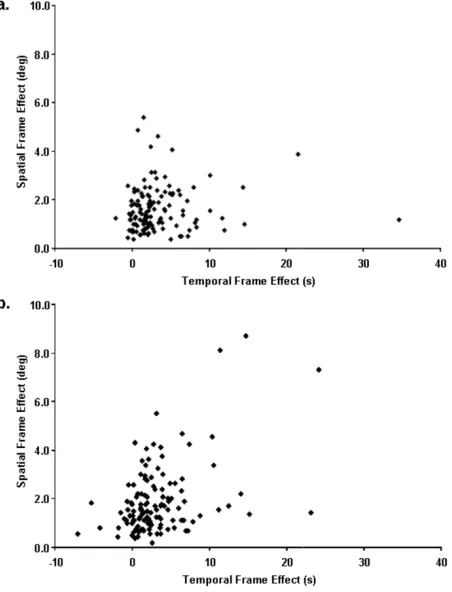
It was of interest to investigate if those individuals who showed large Spatial Frame Effect values also recorded higher values for the Temporal Frame Effect.
scatter plots of the Temporal Frame Effect against the Spatial Frame Effect. No clear relationship was apparent in either the vertical or the horizontal alignment tests (vertical alignment r2 = 0.0068; horizontal alignment r
3.5. Congruent Vs Incongruent Rod Starting Positions
No systematic measure of the perceived level of difficulty of the alignment tasks was made in this study. However a
Combined Frame
Temporal Frame Effect
3.4 (4.4) 2.6 to 4.2 2.1
-2.1 to 34.6 -
3.2 (4.5)
2.4 to 3.9 2.2 -7.1 to 24.2 -
solid bars, Horizontal alignment – open
between Spatial Accuracy and Time
There was a wide range in both the size of the positioning errors, and the time taken to make the alignment (Tables 1 2). The possibility of a relationship between the accuracy of alignment and the time taken was investigated using linear regression (Table 3). No relationship was found in either the untilted or tilted frame conditions in either the alignment tests. The calculated slopes for the line of best fit ranged from -0.01 to 1.59, and values
ranged from 0.002 to 0.137.
Relationship between spatial accuracy (Y-axis) and alignment
Y-intercept r2
0.76 0.002
1.90 0.017
0.77 0.062
9.02 0.137
Linear regression analyses were performed on the data recorded in both the untilted and tilted frame conditions for the horizontal and vertical alignment tests. (n = 125 in all cases).
Relationship between Spatial Frame Effect and
It was of interest to investigate if those individuals who showed large Spatial Frame Effect values also recorded ral Frame Effect. Fig 5 shows scatter plots of the Temporal Frame Effect against the Spatial Frame Effect. No clear relationship was apparent in either the vertical or the horizontal alignment tests (vertical
= 0.0068; horizontal alignment r2 = 0.1921).
3.5. Congruent Vs Incongruent Rod Starting Positions
number of subjects expressed the opinion that the task was more difficult when the rod starting position and the frame were tilted in the same direction (congruent), than when the rod starting position was in the opposite direction to the frame tilt (incongruent). An analysis of the times taken to complete the alignment under these two conditions revealed that mean times to alignment was shorter when the rod was in the congruent than in the incongruent starting position (Mean (SD), vertical congruent 11.9 (6.2)s, incongruent 12.7 (8.0)s; horizontal congruent 11.7 (7.3)s, incongru
(4.2)s), but this only reached statistical significance in the case of the vertical alignment test; vertical: P=0.018; horizontal: P=0.177 (P values were calculated by the paired t-test using logn of the time values).
Figure 5. Plots of the Temporal Frame Effect against the Spatial Frame Effect in a.) vertical alignment test; b.) horizontal alignment test. n=125 in each case.
Before the difference between the congruent and incongruent alignments could be considered meaningful it was necessary to establish that the number of movement steps did not differ between the two conditions.
absolute spatial errors were 1.6° and 1.9° for the vertical and horizontal tests respectively (Table 2), representing 3 movement steps of 0.5 °. These errors were in the direction of the frame tilt, meaning that when the subjects were aligning the dots in the congruent condition they were performing on average 6 – 8 fewer movement steps than in the incongruent condition. The maximum speed of
of the rod when the mouse button was held down number of subjects expressed the opinion that the task was when the rod starting position and the frame were tilted in the same direction (congruent), than when the rod starting position was in the opposite direction to the frame tilt (incongruent). An analysis of the times taken to ese two conditions revealed that mean times to alignment was shorter when the rod was in the congruent than in the incongruent starting position (Mean (SD), vertical congruent 11.9 (6.2)s, incongruent 12.7 (8.0)s; horizontal congruent 11.7 (7.3)s, incongruent 12.4 (4.2)s), but this only reached statistical significance in the case of the vertical alignment test; vertical: P=0.018; horizontal: P=0.177 (P values were calculated by the paired
Plots of the Temporal Frame Effect against the Spatial Frame Effect in a.) vertical alignment test; b.) horizontal alignment test. n=125 in
Before the difference between the congruent and incongruent alignments could be considered meaningful it was necessary to establish that the number of movement steps did not differ between the two conditions. The mean absolute spatial errors were 1.6° and 1.9° for the vertical and horizontal tests respectively (Table 2), representing 3 – 4 0.5 °. These errors were in the direction of the frame tilt, meaning that when the subjects were aligning the dots in the congruent condition they were 8 fewer movement steps than in the incongruent condition. The maximum speed of rotation of the rod when the mouse button was held down
continuously was approximately10 steps/s (100ms/step). At this speed the difference in the number of steps required between the congruent and incongruent conditions was sufficient to account for the
between the two conditions.
4. Discussion
The results reported in the current study are in agreement with Spatial Frame Effects reported in studies using what Isableu et al describe as ‘2D Rod and Frame Tests’, and are smaller than those reported using mechanical ‘3D’ rod and frame tests [12]. The frame had the effect of distorting the estimate of vertical or horizontal in the direction of the frame. In the majority of subjects the Spatial Frame Effect was relatively small, causing an average deviation of the absolute error of less than two degrees, when the frame was tilted by 18°. However the distribution of errors exhibited a tail of higher values indicating subjects whose perception of vertical was strongly influenced by the
surrounding frame – i.e. show a high degree of ‘field dependence’. In the present study 11.2% (14 out of 125), subjects had a Spatial Frame Effect greater than the sample mean + 2SD in the vertical orientation test, and 12.8% (16 out of 125) in the horizontal orientation test.
Previous studies of time aspects of the Rod and Frame Test have been aimed at investigating the time course of the Rod and Frame Illusion and identifying the processing systems employed in the brain [17, 19, 20].
employed more complex designs, such as asynchronous presentation of the rod and frame stimuli, than the simple rod positioning within a frame used in the Asch & Witkin [2] and Oltman [11] tests. The novel component of the present study was to investigate the effects of tilting the frame on the time taken to make the adjustment to the perceived vertical or horizontal alignment. In both the vertical and horizontal tests the mean time taken to make the adjustment was 3 seconds longer when the surrounding frame was tilted than when it was untilted. This translates to an increase in time of 35-40% (vertical 38.2%, horizontal 36.4%) when the frame was tilted.
Although there was no difference in the distance that the rod had to be rotated in the tilted and no tilt frame conditions, the increased time taken when the frame was tilted appeared to correspond to an impression of increased level of difficulty. No assessment was made of the participant’s subjective impression of difficulty but subjects
commented that they found the frame tilted trials more difficult, particularly when the rod starting position was tilted in the same direction as the surrounding frame (congruent). Corbett et al [17] reported that subjects responded more slowly in congruent trials than in incongruent trials, and that the late P3 component of the event-related potential of the EEG was larger when the rod and frame were tilted incongruently versus congruently [20]. Kaleff et al [18] also reported significant diffe between congruent and incongruent rod and frame continuously was approximately10 steps/s (100ms/step). At this speed the difference in the number of steps required between the congruent and incongruent conditions was sufficient to account for the mean difference of 0.6 – 0.7s
The results reported in the current study are in agreement with Spatial Frame Effects reported in studies using what Isableu et al describe as ‘2D Rod and Frame Tests’, and are than those reported using mechanical ‘3D’ rod and frame tests [12]. The frame had the effect of distorting the estimate of vertical or horizontal in the direction of the frame. In the majority of subjects the Spatial Frame Effect was
sing an average deviation of the absolute error of less than two degrees, when the frame was tilted by 18°. However the distribution of errors exhibited a tail of higher values indicating subjects whose perception of vertical was strongly influenced by the orientation of the i.e. show a high degree of ‘field dependence’. In the present study 11.2% (14 out of 125), subjects had a Spatial Frame Effect greater than the sample mean + 2SD in the vertical orientation test, and 12.8% (16
125) in the horizontal orientation test.
Previous studies of time aspects of the Rod and Frame Test have been aimed at investigating the time course of the Rod and Frame Illusion and identifying the processing systems employed in the brain [17, 19, 20]. These studies employed more complex designs, such as asynchronous presentation of the rod and frame stimuli, than the simple rod positioning within a frame used in the Asch & Witkin [2] and Oltman [11] tests. The novel component of the present investigate the effects of tilting the frame on the time taken to make the adjustment to the perceived vertical In both the vertical and horizontal tests the mean time taken to make the adjustment was 3 – 3.5 he surrounding frame was tilted than when it was untilted. This translates to an increase in time of 40% (vertical 38.2%, horizontal 36.4%) when the frame
presentations. In the present investigation, although differences were found in the time taken to perform congruent and incongruent tasks, these could be adequately accounted for by the different number of steps required to align the rod in the two conditions. It is probable that this difference in the effects of congruent and incongruent presentations between the studies reflects differences in the procedures used. The studies of Cobett et al [17, 20] and Kaleff et al [18], simply required the subject to identify if the rod was aligned clockwise or counterclockwise to vertical, in the current study the subject also had to rotate the rod to the vertical orientation.
Regression analysis to investigate the relationship between spatial accuracy and the time taken to perform the test failed to show any correlation between the two parameters in the presence of either untilted or tilted frames. Despite the longer time taken to perform the alignment when the frame was tilted and the apparent increase in the level of perceived difficulty, this did not result in poorer spatial accuracy.
In these investigations the subjects were not placed under any pressure other than the distraction of the surrounding frame. It has been reported that alignment accuracy increases when the subject is stressed by standing in a less stable posture [21], it would be interesting to determine if similar results were obtained using the Computer Rod and Frame system, and what the effects are on the timings. It would also be interesting to observe the effects on spatial accuracy if subjects were placed under time pressure when performing the Rod and Frame test.
The lack of a clear relationship between the Spatial and Temporal Frame Effects indicates that individuals who would be classified as ‘frame dependent’ based on their spatial performance, are not necessarily the same as those who show large Temporal Frame Effects. This suggests that the two measurements reflect different components in the system for resolving conflicting visual inputs when assessing spatial orientation. The maintenance of balance and posture are dynamic events, requiring rapid responses to disturbances in equilibrium. It may be that the increased time taken in resolving conflicting visual inputs by people who exhibit greater Temporal Frame Effects renders them less able to respond sufficiently rapidly to changes in their surroundings, leading to poorer balance and falls [22] and perhaps an increased susceptibility to motion sickness [23-25].
5. Conclusions
The average time taken to make alignments to either vertical or horizontal increased by an average of approximately 3 seconds in the presence of a tilted surrounding frame compared to an untilted frame. This effect was in addition to the well established spatial error induced by the tilted frame, but no relationship was found between spatial error and the time taken to make the alignment. There was large variation in the Temporal Frame
Effect between individuals, but subjects exhibiting large temporal effects did not necessarily also show large spatial effects. These results suggest that the spatial and temporal components of the frame effect of the Rod and Frame test reflect different components in the system for resolving conflicting visual inputs.
References
[1] Witkin HA, Lewis HB, Hertzman M, Machover K, Meissener P, Wapner S. Personality through perception. New York: Harper; 1954.
[2] Asch SE, Witkin HA. Studies in space orientation. II Perception of the upright with displaced visual fields and with body tilted. J Exp Psychol 1948,38: 455–475.
[3] Spinelli D, Antonucci G, Daini R. Zoccolotti P. Local and global visual mechanisms underlying individual differences in the rod-and-frame illusion. Percept & Psychophys 1995, 57:915-920.
[4] Isableu B, OhlmannT, Crémieux J, Amblard B. How dynamic visual field dependence-independence interacts with the visual contribution to postural control. Hum Mov Sci 1998, 17:367-391.
[5] Isableu B, Ohlmann T, Cremieux J, Vuillerme N, Amblard B, Gresty MA. Individual differences in the ability to identify, select and use appropriate frames of reference for perceptuo-motor control. Neuroscience 2010, 169:1199-1215.
[6] Lord S, Webster, IW. Visual field dependence in elderly fallers and non-fallers. Int J Aging Hum Dev 1990, 31:267-277.
[7] Lopez C, Lacour M, Magnan J, Borel L. Visual field dependence-independence before and after unilateral vestibular loss. Neuroreport 2006, 17:797-803.
[8] Pagarkar W, Bamiou D-E, Ridout D, Luxon L M. Subjective Visual Vertical and Horizontal: Effect of the Preset Angle. Archives Otolaryngol Head Neck Surg 2008, 134:394-401.
[9] Grod JP, Diakow PR. Effect of neck pain on verticality perception: a cohort study. Arch Phys Med Rehabil 2002, 83:412-415.
[10] Bagust J, Rix GD, Hurst HC. Use of a computer rod and frame (CRAF) test to assess errors in the perception of visual vertical in a clinical setting – a pilot study. Clin Chiropractic 2005, 8:134-139.
[11] Oltman PK. A portable rod-and frame apparatus. Perceptl Mot Skills 1968, 26:503-506.
[12] Isableu B, Gueguen M, Fourré B, Giraudet G, Amorim M-A. Assessment of visual field dependence: Comparison between the mechanical 3D rod-and-frame test developed by Oltman in 1968 with a 2D computer-based version. Journal Vestib Res 2008, 18: 239-247.
Neuropsychol 2003, 25:1169-1177.
[14] Bagust J. Assessment of verticality perception by a rod-and-frame test: preliminary observations on the use of a computer monitor and video eye glasses. Arch Phys Med & Rehabil 2005, 86:1062-1064.
[15] Docherty S, Bagust J. From line to dots: An improved computerised Rod and Frame system for testing subjective visual vertical and horizontal. BMC ResNotes 2010, 3; 9.
[16] Cohen MX. It’s about time. Front Hum Neurosci 2011, 5: 2.
[17] Corbett JE, Handy TC, Enns JT. When do we know which way is up? The time course of orientation perception. Vision Res 2009, 49:28-39.
[18] Kaleff CR, Aschidamini C, Baron J, de Leone CN, Canavarro S, Vargas CD. Semi-automatic measurement of visual verticality perception in humans reveals a new category of visual field dependency. Braz J Med Biol Res 2011, 44:754-761.
[19] Lommertzen J, van Zuijlen AMJ, Meulenbroek RGJ, van Lier R. Differential effects of the rod and frame illusion on
the timing of forearm rotations. Motor Control 2009, 13:54-68
[20] Corbett JE, Enns J, Handy T. Electrophysiological evidence for post-perceptual influence of global visual context on perceived orientation. Brain Res 2009, 1292:82-92.
[21] Bray A, Subanandan A, Isableu B, Ohlmann T, Golding JF, Gresty MA. We are most aware of our place in the world when about to fall. Curr Biol 2004, 14:R609-R610.
[22] Agrawal Y, Carey JP, Della Santina CC, Schubert MC, Minor LB: Diabetes, vestibular dysfunction, and falls: Analyses from the National Health and Nutrition Examination Survey. Otol Neurotol 2010, 31.1445-1450
[23] Bles W, Bos JE, de Graaf B, Groen E, Wertheim AH. Motion sickness: Only one provocative conflict? Brain Res Bull 1998, 47:481-487.
[24] Bos JE, Bles W. Groen EL. A theory on visually induced motion sickness. Displays 2008, 29:45-57.