Published online October 10, 2014 (http://www.sciencepublishinggroup.com/j/aff) doi: 10.11648/j.aff.20140305.16
ISSN: 2328-563X (Print); ISSN:2328-5648 (Online)
Effect of plant spacing on the yield and yield component of
field pea
(pisum sativum L.)
at Adet, North Western Ethiopia
Yayeh Bitew, Fekremariam Asargew, Oumer Beshir
*Adet Agricultural Research Centre, Amhara Agricultural Research Institute, Bahir Dare, Ethiopia
Email address:
[email protected] (Y. Bitew)
To cite this article:
Yayeh Bitew, Fekremariam Asargew, Oumer Beshir. Effect of Plant Spacing on the Yield and Yield Component of Field Pea (Pisum Sativum L.) at Adet, North Western Ethiopia. Agriculture, Forestry and Fisheries. Vol. 3, No. 5, 2014, pp. 368-373.
doi: 10.11648/j.aff.20140305.16
Abstract:
Field pea is an important low-input break crops throughout the highlands of Ethiopia. The experiment wasconducted on effect of spacing on the yield and yield component of field pea cultivars (pisum sativum L.) in 2012-213 cropping
season at Adet Agricultural research station. Three intra row spacing’s (5 cm, 10 cm and 15 cm) and two inter row spacing (20 cm and 25 cm) were evaluated using two released varieties, Sefinesh and Megeri on a plot size of 5 m x 5m (25 m2). The experimental design was a completely randomized block with 12 treatments in three replications. JMP-5 (SAS) software was used to compute the analysis of variance, correlation and regression analyses. Main effects of variety and intra row spacing had significant effect (P<0.05) on plant height, number of seeds per pod, seed yield while inter row spacing did not affect all examined attributes. The overall highest seed yield was recorded when Sefinesh was planted in 15 cm intra row spacing followed by Megeri in 5cm intra row spacing. The experiment revealed that average yield of Megeri increased when intra row spacing decreased. The reverse is true for Sefinesh. Similarly, increasing the intra row spacing revealed a peak seed yield at approximately 15 cm intra row spacing in Sefinsh. More importantly, increase in inter and intra row spacing together leads to increase and decrease the seed yield of Sefinesh and Megeri, respectively. Hence, 25 cm inter row with 15 cm intra row and 20 cm inter row with 5 cm intra row spacing, respectively gave the highest mean seed yield, and thereby increase the productivity of filed pea cultivars in West Gojam, but the experiment should be tested under small scale farmers’ conditions.
Keywords:
Field Pea, Intra Row Spacing, Inter Row Spacing, Megeri, Sefinesh1. Introduction
Among the high land legume crops, field pea is the second important stable food grain in Ethiopia and mainly grown under rain fed conditions. It is important low-input break crops throughout the highlands of Ethiopia (1800-3000m. a.sl) [1]. About 150 thousand hectare of land is allocated to field pea production every year putting Ethiopia in the list of major filed pea producing countries in the world [2]. Field pea is primarily used for human consumption. It has high levels of amino acids, lysine and tryptophan, which are relatively low in cereal grains. Field pea contains approximately 21-25 % protein and high levels of carbohydrates, are low in fibber [3]. The seed yield obtained by local farmers is quite low and variable. Thus, the national average yield of field pea is 12 qt/ha [4]. Among the many yield limiting factors in field pea production under farmers practice plant population and planting method are important. High yields are realized with
optimum plant population and planting method. In the past some observations in plant population and planting methods were made at Holleta. The indications were 500,000plants/ha and row planting at 40 cm spacing were optimum [2].
In Ethiopia, farmers traditionally either broadcast their seeds in isolation or mixed with Faba beans or as intercropping with other cereals and cover it with a local plow [2]. Due to lack of recommendations on inter and intra row spacing of field pea cultivars, plant populations on farmers’ fields appear lower or higher than the optimum.
and Intra-row planting) for two selected varieties, Sefinesh (large seeded) and Megeri (Small seeded) of sowing at Adet Agricultural Research station.
2. Materials and Methods
The experiment on the effect of plant spacing (intra and inter-row spacing ) on the two varieties of filed pea was conducted for two year (2012-2013) at Adet Agricultural research station located between 11017, N latitude and 370 43, E longitude with an altitude of 2240 m.a.s.l. The mean annual total rain fall is 1257 mm, ranging between 860 mm and 1771 mm and the average annual temperature is ranging from 90c to 25.50c.The highest rain fall in 2012 and 2013 were observed at August and September, respectively. However, the distribution of rain fall during the experimental months is explained in Figure 1. Monthly rain fall were more or less good uniform distribution during 2012 cropping season as compared to 2013 cropping season (Figure 1). Detailed chemical and physical soil characteristics of the experimental area are explained in Table 1 [5]. The experimental area is mainly clay in texture. Three intra-row spacing’s (5 cm, 10 cm and 15 cm) and two inter-row spacing (20 cm and 25 cm) were evaluated using two released varieties, Sefinesh (large seeded) and Megeri (Small seeded) on a plot size of 5 m x 5m (25 m2) in RCBD design with 3 replications. The distance between each plot and replication were 0.5 m and 1m, respectively. At planting 100 kg/ha DAP were applied, planting date, weeding and other crop management practices were applied as recommended for the site. All the relevant data’s including plant height, number of pods per plant, number of seeds per pod, seed yield (kg/ha) and thousand seed weight (gram), were collected from the net plot size and subjected to analysis of variance using [6] computer software. Comparisons between treatment means were made using Turkey HSD Test at 0.05 probability level. Correlation coefficients were used to determined relationships among the examined traits. Regression analyses were also performed between seed yield and intra row spacing and the interaction between both row spacing’s.
Figure 1. Monthly Rain fall (mm) during the experimental years (2012-2013) at Adet Agricultural Research station
Table 1. Chemical properties of the soil in the research area (Adet Agricultural research area)
Soil characteristics Values
Sand 11%
Silt 21%
Clay 69%
Available P (Olsen) 1.688
Total N % 0.0949
Organic Matter % 1.898
cmol/kg K+ 0.45
cmol/kg CEC 25.32
PH 5.17
3. Results and Discussion
3.1. Plant Height
The influence of row spacing (Intra and Inter-row spacing) and variety on the yield and yield component of field pea
(pisum sativum L.) are presented in this paper. Inter row spacing had no significant effect on all growth, yield and yield component of field pea varieties (Table 2). Combined data of the two years demonstrated that variety (Table 2), intra row spacing (Table 2), interaction between variety and intra row spacing
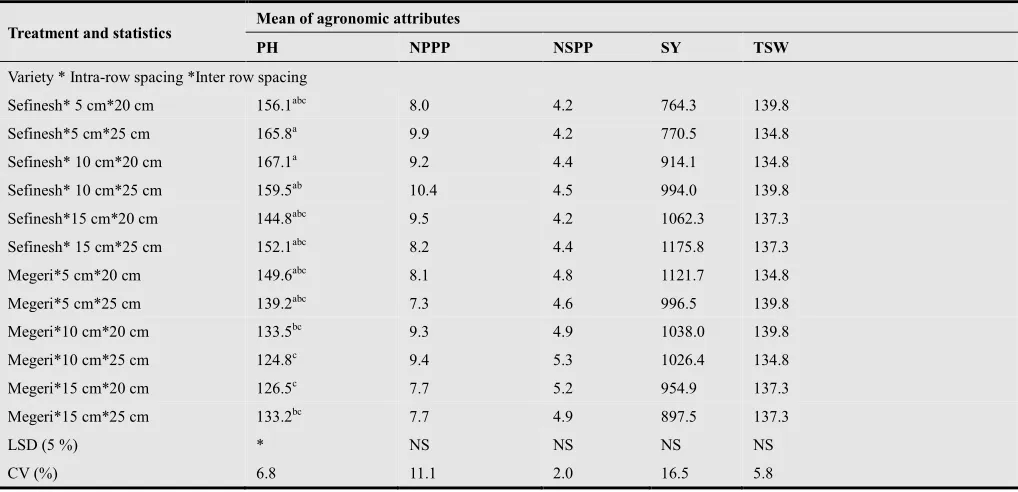
(Table 3) and interaction between variety and inter row spacing (Table 3) had significant effect (P<0.05) on plant height. Results of analysis of variance also showed that combined data presented in Table 4 indicated that interaction between all possible treatments were differed highly significantly (P<0.01) in plant heights.
According to Table 1, results of combined statistical analysis indicated that, Sefinesh cultivar (157.6 cm) recorded the highest plant height as compared to Megeri (134.4 cm). Planting field pea using Intra row spacing of 5 cm (157.7 cm) gave the highest plant height as compared to boarder intra row spacing; 15 cm (143.3 cm) intra row spacing showed the lowest plant height (Table 1). Plant height increased linearly by increasing plant population (decreasing intra row spacing) due to competition of plants in higher densities on light, resulting in taller plants. Similar findings were achieved by [7], who indicated that denser plant population of pea increased plant height due to competition among plants.
spacing and 25 cm inter row spacing (112.7-134.8 cm) (Table 4). According to [8] plant height of different cultivars of field pea significantly affected by row spacing’s. Higher plant height for Sefinesh planted under higher inter and intra row spacing was supported by [9], who expressed that cultivar x row spacing interactions, affected plant height character which was greater when wide rows was used. Higher plant height for Megeri planted under lower inter and intra row spacing was supported by [7], who indicated that denser plant population of pea increased plant height due to competition among plants. This is might be due to close row spacing, the space for plant spreading was less and hence plant height increased significantly. Findings of [10] found that the tallest plant from closer row spacing.
3.2. Number of Pods per Plant
In the current study, combined analysis of variance showed that both the main and the interaction effect did not significantly affect (P>0.05) the number of pods per plant
(Table2-4). Though, interaction between, variety and each plant spacing were statistically non significant effect on number of pods per plant on field pea cultivars in combined analysis, highest mean values was recorded when Sefinesh and Megeri were planted in 10 cm intra row spacing and 25 cm inter row spacing (Table 4). The increase in the number of pods per plant in wider row spacing may be due to vigorous plants as in wider spacing; plant grew vigorously and produced more branches which resulted in high number of pods per plant. On the other hand, in closer row spacing, the plant growth was decreased which resulted in less number of pods per plant. [10] found the highest number of pods/plant in wider row spacing as compared to closer spacing.
A reduction in the plant population (wider intra and inter row spacing) in the case of Sefinesh significantly increases the number of pods per plant and it was supported by [11] who found that a reduction in the plant population significantly increases the number of pods per plant.
3.3. Number of Seeds per Pod
Table 2. Combined main effects (variety, Intra-row spacing and Inter-row spacing) on the growth, yield and yield component of field pea at Adet (2012 -2013)
Treatment and statistics Mean of agronomic attributes
PH NPPP NSPP SY TSW
Variety
Sefinesh (large seeded) 157.6a 9.2 4.3b 946.8 139.4
Megeri (Small seeded) 134.4b 8.3 4.9a 1005.9 135.2
LSD (5 %) ** NS * NS NS
Intra row spacing
5 cm 152.7a 8.3 4.4 913.3 135.1
10 cm 146.2b 9.6 4.8 993.1 137.5
15 cm 139.1b 8.3 4.7 1022.6 139.3
LSD (5 %) * NS NS NS NS
Inter row spacing
20 cm 146.2 8.6 4.6 975.9 137.1
25 cm 145.8 8.8 4.6 976.8 137.5
LSD (5 %) NS NS NS NS NS
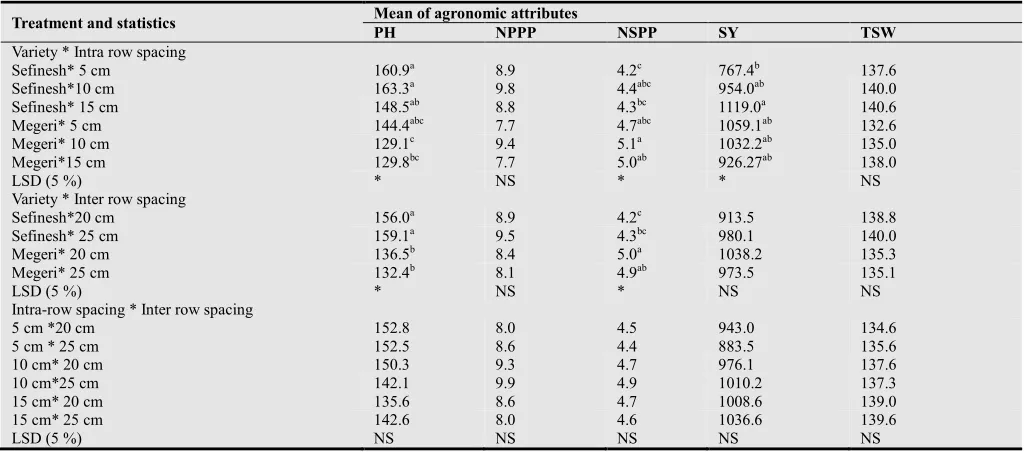
Table 3. Combined interactions between variety; intra and inter row spacing on the agronomic attributes of filed pea at Adet research station (2012-2013)
Treatment and statistics Mean of agronomic attributes
PH NPPP NSPP SY TSW
Variety * Intra row spacing
Sefinesh* 5 cm 160.9a 8.9 4.2c 767.4b 137.6
Sefinesh*10 cm 163.3a 9.8 4.4abc 954.0ab 140.0
Sefinesh* 15 cm 148.5ab 8.8 4.3bc 1119.0a 140.6
Megeri* 5 cm 144.4abc 7.7 4.7abc 1059.1ab 132.6
Megeri* 10 cm 129.1c 9.4 5.1a 1032.2ab 135.0
Megeri*15 cm 129.8bc 7.7 5.0ab 926.27ab 138.0
LSD (5 %) * NS * * NS
Variety * Inter row spacing
Sefinesh*20 cm 156.0a 8.9 4.2c 913.5 138.8
Sefinesh* 25 cm 159.1a 9.5 4.3bc 980.1 140.0
Megeri* 20 cm 136.5b 8.4 5.0a 1038.2 135.3
Megeri* 25 cm 132.4b 8.1 4.9ab 973.5 135.1
LSD (5 %) * NS * NS NS
Intra-row spacing * Inter row spacing
5 cm *20 cm 152.8 8.0 4.5 943.0 134.6
5 cm * 25 cm 152.5 8.6 4.4 883.5 135.6
10 cm* 20 cm 150.3 9.3 4.7 976.1 137.6
10 cm*25 cm 142.1 9.9 4.9 1010.2 137.3
15 cm* 20 cm 135.6 8.6 4.7 1008.6 139.0
15 cm* 25 cm 142.6 8.0 4.6 1036.6 139.6
3.4. Seed Yield
The present study also demonstrated that two year combined analysis of variance showed that variety (Table 2), interaction between variety and intra row spacing (Table 3), interaction between varieties and inter row spacing (Table 3) had significant effect (P<0.05) on the number of seeds per pod. Further, as seen Table 5 number of seeds per pod was positively and significantly correlated with seed yield (r=0.35*) and positively correlated with number of pods per plant (r=0.2). In contrary, 1000-seed weight was negatively correlated (r=-0.16) with number of seeds per pod. This indicated that increasing these traits in pea cultivar decrease 1000-seed weight and increasing seed yield of the pea cultivar. These results are in agreement with [8] who stated that negatively correlation between 1000-seed weight and seed per pod; and significant and positive correlation between seed yield and seed per pod indicated that increasing these traits in pea cultivar decrease 1000-seed weight and increase seed yield of the pea cultivar.
Among the field pea varieties, Megeri (4.7-5.2) gave the mean highest number of seeds per pod as compared to Sefinesh (3.8-4.8) (Table 2). The highest mean number of seeds per pod was recorded when Mgeri was planted in 10 cm (5.0) intra row spacing while planting Sefinesh in 5cm (4.2) gave the lowest number of seeds per pod (Table 3).This may be due to the fact that in wider row spacing the pods length was maximum resulting in maximum no seeds per pod in these plots and vice versa. Reports of [10] found that maximum number of seeds per pods in wider row spacing than closer row spacing
It is evident from the combined analysis of variance across two years indicated in Table 2 that the differences in variety and intra-row spaces had caused to significant changes in seed yield of field pea. Based on the statistical results, we detected that interaction effects between variety and intra row spacing was significantly influence (P<0.05) the seed yield of field pea cultivars (Table 3). Inter row spacing (Table 2), interaction between intra and inter row spacing (Table 3), interaction between intra row spacing, inter row spacing and variety (Table 4) had no significant effect (P>0.05) on seed yield of field pea cultivars. In terms of seed yield, data given in Table 5 also showed that positive and significant correlation between seed yield and pod number per plant (r=0.37*), seed number per pod (r=0.35*) functioned as major contributors to seed yield of field pea cultivars. These results represented that selection based on number of pods per plant and seed number per pod increase seed Yield of field pea. Similar results were obtained by [12] and [13].
Although, the mean effect of variety was statistically non significant, Megeri (1005.9 kg/ha) gave the highest grain yield as compared to Sefinesh (946.8 kg/ha) (Table 2). These variations in yield among field pea might be due to difference genetic potential of the variety and environment [14]. The above result was in contrary with the research out puts of [15], who reported that smaller and larger seeds of a same variety of
soybean will have the same yield potential. However, [16] reported that seed size was positive and significant relationship between TSW and seed yield of chickpea and lentil. As well, although, there was no significantly differences among the combined results of intra row spacing, the mean highest seed yield was recorded when field pea cultivars were planted in 15 cm intra row spacing (1022.6 kg/ha) (Table 2). The response of seed yield explained using quadratic equation (Figure 2) showed that increasing the intra row spacing revealed a peak seed yield at approximately 15 cm intra row spacing in the larger seed of field pea cultivar (Sefinsh). When planting Sefinesh from 5 cm to 15 cm intra row spacing the seed yield increased by 31.8%. However, planting Megeri from 5 cm to15 cm intra row spacing seed yield decreased by 12.3%.
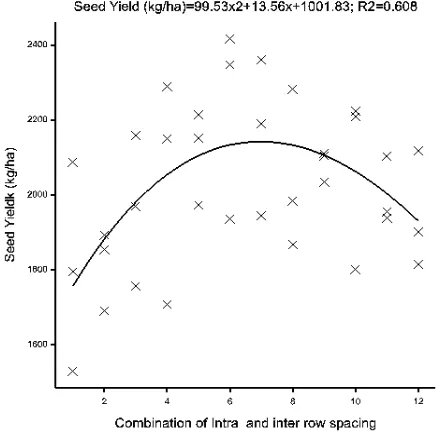
Although, the interaction between of variety, intra and inter row spacing were statistically non significant effect on the seed yield of filed pea cultivars in the combination of two years, the combined overall highest seed yield was obtained when Sefinesh was planted in 15 cm intra and 25 cm inter row spacing (1175.8 kg/ha) followed by Megeri was planted in 5 cm intra and 20 cm inter row spacing (1121.7 kg/ha) (Table 4). The response of seed yield explained using quadratic equation illustrated under Figure 3 also showed that increasing the intra row spacing and inter row spacing together revealed a peak seed yield at approximately 15 cm intra 25 inter row spacing in the larger seed of field pea cultivar (Sefinsh) (Figure-3). Further increases intra and inter row spacing together for small seeded field pea cultivars (Megeri) result in yield penalty. This is similar to the previous findings of Ozveren, (2013) who showed that further increases in row spacing causes reduction in seed yield of field pea cultivars. However, further decreases intra and inter row spacing together for large seeded field pea cultivars (Sefinesh) result in seed yield reduction. The former and the later results are disagree and in agree, respectively with results of [17], who reported that the seed yield of dry pea increased with increasing plant population densities from 30 to 80 plant per m2.
3.5. Thousand Seed Weight
Combined analysis of variance showed that both the main and the interaction effects were not statistically significant change for 1000 seed weight (Table 2-4). Similarly, [8], [11] [18] and [19] identified that there were no significant differences in row spacing for 1000 seed weight. It was also reported by [20] who reported that there were no significantly differences among cultivars in terms of 1000-seed weight of field pea. Negatively correlation between 1000-seed weight and number of pods per plant, number of seeds per pod (Table 5) indicated that increasing these traits in pea cultivar decrease 1000-seed weight of the pea cultivar.
4. Conclusions
intra row spacing followed by Megeri in 5cm intra row spacing. The experiment revealed that average yield of Megeri increased when intra row spacing decreased. The reverse is true for the large seeded field pea (Sefinesh). Similarly, increasing the intra row spacing revealed a peak seed yield at approximately 15 cm intra row spacing in the larger seed of field pea cultivar (Sefinsh). When planting Sefinesh from 5 cm to 15 cm intra row spacing the seed yield increased by 31.8%. However, planting Megeri from 5 cm to15 cm intra row spacing
seed yield decreased by 12.3%. More importantly, increase in inter and intra row spacing together leads to increase and decrease the seed yield of Sefinesh and Megeri, respectively. Hence, 25 cm inter row with 15 cm intra row and 20 cm inter row with 5 cm intra row spacing, respectively gave the highest mean seed yield, and thereby increase the productivity of filed pea cultivars in West Gojam, but the experiment should be tested under small scale farmers’ conditions.
Table 4. Combined interactions between varieties, intra and inter row spacing on the agronomic attributes of filed pea at Adet research station (2012-2013)
Treatment and statistics Mean of agronomic attributes
PH NPPP NSPP SY TSW
Variety * Intra-row spacing *Inter row spacing
Sefinesh* 5 cm*20 cm 156.1abc 8.0 4.2 764.3 139.8
Sefinesh*5 cm*25 cm 165.8a 9.9 4.2 770.5 134.8
Sefinesh* 10 cm*20 cm 167.1a 9.2 4.4 914.1 134.8
Sefinesh* 10 cm*25 cm 159.5ab 10.4 4.5 994.0 139.8
Sefinesh*15 cm*20 cm 144.8abc 9.5 4.2 1062.3 137.3
Sefinesh* 15 cm*25 cm 152.1abc 8.2 4.4 1175.8 137.3
Megeri*5 cm*20 cm 149.6abc 8.1 4.8 1121.7 134.8
Megeri*5 cm*25 cm 139.2abc 7.3 4.6 996.5 139.8
Megeri*10 cm*20 cm 133.5bc 9.3 4.9 1038.0 139.8
Megeri*10 cm*25 cm 124.8c 9.4 5.3 1026.4 134.8
Megeri*15 cm*20 cm 126.5c 7.7 5.2 954.9 137.3
Megeri*15 cm*25 cm 133.2bc 7.7 4.9 897.5 137.3
LSD (5 %) * NS NS NS NS
CV (%) 6.8 11.1 2.0 16.5 5.8
Note: Means followed by different letters in columns are significantly different at 5 % of probability level according to Tukey HSD Test. On the above table PH , NPPP , NSPP, N0F, SY and TSW refers to plant height in cm, number of pods per plant, number of seeds per pod, seed yield in kilogram/ha and Thousand seed
weigh in gram, respectively
Table 5. Estimation of correlation between important agronomic traits of field pea as affected by variety, intra and inter-row spacing at Adete research station average in two years ( 2012-2013) (n=36).
Variable by Variable Correlation Signif Prob Plot Corr
NPPP PH 0.3902 0.0186
NSPP PH -0.2971 0.0785
NSPP NPPP 0.2019 0.2377
SY PH 0.0136 0.9371
SY NPPP 0.3700 0.0263
SY NSPP 0.3498 0.0365
TSW PH 0.1598 0.3518
TSW NPPP -0.0354 0.8375
TSW NSPP -0.1597 0.3523
TSW SY 0.1640 0.3391
Notes: PH , NPPP , NSPP, N0F, SY and TSW refers to plant height in cm, number of pods per plant, number of seeds per pod, seed yield in kilogram/ha and
Figure 2. Relationship between intra row and seed yield in combined of the two years
Figure 3. Relationship between combination of intra and inter row spacing and seed yield in combined of the two years
References
[1] Amare G., and Adamu M., (1993). Faba bean and field pea Agronomy research Holleta and Sheno Agricultural research center pages 199-225h. In: Proceeding of the first National Cool-season food legumes review conference ,16-20 Decmber,1993 (Asfaw T., Geletu B., Mohan C.,and Mahmoud B.,eds), Adiss Abeba, Ethiopia
[2] Beyene D., Alem B., Hailu G. and Beniwal S. (1989). Yield testing of promising field pea lines, Holeta research center. In: Nile Valley Regional program cool season food legumes, Research results, 1989 crop season, Institute ofAgricultural research, Addis Abeba, Ethiopia. akota State University and U.S. Department of Agriculture cooperating, USA
[3] Central Statistical Agency (2012) Agricultural Sample Survey. 2011/2012 Volume I Report on Area and Production of Major Crops. Statistical Bulletin. May 2012, Addis Ababa.
[4] Tilahun Tadesse, Alemayehu Assefa, Minale Liben and Zelalem Tadesse, 2013. Effects of nitrogen split-application on productivity, nitrogen use efficiency and economic benefits of maize production in Ethiopia. International Journal of Agricultural Policy and Research Vol.1 (4), pp. 109-115 [5] SAS Institute Inc., 2002. JMP-5 Statistical Software, Version
5.Cary, NC, USA.
[6] Inanç S and B. Yıldırım., 2007. The Effect of Different Row Space Applications on the Yield and Yield Components in Pea (Pisum sativum L.). Turkish VII. Field Crops Congress, 25-27 July, Erzurum
[7] Derya Ozveren Yucel, 2013. Impact of plant density on yield and yield components of pea (pisum sativum ssp. sativum l.) cultivars. arpn Journal of Agricultural and Biological Science 2(8):169-174
[8] Shirtliffe S.J. and A.M. Johnston. 2002. Yield-Density relationships and Optimum Plant Populations in two Cultivars of Solid-Seeded Dry Bean (Phaseolus vulgaris L.) Grown in Saskatchewan. Can. J. Plant Sci. 82: 521-529.
[9] Dahmardeh M, M Ramroodi and J Valizadeh. 2010. Effect of Plant Density and Culticars on Growth, Yield and YieldComponents of Faba Bean (Vicia faba L.). Afr J. of Biot. 9(50): 8643-8647.
[10] Hoorman J.J., R. Islam and A. Sundermeier. 2009. Sustainable Crop Rotations with Cover Crops. OSU, Agriculture and Natural Resources. Fact Sheet.
[11] Sharma, S.K., 2002. Effect of sowing time and spacing levels on seed production of pea cultivar Arkel. Seed Res. 30(1): 88-91.
[12] Momoh, E. J. J. and W. Zhou, 2001. Growth and yield responses to plant density and stage of transplanting in winter oilseed rape (Brassica napus L). Journal of Agronomy and Crop Science, 186: 253-259.
[13] Togay N., Y. Togay, B. Yıldırım and Y. Doğan., 2008. Relationships between Yield and Some Yield Components in Pea (Pisum sativum ssp arvense L.) Genotypes by using Correlation and Path Analysis. African J. of Biotechnology. 7(23): 4285-4287
[14] Anlarsal A.E., C. Yücel and D. Özveren., 2001. A Research on Determination of Yields and Adaptation of Some Pea (Pisum sativum ssp. sativum L. ve Pisumsativum ssp. avense L.) Lines at Conditions of Çukurova. J. Agric. Fac. Ç.Ü. 16 (3): 11-20. [15] Biçer, T., 2009. The effect of seed size on yield and yield
components of chickpea and lentil. African Journal of Biotechnology Vol. 8 (8), pp. 1482-1487, Available online at
http://www.academicjournals.org/AJB
[16] Gan Y.T., P.R. Miller, B.G. McConkey, R.P. Zentner,P.H. Liu and C.L. McDonald. 2003. Optimum Plant Population Density for Chickpea and Dry pea in a Semiarid Environment. Can. J. Plant Sci. 83: 1-9.