Proc. IAHS, 379, 249–253, 2018
https://doi.org/10.5194/piahs-379-249-2018 © Author(s) 2018. This work is distributed under the Creative Commons Attribution 4.0 License.
Open Access
v
ativ
e
w
ater
resources
management
–
understanding
and
balancing
inter
actions
betw
een
humankind
and
n
ature
The use of an integrated variable fuzzy sets in water
resources management
Qingtai Qiu1, Jia Liu1, Chuanzhe Li1, Xinzhe Yu2, and Yang Wang1
1China Institute of Water Resources and Hydropower Research, State Key Laboratory of Simulation and Regulation of Water Cycle in River Basin, China, Beijing 100038, China
2Collage of Environment, Hohai University, No.1 Xikang Road, Nanjing 210098, China
Correspondence:Jia Liu ([email protected])
Received: 31 December 2017 – Accepted: 12 February 2018 – Published: 5 June 2018
Abstract. Based on the evaluation of the present situation of water resources and the development of water
conservancy projects and social economy, optimal allocation of regional water resources presents an increasing need in the water resources management. Meanwhile it is also the most effective way to promote the harmonic relationship between human and water. In view of the own limitations of the traditional evaluations of which always choose a single index model using in optimal allocation of regional water resources, on the basis of the theory of variable fuzzy sets (VFS) and system dynamics (SD), an integrated variable fuzzy sets model (IVFS) is proposed to address dynamically complex problems in regional water resources management in this paper. The model is applied to evaluate the level of the optimal allocation of regional water resources of Zoucheng in China. Results show that the level of allocation schemes of water resources ranging from 2.5 to 3.5, generally showing a trend of lower level. To achieve optimal regional management of water resources, this model conveys a certain degree of accessing water resources management, which prominently improve the authentic assessment of water resources management by using the eigenvector of levelH.
1 Introduction
Regional rational allocation of water resources means to per-form rational allocation of water resources available in the region by various means following certain principles and cor-responding criteria (Wang et al., 2008). With the improve-ment achieved in water resources developimprove-ment and utiliza-tion, China has performed water allocation based on macro-scopic economy, ecological water consumption and reservoir regulation etc. successively, and realized water allocation-based channel water quality distribution; water resource allo-cation played a vital role in guiding the rational utilization of water resources and the rapid social and economic develop-ment in China during the impledevelop-mentation of the Tenth year Plan, the Eleventh year Plan, and the Twelfth Five-year Plan (Wang and You, 2008; Wang et al., 2008). Due to the aged urban water facilities and the rural water consump-tion that was difficult to make statistics of in the past, indus-trial water utilization was far from being consistent with the most stringent system of water resources management; with
the update and perfection of urban pipe network facilities, the significant improvement of rural water facilities, and the enhancement of water resources development and utilization in the northern part of China in recent years, it’s essential to further improve the water resources management measures to achieve the development of industrial structure featuring “industry determination by water”; in view of the current wa-ter resources development and utilization, dynamic industrial water allocation should be a major measure for management improvement.
250 Q. Qiu et al.: Integrated variable fuzzy sets in water resources management the measures for improving water resource management in
Zoucheng County based on evaluation result.
2 Theory and methodology
2.1 System dynamics (SD) model
System dynamics (SD) model suits for the management of modern social system since it’s based on OP and control theory. SD model divides the research object into a number of subsystems, establishes the cause-and-effect network be-tween subsystems based on the information feedback mecha-nism in each subsystem, and probes into the relationship be-tween the whole and subsystems, and bebe-tween subsystems (Rehan et al., 2013). As well , SD model was applied as a decision support tool to evaluate and analyze ingapore’s integrated water resources. The results shows it is a useful support tool for deciding sustainable water resources (Xi and Poh, 2013). In nature, SD model is a first order differential equation group that describes the dependence of the varia-tion rate of each state variable in the system on state vari-ables or certain inputs etc., further takes into account some factors contributing to the change of state variables, and re-solves the description of variation rate into the description of some flow rates based on the actual conditions of system and the research requirements. Mathematical equation of SD model (Simonovic and Fahmy, 1999):
1. State variable: Input and output variables or the vari-ables accumulated by either thereof.
Lk=Lj+DT IRj k−ORj k
(1)
Where,Lk,Rj k-Output and input rates (variation rate);
DT-Time interval.
2. Rate equation: Input and output parallel variable.
Lk−Lj
DT =
DL
DT=IRj k−ORj k (2)
3. Auxiliary equation:
In SD model, the algebra of rate equation requires ad-ditional algebraic calculation, i.e. auxiliary equation. It can be used to solve the problems of nonlinear, high or-der and complex time-varying systems. It can accurately understand and show the relationship between internal and external factors.
4. Table function:
Since simple algebraic combination-based auxiliary variable can’t accurately describe nonlinear relation-ship, graphical representation of non-liner function is needed, i.e. through table function.
System dynamics method features fast analysis and simple model building, as well as the use of non-linear equation, but this in turn represents the weakness of system dynamics: Even a tiny perturbation of nonlinear equation parameters that describe the intrinsic relation of system may bring about the absurdity of long-term analysis result. A novel integrated decision support tool, which synergized System Dynamics (SD) and Analytic Hierarchy Process (AHP) was proposed in Singapore’s sources of water supply, shows that the limited capacity and long construction time of underground water have a profound impact on Singapore’s water resources (Xi and Poh, 2015). As well, variable set fuzzy evaluation is suit-able for the study on complex system since it gives overall evaluation of objectives constrained by various factors using fuzzy mathematics as its theoretical basis, thereby giving a quantitative description of water resources bearing capacity; furthermore, variable set fuzzy evaluation can be used with scenario analysis to provide decision makers with technical support.
2.2 Variable fuzzy sets (VFS)
Defining the concept of VFS, we set thatU is a fuzzy con-cept,A and Ac reflect the attractability and repellency re-spectively. To any elementsu(u∈U),µA andµAc are the relative membership function of elementutoAand Ac that express the degrees of attractability and repellency (Chen, 2012, 2013; Wang et al., 2014).
µA+µAc=1,0≤µA≤1,0≤µAc≤1 (3) Where,µAis defined as relative difference degreeutoA.
Suppose the regional water resources utilized level has m indices eigenvalue as follows:
Iab=
[a11, b11] [a12, b12] . . . [a1c, b1c]
[a21, b21] [a22, b22] . . . [a2c, b2c]
..
. ... . . . ...
[am1, bm1] [am2, bm2] . . . [amc, bmc]
=([aih, bih]) (4)
Where,Iabrepresents the index function;ameans the index;
bstands for the index level.
First, the subjective weight of index is determined through analytic hierarchy process; then, entropy method is used to obtain the expert weight entropy model based on the pairwise discrimination matrices established by experts for evaluating the quality of information presented by experts; finally, com-bination is performed to figure out the index fusion weight.
W=
m
X
j=1
wj×S(j=1,2,· · ·, m) (5)
Where,W means the final fusion weight;wj represents the
Q. Qiu et al.: Integrated variable fuzzy sets in water resources management 251 Integrated relative membership degree vector of the
scheme for Levelh:
Vh(uj)=
1
1+
m P i=1
[wi(1−µih(uj))]p m
P i=1
[wiµih(uj)]p
(6)
Where,Vh(uj) represents the relative membership degree of
each index of Schemej for Levelh;wimeans the weight of
indexi, whilew1+w2+. . .wm=1;α=1, andprepresents
distance parameter: In this paper, Hamming distancep=1 is assumed to achieve a linear model of integrated relative membership degree of the scheme for Levelh, namely
Vh(uj)= m
X
i=1
wiµih(uj) (7)
Since the distribution sequence of relative membership de-gree of u for Level C in the domain of discourse and the Weight h of Variable c are given, their sum is called “the eigenvalue of level variable”:
H(u)=
c
X
h=1
µA(uo)h (8)
2.3 Integrated variable fuzzy sets model (IVFS)
System dynamics (SD) model works out the water allocation that reflects the present regional situation and future indus-trial structure through the establishment of water use index system; the variable fuzzy sets choose the evaluation index system that reflect water consumption level, compute the wa-ter resource utilization level eigenvalue, and identify the fo-cus of regional water allocation and management in future based on eigenvalue variation analysis. IVFS is relatively low in parameter accuracy and pays more attention to dynamic behavior and system structure.
3 Case study
3.1 water utilization in the index system
Located in Jining, Shandong Province, Zoucheng County is one of top 100 counties in China. Industry-specific water consumption in Zoucheng County in 2015: The per capita water consumption was 256.93 m3a−1, approx. 1/2 of the per capita water consumption in China; the water consumption per RMB 10 000 of industrial GDP amounted to 15.71 m3, approx. 1/8 of the national average; the urban domestic wa-ter consumption was 106 L p−1d, approx. 1/2 of the national average; the rural residents’ living water consumption was 83 L p−1d, which was approximately equal to the national average; the water consumption per Mu of farmland irrigated was 258 m3, approx. 1/2 of the national average. Taken to-gether, Zoucheng County leads in China in terms of water utilization.
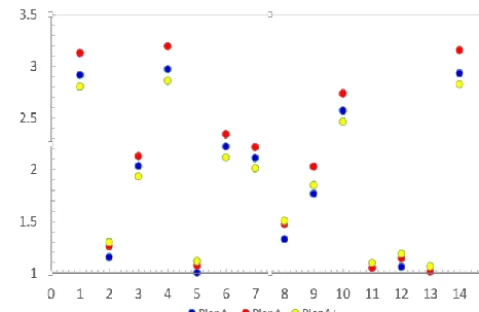
Figure 1.The Water Utilization level of Each town
In order to suit the comparison for the performance of this approach, evaluated index system is chosen to keep in line with the regional actual situation. In this paper, a series of indices are chosen to input SD model in Table 1 which can be divided into two types according to the status of the index: one is a constant and the other change with the function.
After the system dynamics model to calculate the region water resources allocation, according to the actual area anal-ysis, analysis level indicators of water resources, and accord-ing to the analysis of regional water level change manage-ment. From the output of SD model, this paper Selects the evaluation index: water resources per capita (WRC) (m3), development and utilization rate of water resources (DURW) (%), regional economic growth rate (REG) (%), water short-age ratio (WRS) (%), per-10000-yuan-GDP water (PG) (m3), proportion of ecological water (%) (PEW), overlimit rate of water pollution (OWP) (%).
3.2 Water level based on the IVFS
According to the SD model analysis, matrixIabcan be
deter-mined as follows.
Iab=
[550,450] [450,350] [350,250] [250,150] [150.50] [0.55,0.6] [0.6,0.65] [0.65.0.7] [0.7,0.75] [0.75,0.8]
[11,10] [10,9] [9,8] [7,6] [5,4] [0,0.03] [0.03,0.06] [0.06,0.09] [0.09,0.12] [0.12,0.15]
[10,12] [12,14] [14,16] [16,18] [18,20] [0.5,0.48] [0.48,0.46] [0.46,0.44] [0.44.0.42] [0.42,0.4]
[0,0.1] [0.1,0.2] [0.2,0.3] [0.3,0.4] [0.4,0.5]
In order to ensure the consistency of region, this article se-lects AHP and entropy method to build the index weight (Yu et al., 2009)
252 Q. Qiu et al.: Integrated variable fuzzy sets in water resources management
Table 1.The regional variable of evaluating index system for Zoucheng.
Index Variable Index Variable Index Variable
Invest 1990–2030 C WatSupply C AllocateRatio T
Local invest T GrowthCurve T Water Invest1990–2030 T
RatioIncre T InflationRate T Limitedrecye T
InvToWatIncre T IrrigatedAreaCash T RatAgrWatSavInv T
Table 2.The evaluation index system based on VFS.
Index Change (%) Max (%)
development and utilization ±1 ±4 rate of water resources
regional economic growth rate 2.5 10 per-10000-yuan-GDP water 1.5 14 proportion of ecological water ±4 ±16
Table 3.The weights of indices by AHP and Entropy Model.
Index WRC DURW REG WRS PG PEW OWP
Weight 0.091 0.096 0.221 0.134 0.44 0.184 0.14
of towns economy, and the regional water resources utilized level. As well, these towns which get a higher water level shows an order of Plan A, Plan A−, Plan A+. This implies that, although the water level level is higher, but these towns already present a full capacity. These towns that get a low water level, are still has certain development potential.
4 Conclusions
According to the model output result:
a. The water resources consumption of Zoucheng County in current and planned level years presents an increas-ing trend; the consumption will increase fast between current year and 2020 (short-range planned level year), and increase slowly between 2020 and 2030 (long-term planned level year), which conforms to the overall de-velopment trend of Zoucheng County. The variation of growth rate mainly results from the fact that the high water consumption in Zoucheng County narrows its growth potential.
b. In Zoucheng County, the water consumption is high in urban area and its surroundings, and at general level in remote towns, which reflects that fact that the water consumption decreases with the increase of the percent-age of agricultural water; in consideration of the over-all industrial layout and rural population in Zoucheng County, a threshold for agricultural water shall be de-fined for water resource management in the future.
It can be concluded that the evaluation of Water resources us-ing settus-ings can play a part in water management. These con-clusions can guide decision makers and government in future considerations related to water-lack management in regional development.
Data availability. The main basic data of this study comes from official statistical materials such as “Zoucheng Statistical Bulletin” and “Zoucheng Water Resources Bulletin”.
Competing interests. The authors declare that they have no con-flict of interest.
Special issue statement. This article is part of the special issue “Innovative water resources management – understanding and bal-ancing interactions between humankind and nature”. It is a result of the 8th International Water Resources Management Conference of ICWRS, Beijing, China, 13–15 June 2018.
Acknowledgements. This study was supported by the Na-tional Key Research and Development Program (Grant No. 2017YFC1502405, 2016YFA0601503), the Major Science and Technology Program for Water Pollution Control and Treatment (Grant No. 2018ZX07110001), the National Natural Science Foundation of China (Grant No. 51409270), the Hebei Province Water Scientific Research Project (Grant No. 2015-16), and the IWHR Research & Development Support Program (Grant No. WR0145B732017).
Edited by: Dingzhi Peng
Reviewed by: Dehua Zhu and one anonymous referee
References
Chen, S.-Y.: Variable sets and the theorem and method of optimal decision making for water resource system, J. Hydraul. Eng., 43, 1066–1074, 2012 (in Chinese).
Chen, S.-Y.: Variable sets assessment theory and method of water resource system, J. Hydraul. Eng., 44, 134–142, 2013 (in Chi-nese).
47, 7184–205, https://doi.org/10.1016/j.ecoleng.2015.11.008, 2013.
Simonovic, S. P. and Fahmy, H.: A new modeling approach for wa-ter resources policy analysi, J. Wawa-ter Resour. Res., 35, 295–304, https://doi.org/10.1029/1998WR900023, 1999.
Slobodan, P. S. and Hussamm, F.: A new modeling approach for water resources policy analysi, J. Water Resour. Res., 35, 295– 304, doi:10.1029/1998WR900023, 1999.
Wang, H. and You, J.-J.: Advancements and development course of research on water resources deployment, J. Hydraul. Eng., 39, 1168–1175, 2008 (in Chinese).
Wang, L., Fang, L., and Hipel, K. W.: Basin-wide cooperative wa-ter resources allocation, J. Eur. J. Operat. Res., 190, 798–817, https://doi.org/10.1016/j.ejor.2007.06.045, 2008.
Wang, Y., Dong, S., Wang, D., and Feng, X.: Variable Fuzzy Set Theory to Assess Water Quality of the Meiliang Bay in Taihu Lake Basin, J. Water Resour. Manage., 28, 867–880, https://doi.org/10.1007/s11269-014-0521-6 2014.
Xi, X. and Poh, K. L.: Using System Dynamics for Sustainable Wa-ter Resources Management in Singapore, J. Proc. Comput. Sci., 16, 157–166, https://doi.org/10.1016/j.procs.2013.01.017, 2013. Xi, X. and Poh, K. L.: A Novel Integrated Decision Support Tool for Sustainable Water Resources Management in Singa-pore: Synergies Between System Dynamics and Analytic Hi-erarchy Process, J. Water Resour. Manage., 29, 1329–1350, https://doi.org/10.1007/s11269-014-0876-8, 2015.