Published online March 23, 2015 (http://www.sciencepublishinggroup.com/j/ijbse) doi: 10.11648/j.ijbse.20150301.12
ISSN: 2376-7227 (Print); ISSN: 2376-7235 (Online)
Teaching College Students Principle of Endoscopes
Through an Educational Method of Image Processing
Naoto Suzuki
Dept. of Mechanical Engineering, National Institute of Technology, Numazu College, Numazu, Japan
Email address:
[email protected]To cite this article:
Naoto Suzuki. Teaching College Students Principle of Endoscopes Through an Educational Method of Image Processing. International Journal of Biomedical Science and Engineering. Vol. 3, No. 1, 2015, pp. 5-10. doi: 10.11648/j.ijbse.20150301.12
Abstract:
We gave a lecture regarding the principles of endoscopes to students studying medical engineering. The following was the lecture. The light from the light source passed through the rotating RGB filter, and changed to a red, a green, and a blue light, respectively, and these three colored lights illuminated an object. Each light reflected from the object passed through a lens and was received by the CCD. The light signals were changed into electric signals by the CCD, and the memory recorded the red, green, and blue electric signals. The video processor processed these color signals. And, the image of the object was displayed on the monitor. Next, we gave a lecture about RGB colors to the students. The RGB color model was an additive color model of red, green, and blue light. The model could reproduce a broad array of colors using various ways. To allow the students to experience these principles, we gave the students an experimental subject. We prepared a CCD camera, RGB filters, a power supply code, and a video cable. The CCD camera was a Super Color Camera NA-C2660. The RGB filters were the additive types of Dichroic Color Filters that were manufactured by Edmund Optics, Co. These filters were three of colors: red, green, and blue. The video capture board was an Analog Video Capture Board GV-VCP3R/PCI that was manufactured by I-O DATA Device, Inc. Students were divided into 36 groups with 5-6 students in each group. The students combined the three images photographed with the RGB filters, and performed the image processing. The students compared the RGB values of the combined images with the RGB values of the normal image. They brought the RGB value of the combined image as close as possible to the RGB value of the normal image using the Paint Shop Pro 8 software. Next, the differences in the RGB values between the normal image and the modified image were calculated; the maximum of those values was extracted. According to the results, the number of the groups whose difference of the RGB value were greater than 5 and less than or equal to 10 showed the maximum. Moreover, the group which showed the 2nd value was the group whose difference of the RGB value were less than or equal to 5. In the end, the students could experience the principles of endoscopes and image processing.Keywords: Endoscopes, Image Processing, RGB Color Model, Education Method
1. Introduction
The origin of the endoscope used for viewing the interior of the alimentary system was as a hard gastroscope developed by Adolph Kussmaul in 1868 [1]. This was followed by the development of first flexible gastroscope by Rudolf Schindler and Georg Wolf in 1932 [2]. This flexible gastroscope could be bent approximately 30°. Then, Norbert Henning succeeded in photographing the inside of stomach for the first time [3]. The University of Tokyo and Olympus Corporation developed a gastrocamera which could take photographs inside the stomach in 1950 [4]. At that time, the gastrocamera had following two problems: medical doctors could not directly view a picture of their observations and it took a long time to
obtain the resulting photos.
However, the Fiberscope developed by Basil Isaac Hirschowitz in 1956 resolved these issues [5]. The structure of the Fiberscope had many bundled glass fibers and was flexible with sufficient light volume. Thereby, observation of all digestive organs could be theoretically attained. The fiberscope had a light guide fiber and an image fiber. The light guide fiber was able to illuminate the internal organs using the light from the outside of the body.
The medical doctors were able to observe internal organs directly by using the image fiber. Fortunately, modern technology developed a very small charge-coupled device camera (CCD camera). These small CCD cameras could be put at the tip of the probe.
[6].Unlike the fiberscopes, which directly checked light signals, the electronic videoendoscopes converted electronic signals into images via semiconductor elements and allowed various forms of electronic image processing and analysis. The electronic videoendoscopes often had the CCD camera at the tip of the probe and changed the image into electric signals. These electronic videoendoscopes transmitted the electric signals outside of the body and displayed the images on a monitor.
These electronic videoendoscopes are currently used in the hospital, and are called endoscopes in general [7, 8]. These endoscopes have two monitoring methods. One is the same as a commercial video camera. This method illuminates the object using the white light at the tip of the probe, while the CCD camera photographs the object with a color filter. The other method sequentially illuminates the inside of the body and at the same time rotates the three RGB filters: red, blue, and green. The method combines three images obtained through the red, blue, and green filters [9]. This method is
excellent because of the color reproduction of the medical images, although the circuit composition becomes complicated.
On the other hand, we gave a lecture regarding the principles of endoscopes to students studying medical engineering, as shown in Fig. 1. These principles include the changing of a light signal into an electric signal from red, green, and blue light by the CCD put at the tip of the probe, the processing by the video processor, and the creation of an image on the monitor. In other words, the light from the light source passed through the rotating RGB filter, and changed to a red, a green, and a blue light, respectively, and these three colored lights illuminated an object. Each light reflected from the object passed through a lens and was received by the CCD. The light signals were changed into electric signals by the CCD, and the memory recorded the red, green, and blue electric signals. The video processor processed these color signals. In the end, the image of the object was displayed on the monitor.
Figure 1. The principle of endoscopes.
Next, we gave a lecture about RGB colors to the students [10]. The generic example was the Mathematica function "RGBColor[r,g,b]" that specified an RGB color via three numerical parameters r, g, and b that were supposed to be real numbers in the range of [0,1] [11]. In the old cathode ray tubes, each pixel comprised three luminescent dots. The luminance of these dots was controlled via digital-to-analog converter settings. These were controlled using the r, g, and b values as well. The manufacturer established several things. The "RGBColor[1,1,1]" produced an achromatic beam "white," "RGBColor[1,0,0]" appeared "pure red," "RGBColor[0,1,0]" appeared "pure green," and "RGBColor[0,0,1]" appeared "pure blue." We suitably set the parameters r, g, and b, so we could produce any color. Next, we produced the gamut as defined by the linear combinations with the fractional coefficients of the pure red, green, and blue beams. Well, the RGB color model was an additive color model of red, green, and blue light. The model could reproduce a broad array of colors using various ways. The name of the model came from the initials of the three additive primary colors, red, green, and blue. However, the RGB was a device-dependent color model. The color elements and their response to the individual r, g, and b levels varied from manufacturer to manufacturer over time, so different devices could detect or reproduce differently a given RGB value. That is to say, the RGB values generated from one device were not always the same as the RGB values generated from another device. Therefore, RGB value may not
define the same color across devices without some kind of color management. On the other hand, examples of RGB input devices are color TVs, video cameras, and others. The examples of RGB output devices are computers, video projectors. However, color printers are not RGB devices, but are subtractive color devices. The color printers use a CMYK color model. To allow the students to experience these principles, we gave the students an experimental subject.
2. Methods
2.1. Preparation for the Experiment
We prepared a CCD camera, RGB filters, a power supply code, and a video cable, as shown in Fig. 2.
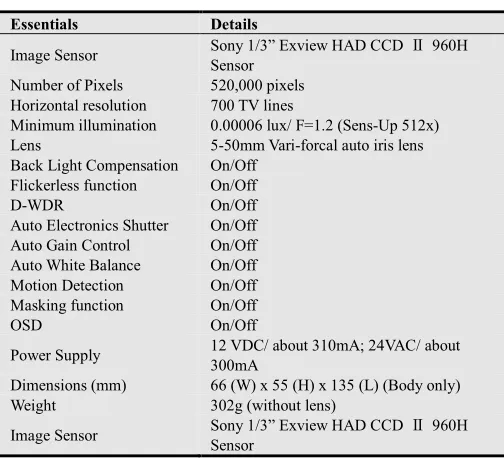
We installed a video capture board in the PC. The CCD camera was a Super Color Camera NA-C2660. Table 1 shows the specifications of the camera.
The RGB filters were the additive types of Dichroic Color Filters that were manufactured by Edmund Optics, Co. These filters were three of colors: red, green, and blue. The video capture board was an Analog Video Capture Board GV-VCP3R/PCI that was manufactured by I-O DATA Device, Inc. The video cable connected the CCD camera and the video capture board. The power supply cable was connected to the CCD camera.
2.2. Photography Experiment
2.2.1. Photography with RGB Filters and Photography without a Filter
We used I-O DATA Video Recorder software. Fig. 3 shows the software's Video Recorder dialog window.
Table 1. Specification of camera.
Essentials Details
Image Sensor Sony 1/3” Exview HAD CCD Ⅱ 960H
Sensor
Number of Pixels 520,000 pixels
Horizontal resolution 700 TV lines
Minimum illumination 0.00006 lux/ F=1.2 (Sens-Up 512x)
Lens 5-50mm Vari-forcal auto iris lens
Back Light Compensation On/Off
Flickerless function On/Off
D-WDR On/Off
Auto Electronics Shutter On/Off
Auto Gain Control On/Off
Auto White Balance On/Off
Motion Detection On/Off
Masking function On/Off
OSD On/Off
Power Supply 12 VDC/ about 310mA; 24VAC/ about
300mA
Dimensions (mm) 66 (W) x 55 (H) x 135 (L) (Body only)
Weight 302g (without lens)
Image Sensor Sony 1/3” Exview HAD CCD Ⅱ 960H
Sensor
Figure 3. Video Recorder dialog.
This software opened a preview window of the display on the PC. The preview window showed the image photographed by the CCD camera. The focus of the camera required adjustment according to the object. The students selected an object for photography and took a photograph of it. Next, the red filter was placed in front of the camera and the image was photographed. The green and blue filters were used for additional photographs like the red filter. They did not move the camera or object at all while they were taking these four photographs, because they had to combine the three images taken with the RGB filters; the students were supposed to compare the combined image with the image photographed without the filters. The image was in a bitmap file format.
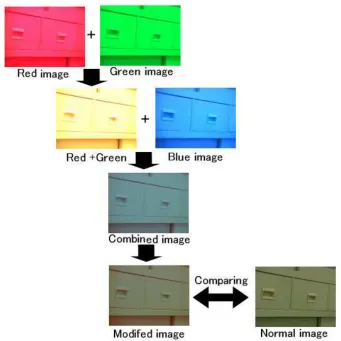
2.2.2. Combination of Three Images Photographed with the RGB Filters
Figure 4. Combination.
The new image was the product of the color data from the two source images. The students called the new image the Red+Green image. Next, the software combined the blue image and the Red+Green image into another new image. This image was called the combined image.
2.3. Modifying the Combined Image
The histogram displayed a graph of the distribution of red, green, and blue values in both the normal image and the combined image, as shown in Fig. 5.The students completed the image processing of the combined image while viewing the histogram so that the combined image looked like the normal image.
Figure 5. Histogram dialog.
The students checked the mean values of red, green, and blue and tried to bring the three mean values of the combined image as close as possible to the three mean values of the normal image.
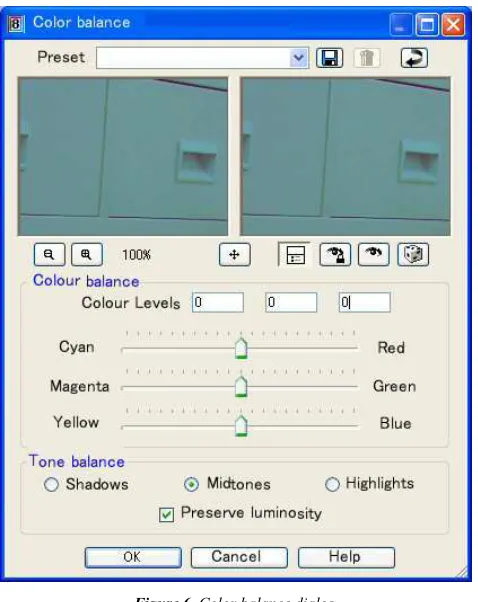
2.4. Adjusting the Color Balance
Figure 6. Color balance dialog.
The percentage was selected for the change of each value in the red, green, and blue editing boxes. A value of 0% indicated
the original value. Adding a positive number added more color. Adding a negative number removed some color. Reducing the amount of blue added a yellow cast to the image. Reducing the amount of green added a magenta cast to the image. Reducing the amount of red added a cyan cast to the image.
3. Results
We gave the subject to the students who were studying medical engineering. Students were divided into 36 groups with 5-6 students in each group. The students combined the three images photographed with the RGB filters, and performed the image processing. The students compared the RGB values of the combined images with the RGB values of the normal image. They brought the RGB value of the combined image as close as possible to the RGB value of the normal image using the Paint Shop Pro 8 software.
Next, the differences in the RGB values between the normal image and the modified image were calculated; the maximum of those values was extracted. Fig. 7 shows the bar graph. The shaded bars demonstrated the maximum difference in the RGB values between the normal image and the modified image, according to the number of groups and were as follows: 5, less than or equal to 5; 10, greater than 5 and less than or equal to 10; 15, greater than 10 and less than or equal to 15; 20, greater than 15 and less than or equal to 20; 25, greater than 20 and less than or equal to 25; 30, greater than 25 and less than or equal to 30; and over 30, greater than 30.
Figure 7. Comparison of the number of groups and the maximum difference in the RGB value (n = 36).
According to the results of Fig. 7, the number of the groups whose difference of the RGB value were greater than 5 and less than or equal to 10 showed the maximum.
Moreover, the group which showed the 2nd value was the group whose difference of the RGB value were less than or equal to 5.
4. Conclusions
We gave the students, who were studying medical engineering, some subjects to study the principles of
endoscopes. The students photographed three images using the RGB filters and combined those images. The image without filters and the combined image were compared. The students brought the RGB value of the combined image close to the RGB value of the normal image, and studied the principles of endoscopes and image processing.
Acknowledgements
very thankful to all those who helped in our research.
References
[1] S. K. Johnson, R. K. Naidu, R. C. Ostopowicz et al., "Adolf Kussmaul: Distinguished Clinician and Medical Pioneer", Clinical Medicine & Research Vol.7, No.3, 2009, pp107-112.
[2] P. K. Schafer, T. Sauerbruch, "Rudolf Schindler (1888 - 1968) - Father of Gastroscopy ", Zeitschrift Fur Gastroenterologie 2004, 42(6), pp550-556.
[3] H. W. Rodgers, "Gastroscopy", Post-graduate Medical Journal, September, 1936, pp383-389.
[4] N. Koga, "Business Focus: Medical Business, Earnings and Growth Drivers", OLYMPUS Annual Report 2013, pp34-37.
[5] B. I. Hirschowitz, "A Personal History of the Fiberscope", Gastroenterology 76, 1976, pp864-869.
[6] H. Tajiri, H. Niwa, "Recent Advances in Electronic Endoscopes: Image-enhanced endoscopy", JMAJ 51(3), 2008, pp199–203.
[7] Texas Instruments, "Endoscopes, Quick Reference Guide", Texas Instruments, 2012, pp1-11.
[8] OLYMPUS, "Endoscopic Devices Products Catalog", OLYMPUS AMERICA, 2011, pp1-176.
[9] A. Ernst, F.J.F. Herth, Principles and Practice of Interventional Pulmonology, Springer, 2013, pp15-25: H. W. Dremel, "General Principles of Endoscopic Imaging".
[10] J.J. Koenderink, "Color for the sciences", The MIT Press, 2010, pp561-645.
[11] S. Mangano, "Mathematica Cookbook", O'Reilly Media, 2010, pp275-371.