Published online November 10, 2014 (http://www.sciencepublishinggroup.com/j/jps) doi: 10.11648/j.jps.20140205.23
ISSN: 2331-0723 (Print); ISSN: 2331-0731 (Online)
Influence of different seed rates on yield contributing traits
in wheat varieties
Ghulam Shah Nizamani
1, *, Shamsuddin Tunio
2, Umed Ali Buriro
2, Muhammad Ibrahim Keerio
21
Plant Breeding and Genetics, Nuclear Institute of Agriculture (NIA), Tando Jam, Pakistan
2
Faculty of Crop Production, Sindh Agriculture University, Tando Jam, Pakistan
Email address:
[email protected] (G. S. Nizamani)
To cite this article:
Ghulam Shah Nizamani, Shamsuddin Tunio, Umed Ali Buriro, Muhammad Ibrahim Keerio. Influence of Different Seed Rates on Yield Contributing Traits in Wheat Varieties. Journal of Plant Sciences. Vol. 2, No. 5, 2014, pp. 232-236. doi: 10.11648/j.jps.20140205.23
Abstract:
A series of field experiments were conducted to determine the influence of different seed rates (100, 125 and 150 kg ha-1) on yield contributing traits of promising wheat varieties viz. Sarsabz, Kiran-95 and TD-1. The maximum germination, spike length and grains spike-1 was observed under seed rate of 125 kg ha-1. The maximum plant population was recorded under seed rate of 150 kg ha-1 in Kiran-95 and highest grain weight spike-1 was noted under seed rate of 100 kg ha-1 in TD-1 variety. While maximum plant height was observed in Sarsabz under seed rate of 125 kg ha-1. The maximum 1000 grain weight was observed under seed rate of 100 kg ha-1 in TD-1; however, highest grain yield was recorded in Kiran-95. The studies about the biological yield revealed that Sarsabz indicated maximum biological yield under seed rate of 125 kg ha-1 and harvest index in TD-1 under seed rate of 150 kg ha-1. Based on the findings, it is concluded that the Kiran-95 at the seed rate of 125 kg ha-1 performed best, followed by TD-1 and Sarsabz which also produced more yield at seed rate of 125 kg ha-1.Keywords:
Seed Rates, Varieties, Yield Attributes, Wheat1. Introduction
Wheat (Triticum aestivum L.) is the most important among all cereals used as a food grain in the world. It ranks first in the world cereal production and is a staple food of about one third of the world’s population [1]. It is the basic staple food for most of the population and largest grain source of the country. Its importance is always recognized when formulating agricultural policies. Wheat contributes 12.5 percent to the value added in agriculture and 2.6 percent to Gross Domestic Products (GDP). Wheat is cultivated in an area of 8666 thousand hectares in 2011-12, showing a decrease of 2.6 percent over last year’s area of 8901 thousand hectares. The production of 23.5 million tons was estimated during July-March 2011-12. The yield per hectare in 2011-12 posted a negative growth of 4.2 percent as compared to 11 percent growth of last year [2]. With the existing semi-dwarf high yielding varieties, there is enormous potential of obtaining higher crop productivity by adopting production technology such as appropriate seed rates, sowing date, N and P rates [3]. Seed rate is considered as an important managementfactor for improved yield of wheat because it is under the farmer's control in most cropping systems [4]. Due to mild and
acceptable flavour, and unique abilities of protein, starch, fat with certain vitamins and minerals, wheat has the exceptional position in the diet of Pakistani people [5].
Pakistan is although, among top wheat producing countries in the world [6], but the average yield of the wheat cultivars grown in the country is much lower than their potential yield [7]. Wheat is planted to a limited extent as a forage crop for livestock and the straw (Bhusa) can be used as a ruminant fodder component or as a construction material for roofing thatch [8]. Joseph et al., [9] concluded that seed rates of 101 to 134 kg ha-1 are sufficient for high grain yield. Various yield components like tillering, spike length, number of grains spike-1 and 1000-grain weight were significantly affected by different varieties and seed rates. The low yield is attributed to many factors viz. sowing patterns, seed rate and varietal potentiality. Yield is the function of many components when that yield relating components have been modified and observed direct influence on the production enhancement viz. optimum seed rate, plant density, climatic condition, soil, sowing time and varieties [10].
yield. Our objective was to determine the influence of seed rates on yield contributing traits in three high yielding wheat varieties.
2. Materials and Methods
2.1. Plant Materials and Details of Experiments
A series of field experiments were conducted at Malir Farm, Sindh Agriculture University, Tando Jam, Pakistan, located at 25o25 o60 o N 68o31o 60 E during three consecutive years i.e. 2007-08, 2008-09 and 2009-10; while the laboratory work was conducted at Nuclear Institute of Agriculture, Tando Jam, Pakistan. Three promising spring wheat varieties
(Triticum aestivum L.); Sarsabz, Kiran-95 and TD-1 were
selected for yield components using different seed rates of 100, 125 and 150 kg ha-1, respectively. The experiments were conducted with three replications in randomized complete block design (Factorial) and plot size of 1.2 x 2 m = 2.4 m2 (2m long 4 rows)during 2007-08, 2008-09 and 2009-2010. Ten plants were selected randomly from each treatment for further observations. A good seedbed was obtained by using land preparation operation to facilitate uniform distribution of seed, fertilizer and irrigation water. Sowing was done with single coulter hand drill on 5th to 12th November in Rabi season. The basal dose of NPK fertilizers at the rate of 140-60-30 kg ha-1 was applied in the form of urea, Di-ammonium phosphate and sulphate of potash, respectively. All P, K and half N were applied at sowing time; while remaining N was equally divided into two splits and applied at first and third irrigation time. First irrigation was applied 25-30 days after sowing and subsequent irrigations were applied as soil and crop requirement. Weed management practices were carried through manual hand control. The soil analysis of experimental areas showed that soil was clay loam in texture, non saline, (pH= 7.2- 7.6), low in organic matter (0.88-0.96%), total nitrogen (0.49-0.57%), available phosphorus (0.86-165 mg kg-1) and exchangeable potassium (248-278 mg kg-1). The minimum mean temperature 17.75oC, maximum 32.38oC and humidity 69.25 % was recorded during Rabi season 2007-08, 2008-09 and 2009-2010.
2.2. Determinations of Yield Contributing Traits
2.2.1. Plant Height (cm)
The plant height was measured from ground level to the tip of the flag leaf at harvest through measuring tape in centimeters.
2.2.2. Plant population (m2)
Plant population (m2) Number of tillers was counted from m2 area at harvest.
2.2.3. Spike Length (cm)
Ten spikes were randomly selected from each treatment. Each spike was measured from the base of spike to the apex to record the spike length in centimeters.
2.2.4. Grains Spike-1
Number of grains spike-1 was counted from ten randomly selected spikes in each replication at harvest.
2.2.5. Grain Weight Spike-1
Weight of grain spike-1 (g) was recorded by using digital electronic balance at harvest.
2.2.6. 1000-Grain Weight (g)
1000-grain weight (g) was obtained at random from each treatment and weighed were taken by digital electronic balance.
2.2.7. Grain Yield (t ha-1)
Wheat bundles of each sub plot were threshed and average grain yield was recorded in kg plot-1 and then converted into t ha-1 at harvest.
2.2.8. Biological Yield (t ha-1)
Wheat bundles of each sub plot were threshed and average biological yield was recorded in kg plot-1 and then converted into t ha-1 at harvest.
2.2.9. Harvest Index (%)
Harvest index of each treatment was calculated by using formula, harvest index = Grain yield/ biological yield x 100.
2.2.10. Harvesting
The crop was harvested during March, 30th to April 15th 2007-08, 2008-09 and 2009-2010.
2.3. Statistical Analysis
The experimental data were recorded and statistically analyzed through Statistix 8.1 computer software (Analytical Software [13], the means were separated using least significant difference (LSD) test. All differences described in the text were significant at the 5% level of probability.
3. Results and Discussions
3.1. Performance of Varieties
production potential under the changing environments in the regions where they have been developed.
Table 1. Performance of different wheat varieties for yield contributing traits.
Plant traits Wheat varieties SE± LSD
(5 %) Sarsabz Kiran-95 TD-1
Germination (%) 94.47 b 96.49 a 94.98 b 0.2660 0.5337
Plant height (cm) 97.05 a 89.52 b 66.21 c 0.4760 0.9552
Plant population (m2) 101.85 b 104.06 a 98.64 c 0.7848 1.5748
Spike length (cm) 11.90 b 12.84 a 11.94 b 0.1775 0.3562
Grains spike-1 39.52 c 44.29 a 43.57 b 0.2708 0.5433
Grain weight spike-1 (g) 2.48 b 2.67 a 2.74 a 0.0359 0.0721
1000 grain weight (g) 41.31 b 44.00 a 44.06 a 0.1527 0.3064
Grain yield (t ha-1) 4.31 c 4.63 a 4.52 b 0.0460 0.0924
Biological yield (t ha-1) 11.84 a 11.54 b 10.50 c 0.0791 0.1587
Harvest index (%) 35.07 c 38.53 b 41.41 a 0.3549 0.7122
Days to heading 72.08 b 77.04 a 69.72 c 0.2110 0.4234
Days to maturity 122.42 b 130.11 a 118.34 c 0.3156 0.6332
Note: In each column, means followed by common letter are not significantly different at 5% probability level.
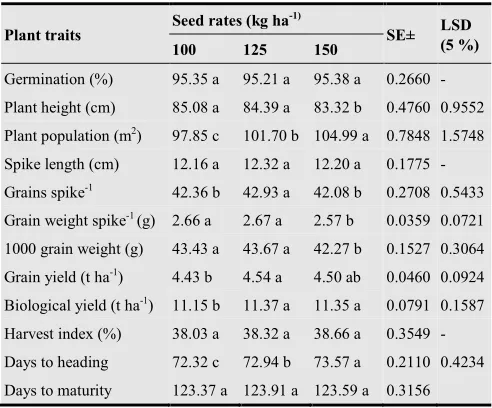
3.2. Influence of Seed Rates
The result regarding agronomic traits shown in Table 2 reveals that seed rate has significant influence on majority of agronomic traits of wheat. Wheat sown at seed rate of 125 kg ha-1 significantly (P<0.05) enhanced the grains spike-1 (42.93) compared to that of sown at seed rate of 150 kg ha-1 (42.08) or 100 kg ha-1 (42.36). Increase or decrease in seed rate from 125 to 150 or 100 kg ha-1, respectively did not show any significant variation (P>0.05) in grains spike-1. In spite of germination and harvest index percent appeared relatively better at higher seed rate of 150 kg ha-1 (95.38 and 38.66%, respectively) than that of 100 kg ha-1 (95.35 and 38.03, respectively) and 125 kg ha-1 (95.21 and 38.32, respectively), the differences between them arise statistically non significant (P>0.05). Similarly the spike length seems to be relatively high at seed rate of 125 kg ha-1 (12.32 cm) compared to that of at 150 (12.20 cm) and 100 kg ha-1 (12.16 cm), they do show statistically non significant differences (P>0.05). Plant population appeared high at higher seed rate of 150 kg ha-1 (104.99 m2), followed by 125 kg ha-1 (101.70 m2) and 100 kg ha-1 (97.85 m2). Grain weight spike-1 and 1000- grain weight (g) were although high at seed rate of 125 (2.67 and 43.67 g, respectively) but statistically similar to that of seed rate 100 kg ha-1 (2.66 and 43.43 g, respectively). Whereas higher seed rate of 150 kg ha-1 revealed remarkably least grain weight spike-1 (2.57 g) and 1000 grain weight (42.27 g) contrast to that of 125 and 100 kg ha-1 seed rates. Seed rate of 125 kg ha-1 produced high grain yield (4.54 t ha-1) and biological yield (11.37 t ha-1), but the high yield for both of these traits seems to be not varied (P>0.05) from that of 150
kg ha-1 seed rate (4.50 and 11.35 t ha-1, respectively), but statistically different (P<0.05) from that of 100 kg ha-1 seed rate (4.43 and 11.15 t ha-1, respectively ). Seed rate at a rate of
100 kg ha-1 revealed early days to heading (72.32) followed by 125 kg ha-1 (72.94) and 150 kg ha-1 (73.57). Although early days to maturity appeared better at seed rate of 100 kg ha-1 (123.37) than that of seed rate 125 kg ha-1 (123.91) and 150 kg ha-1 (123.59), the differences were found to be not significant (Table 2). The findings of this study agree with those reported by Cheema et al., [17] who reported highest wheat grain yield (4293 kg ha-1) with sowing rate of 125 kg ha-1. These results also agree with those reported by Mazurek et al. [18] who reported that lower seeding rates had better yield due to vigorous crop growth. The significance of the effects of seed rates on the growth and grain yield of wheat has also been proved by Sikander et al., [19] and the yield and yield components in wheat were affected significantly by seed rate [20]. Similar results were reported by Naseem et al., [21] and Thakur et al., [22] found that wheat was quite responsive to increased seed rate; the highest seed rate produced greater plant population m2; suggesting 125 kg ha-1 seed rate for achieving good crop growth and higher grain yields.
Table 2. Influence of different seed rates on agronomic traits of wheat
Plant traits Seed rates (kg ha
-1)
SE± LSD
(5 %)
100 125 150
Germination (%) 95.35 a 95.21 a 95.38 a 0.2660 -
Plant height (cm) 85.08 a 84.39 a 83.32 b 0.4760 0.9552
Plant population (m2) 97.85 c 101.70 b 104.99 a 0.7848 1.5748
Spike length (cm) 12.16 a 12.32 a 12.20 a 0.1775 -
Grains spike-1 42.36 b 42.93 a 42.08 b 0.2708 0.5433
Grain weight spike-1 (g) 2.66 a 2.67 a 2.57 b 0.0359 0.0721
1000 grain weight (g) 43.43 a 43.67 a 42.27 b 0.1527 0.3064
Grain yield (t ha-1) 4.43 b 4.54 a 4.50 ab 0.0460 0.0924
Biological yield (t ha-1) 11.15 b 11.37 a 11.35 a 0.0791 0.1587
Harvest index (%) 38.03 a 38.32 a 38.66 a 0.3549 -
Days to heading 72.32 c 72.94 b 73.57 a 0.2110 0.4234
Days to maturity 123.37 a 123.91 a 123.59 a 0.3156
Note: In each column, means followed by common letter are not significantly different at 5% probability level.
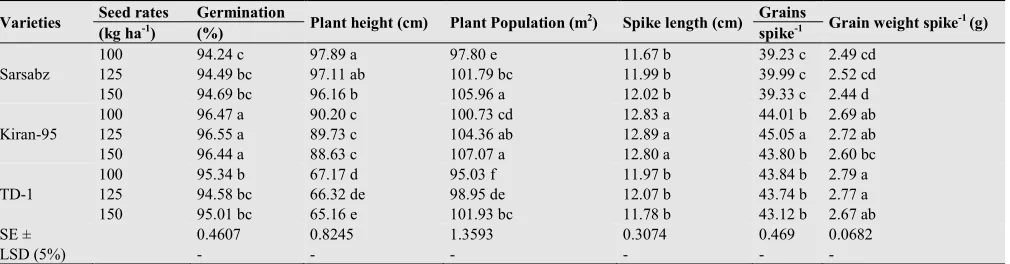
3.3. Interactive Influence of Varieties and Seed Rates
length (11.67 cm), grains spike-1 (39.23) and grain yield (4.25 t ha-1) at seed rate of 100 kg ha-1, and 1000 grain weight (41.38 g), grain weight spike-1 (2.44 g) and harvest index (34.79 %) at seed rate of 150 kg ha-1 were obtained in Sarsabz variety, while minimum biological yield (10.39 t ha-1) and early days to heading (69.36 days) at seed rate of 100 kg ha-1, and plant height (65.16 cm) and days to maturity (117.57) at seed rate of 150 kg ha-1 was observed in TD-1. However, crop sown at a seed rate of 125 kg ha-1 increased the spike length and grain
yield and other parameters. The difference in plant height of the varieties was attributed to difference in their genetic makeup [14, 15]. Similar results were reported by Naseem et al., [21] and Thakur et al., [22] found that wheat was quite responsive to increased seed rate; the highest seed rate produced greater plant population m2; suggesting 125 kg ha-1 seed rate for achieving good crop growth and higher grain yields.
Table 3. Interactive influence of varieties x seed rates on various agronomic traits of wheat
Varieties Seed rates Germination Plant height (cm) Plant Population (m2) Spike length (cm) Grains Grain weight spike-1 (g)
(kg ha-1) (%) spike-1
Sarsabz
100 94.24 c 97.89 a 97.80 e 11.67 b 39.23 c 2.49 cd
125 94.49 bc 97.11 ab 101.79 bc 11.99 b 39.99 c 2.52 cd
150 94.69 bc 96.16 b 105.96 a 12.02 b 39.33 c 2.44 d
Kiran-95
100 96.47 a 90.20 c 100.73 cd 12.83 a 44.01 b 2.69 ab
125 96.55 a 89.73 c 104.36 ab 12.89 a 45.05 a 2.72 ab
150 96.44 a 88.63 c 107.07 a 12.80 a 43.80 b 2.60 bc
TD-1
100 95.34 b 67.17 d 95.03 f 11.97 b 43.84 b 2.79 a
125 94.58 bc 66.32 de 98.95 de 12.07 b 43.74 b 2.77 a
150 95.01 bc 65.16 e 101.93 bc 11.78 b 43.12 b 2.67 ab
SE ± 0.4607 0.8245 1.3593 0.3074 0.469 0.0682
LSD (5%) - - - -
Table 3. Continued
Varieties 1000 grain weight (g)
Grain yield Biological yield Harvest Days to Days to
(t ha-1) (t ha-1) index heading maturity
(%)
Sarsabz
41.38 d 4.25 e 11.66 bc 35.06 d 71.43 d 121.89 d
42.12 c 4.34 de 12.01 a 35.35 d 71.90 d 122.30 cd
40.44 e 4.36 de 11.85 ab 34.79 d 72.89 c 123.06 c
Kiran-95
44.20 a 4.52 bc 11.40 c 37.77 c 76.18 b 129.13 b
44.56 a 4.70 a 11.59 bc 38.73 bc 77.31 a 131.06 a
43.24 b 4.67 ab 11.62 bc 39.11 b 77.63 a 130.14 ab
TD-1
44.71 a 4.52 bc 10.39 d 41.28 a 69.36 f 119.11 e
44.34 a 4.57 a-c 10.51 d 40.88 a 69.59 ef 118.35 ef
43.14 b 4.47 cd 10.58 d 42.07 a 70.21 e 117.57 f
SE ± 0.2645 0.0797 0.137 0.6147 0.3655 0.5466
LSD (5%) - - - 1.0968
Note: In each column, means followed by common letter are not significantly different at 5% probability level.
4. Conclusion
It is concluded that present research showd that wheat sown under seed rate of 125 kg ha-1 had better growth and yield parameters. The interactive influence of Kiran-95 x 125 kg ha-1 seed rate was found superior for achieving higher grain yield, followed by TD-1 and Sarsabz which also produced more grain yield.
Acknowledgements
We thank to Dr. Muhammad Ibrahim Khaskheli for his invaluable technical help and support.
References
[1] H. Iqtidar, Khan M.A. and Khan H. Effect of seed rates on the agro-physiological traits of wheat. Sarhad J. Agric. vol. 26, pp
169-176, 2010.
[2] GOP. Economic Survey of Pakistan. 2011-2012. Ministry of Food, Agriculture and Livestock, Government of Pakistan, Statistics Division (Economic Wing), Islamabad, 2011-12, p. 21.
[3] C.A, Campbell, F. Selles, R.P. Zentner, J.G. Mcleod, and F.B. Dyck. Effect of seeding date, rate and depth on winter wheat grown on environmental fallow in South Western Saskatchewan. Can. J. Plant Sci., vol. 71, pp. 51-61, 1991. [4] G.A. Slafer and H.E. Satorre. Plant density and distribution as
modifiers of growth and yield. In E.H. Satorre and G.A. Slafer (ed.) Wheat Ecology and physiology of yield determination. Food Products Press, New York. 1999, pp. 141-159.
[5] A. Soomro and F.C. Oad. Yield potentials of wheat genotypes under different planting times. J. Applied Sci., vol. 2, 713-714, 2002.
[7] M.A. Arain, M. A. Sial, M.A. Shamadad Khanzada, M.H. Naqvi, M.U. Dahot and N.A. Nizamani. Yield and quality parameters by sowing dates and high temperature stress. Pak. J. Bot., vol. 37, pp. 575-584, 2005.
[8] Kingfisher. The Kingfisher History Encyclopedia. Kingfisher Publications. 2004, pp. 8.
[9] K.D. Joseph, M.M.S.B Alley, D.L. Brann, and W.D. Gravelle. Row spacing and seeding rate effects on yield and yield components of soft red winter wheat. Agron. J., vol. 77, pp. 211-214, 1985.
[10] M.A. Arain, M.A. Sial, M.A. Javed and M.A. Rajput. Genotype environment for grain yield in bread wheat. Proc. Pakistan Acad. Sci. vol. 38, pp. 41-46, 2001.
[11] K. T. Sikander, H. Imtiaz., M. Asif, M.Y. Mujahid, S. Muhammad, M. Qamar and M. Asim. Performance of different wheat varieties/lines as affected by different planting dates and seeding rates under high rainfall area of Potohar. Pak. J. Agri. Sci., vol. 46, pp. 102-106, 2009.
[12] A.M. Khan. Effect of seeding rates and nitrogen levels on growth and yield of wheat. M.Sc. Thesis, Univ. Agri. Faisalabad, Pakistan, 1996.
[13] Analytical Software, 2005. Statistix 8.1 user's manual, Tallahassee, FL.
[14] M.S. Khokhar, M.S. Sheikh, M. Siddique and M.S. Nazir. Effect of different seeding densities and nitrogen levels on the yields of two whet genotypes. Pakistan J. Agric., vol. 6, pp. 150-152, 1985.
[15] A. M. Khaliq, Iqbal and S.M.A. Basra. Optimisation of seeding densities and nitrogen application in wheat cv. Inqalab-91 under Faisalabad conditions. Int. J. Agric. Biol., vol. 1, pp. 241-243, 1999.
[16] B.S. Ahloowalia and M. Maluszynski. Induced mutations - A new paradigm in plant. Euphytica, vol. 118, pp. 167-173, 2001. [17] M.S. Cheema, M. Akhtar and A. Liaquat. Effect of seed rate and NPK fertilizer on growth and yield of wheat variety Punjnad. Pak. J. Agron., vol. 2, 185-189, 2003.
[18] J. Mazurek and A. Sabat. Effect of sowing rate and nitrogen fertilizer application on yield of some triticale cultivars. Pamie hook tnik Pulawski. vol. 83, 85-93, 1984.
[19] K. Sikander, I. Hussain K. Tanveer, M. Sohail, N.S. Kissana and S.G. Abbas. Effects of different planting methods on yield and yield components of wheat. Asian J. Plant Sci., vol. 2, pp. 811-813, 2003.
[20] E. Hameed, W.A. Shah, A. A. Shad, F.H. Taj and J. Bakht. Yield and yield components of wheat as affected by different planting dates, seed rate and nitrogen levels. Asian J. Plant Sci. vol. 1, pp. 502-506, 2002.
[21] K. Naseem, A. R.H. Qureshi, J. Akhtar and M.A. Masood. Screening of wheat (Triticum aestivum L.) genotypes against salinity in solution culture. Pakistan J. Agric. Sci., 37, pp. 1-6, 2002.