http://www.sciencepublishinggroup.com/j/pbs doi: 10.11648/j.pbs.20190803.13
ISSN: 2328-7837 (Print); ISSN: 2328-7845 (Online)
The
Index Predicting Power and Feedback Processing
Characteristics in the WCST
Xia Feng, Chengzhi Feng
*Department of Psychology, Soochow University, Suzhou, China
Email address:
*Corresponding author
To cite this article:
Xia Feng, Chengzhi Feng. The Index Predicting Power and Feedback Processing Characteristics in the WCST. Psychology and Behavioral Sciences. Vol. 8, No. 3, 2019, pp. 72-78. doi: 10.11648/j.pbs.20190803.13
Received: May 5, 2019; Accepted: June 12, 2019; Published: June 26, 2019
Abstract:
Based on the performance of the Wisconsin Card Sorting Test (WCST), participants can be divided into high and low cognitive flexibility groups. The cognitive differences between the two groups need further study. However, studies have grouped participants according to different criteria of the WCST. Based on the classical WCST, the present study investigated two issues in college students: (1) the power of indexes for predicting performance, and (2) the feedback processing characteristics of high and low cognitive flexibility participants. The regression analysis showed TCF (trials to complete the first classification) and PR% (the percentage of perseverative response) were powerful predictors. We further divided participants into high and low cognitive flexibility groups according to the regression equation. Regarding the feedback processing characteristics, we classified all trials in rule-search phase as one of four types: correct-correct (coCO), correct-error (coER), error-error (erER), and error-correct (erCO), which were based on the relationship between the former feedback and the current response. The results revealed that compared with the low cognitive flexibility group, the high cognitive flexibility group could learn effectively from feedback. Differences in the feedback processing ability may be one of the reasons for the differential performance of college students on the WCST task.Keywords:
WCST, Perseverative Response, Cognitive Flexibility, Feedback Process1. Introduction
The Wisconsin Card Sorting Test (WCST) is a well-known measurement task that was formally proposed by Berg et al. in 1948 [1]. It was first used to research the conceptual formation and abstract reasoning in normal people. Since 1963, it has been widely used by clinical psychologists to measure the executive dysfunction [2-3]. In the classical WCST, there are four stimulus cards (a card with one red triangle/two green stars/three yellow crosses/four blue circles) and a stack of 128 response cards. Four stimulus cards are placed on the bottom panel, and a response card is placed on the top panel. Each response card shares one, two or all of three characters (color, form, number of icons) with each of the stimulus cards. Only one character is in effect for each trial. Participants are required to judge which stimulus card shares the current effective character with the response card. Importantly, the effective character is unknown to the participants beforehand, and participants must determine its
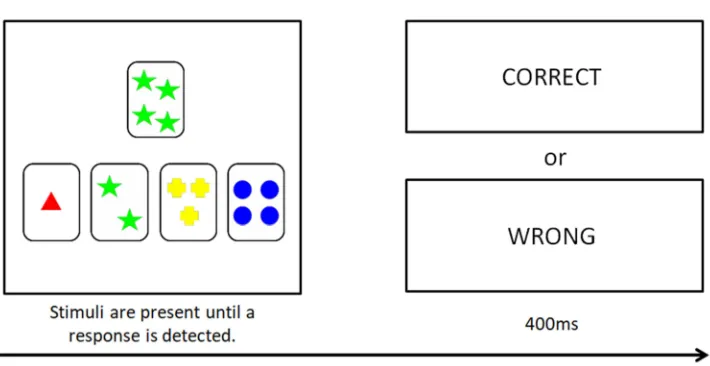
identity based on their previous choices and the corresponding feedback. A positive feedback after the correct classification often means the effective character can be repeated in the next trial, while an error feedback means the previous rule (i.e., the effective character) no longer applies, and a rule transformation is required (as shown in Figure 1). The rule changes after 10 consecutive correct responses without any clue. The test ends until the participant has correctly found the intrinsic rule 6 times or the cost in 128 trials.
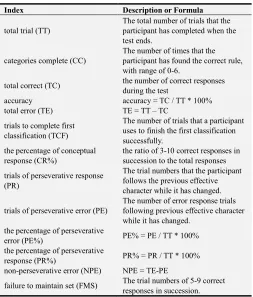
Thirteen measurement indexes have been used in former studies (as shown in Table 1). Two points need further clarification. First, PR refers to the situation where the participant follows the previous rules, while the effective character has changed to another. Since the response card and the stimulus card may have 1-3 identical characters, if they share both the previous and current effective characters and the participant makes a PR, the feedback would be correct, otherwise PR will induce a PE (as shown in Figure 1). Therefore, the value of PR is equal to or greater than the value of PE. Second, FMS means that the participants have found the current effective character, but they cannot complete 10 correct responses in succession. Since previous studies have shown that compared to healthy participants and those without prefrontal damage, patients with prefrontal damage had more PR, many studies used PR to describe abnormal participant performances. Patients with brain injuries are limited to specific concepts and rely on external stimuli, resulting in rigidity and a lack of abstract characteristics as their basic way to deal with the environment [4]. Apparently, it is rare for college subjects to do a number of persistent reactions under the same classification conditions after they have been told the classification is wrong. The abstract thinking of normal subjects enables them to extract features and form the concept of making the environment structured and organized. To date, a few studies have grouped normal participants based on their WCST scores to further compare their performances in other cognitive tasks [5-7]. These studies have grouped participants according to different criteria. In Dong et al., the participants were grouped based on TT (total trials) and PE (trials of perseverative error) [6], in Li and Bai’s study, they focused on TC (total correct trials) and TE (total error trials) [8]. Liu et al. integrated 13 indexes and automatically classified the subjects according to the results of the computer version, which may not avoid the problems caused by collinearity among the indexes [7]. Based on the selected indexes, participants were divided into high and low cognitive flexibility groups and further compared their performance in other tasks, such as the Iowa gambling task, reading scientific essays and working memory task, and a language-switching task. Although their results have shown those with high cognitive flexibility had better performances than those with low flexibility, it is unclear whether all the high/low cognitive flexibility has the same meaning. More consistent operationalization and study of cognitive flexibility will be required [9]. In detail, it is necessary to reveal which indexes are more powerful to be used as the basis for grouping the normal participants before further studies are completed. In other words, we still need to determine which indexes are a good summary of the WCST performance. If an index can predict the performance of the task accurately, we say it is a good index, and we can group participants based on the effective index for further study.
Table 1. The indexes and their meanings in the WCST.
Index Description or Formula
total trial (TT)
The total number of trials that the participant has completed when the test ends.
categories complete (CC)
The number of times that the participant has found the correct rule, with range of 0-6.
total correct (TC) the number of correct responses during the test
accuracy accuracy = TC / TT * 100% total error (TE) TE = TT – TC
trials to complete first classification (TCF)
The number of trials that a participant uses to finish the first classification successfully.
the percentage of conceptual response (CR%)
the ratio of 3-10 correct responses in succession to the total responses
trials of perseverative response (PR)
The trial numbers that the participant follows the previous effective character while it has changed.
trials of perseverative error (PE)
The number of error response trials following previous effective character while it has changed.
the percentage of perseverative
error (PE%) PE% = PE / TT * 100% the percentage of perseverative
response (PR%) PR% = PR / TT * 100% non-perseverative error (NPE) NPE = TE-PE
failure to maintain set (FMS) The trial numbers of 5-9 correct responses in succession.
that the feedback learning characteristics of subjects at different levels are different in the rule search stage. The comparison of feedback learning characteristics between high and low flexibility subjects is helpful to deepen the understanding of WCST, and also provides new ideas for the subsequent research using WCST as a standard to divide the subjects.
The present study therefore used the classic WCST-128 in college students. Two issues were investigated: the power of the main measurement indexes for predicting college participants’ performance, and the feedback processing characteristics of the high and low flexibility groups in the WCST.
2. Methods
2.1. Participants
160 right-handed college students (72 males) participated in our experiment. All of them were recruited through local advertisements. Their average age was 20.67±1.9. None of the participants reported any history of neurological or
psychiatric impairments. All had normal or
corrected-to-normal vision. The study was carried out in accordance with the recommendations of “Ethical standards for experiments in Soochow University, the Ethical Committee of Soochow University” with written informed consent from all subjects. All subjects gave written informed consent. The protocol was approved by “the Ethical Committee of Soochow University”.
2.2. Apparatus and Task
The stimuli were displayed on a 17-inch display with a resolution of 1024×768, a refresh rate of 80 Hz and a 57 cm of sight distance.
In each trial, a reaction card was presented at the top panel of the screen. The panel below that included the selection area, containing 4 different stimulus cards. The participants had to determine which stimulus card was matched with the response card in the selection area by clicking the mouse. After choice, a 400-ms feedback (either correct or wrong) was presented. The participants were told if they chose the wrong one, not to change it, and then try to make the next choice right. Participants were instructed to correctly classify as many cards as possible.
Figure 2. One trial of the task.
3. Results
3.1. Participants’ Main Performance in the WCST
When one participant completed 6 classifications (10 consecutive correct responses each time) or expended 128 trials, the task finished. Among the 160 participants, 106 students completed 6 classifications successfully. The number of participants who completed 0, 1, 2, 3, 4 and 5 classifications was 3, 5, 10, 9, 18 and 9, respectively. The average number of trials cost by the 106 participants who completed the 6 classifications was 97.2.
The larger number of trials required to complete the first classification indicated a poor generalization ability, especially in terms of a poor initial concept formation ability. In all subjects, the minimum value of TCF (trials to complete first classification) was 10, the maximum value was 128, and
the average was 19.8.
The PR (trials of perseverative response) indicated the cognitive transfer ability, and it was the best indicator for the lesion of the frontal lobe in WCST. In our study, the average value of PR was 11.4.
3.2. Measurement of the Predictable Indexes
according to whether they had completed 6 classifications. Their differences in these indexes are shown in Table 2.
Table 2. The differences between complete and incomplete groups in the WCST indexes.
Index 6 classification complete group (n=106) 6 classification incomplete group (n=54) t p Cohen’s d
TT 97.24(15.70) 128.00(.000) 20.17 .000 -2.77
TE 22.61(9.21) 57.19(14.92) 15.58 .000 -2.79
TC 74.62(8.90) 70.81(14.92) -1.73 .089 .31
PE 8.14(2.79) 7.24(5.11) -1.21 .231 .22
PE% 8.47(2.79) 5.66(3.99) -4.64 .000 .82
PR 11.87(4.40) 10.56(7.32) -1.21 .230 .22
PR% 12.30(4.18) 8.25(5.72) -5.11 .000 .81
FMS 0.74(0.96) 1.28(1.46) 2.47 .016 -.44
TCF 13.42(5.58) 32.35(32.78) 4.22 .000 -.81
NPE 14.47(8.99) 49.94(16.71) 14.57 .000 -2.64
CR% .72(.09) .40(.15) -14.66 .000 2.59
TT; total trial responses; TE; total error responses; TC; total correct responses; PE; perseverative errors; PE%; the percentage of perseverative errors; PR; perseverative responses; PR%; the percentage of perseverative responses; CC; classifications completed; FMS; failure to maintain the set; TCF; trials to complete the first classification; NPE; non-perseverative errors; CR%; the percentage of conceptual response.
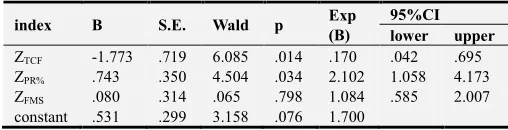
As shown in Table 2, the two groups showed significant differences in 8 of the indexes and marginal differences in the TC. Since many indexes were not independent, we used the method of linear regression analysis to check the collinearity between all 9 indexes. We took these 9 indexes as independent variables and the “complete 6 classification or not” as the dependent variable. According to VIF≤10, 3 indexes were kept: TCF (trials to complete the first classification), PR% (the percentage of perseverative response), and FMS (failure to maintain the set). Next, 100 participants were chosen randomly into the further logistic regression analysis. To further compare the magnitude of the regression effect, we used the Z scores of three independent variables for logistic regression analysis. The dependent variable was also “complete 6 classification or not”. According to the regression result (shown in Table 3), the regression equation was as follows:
Logit P = .531 − 1.773Z + .743Z %
Table 3. The results of logistic regression analysis based on the Z scores of 3 variables.
index B S.E. Wald p Exp (B)
95%CI lower upper
ZTCF -1.773 .719 6.085 .014 .170 .042 .695
ZPR% .743 .350 4.504 .034 2.102 1.058 4.173
ZFMS .080 .314 .065 .798 1.084 .585 2.007
constant .531 .299 3.158 .076 1.700
Based on this equation, we predict the completion of the remaining 60 participants (as shown in Table 4). In detail, 40 of 60 participants completed 6 classification of the WCST, and the equation predicted that 36 of the 40 participants could finish the task. According to the theory of signal detection,
Phit=36/40=.90, and Pfalse alarm=12/20=.60. Therefore,
D’=Z1hit-Zfalse alarm=1.28-0.25=1.03.
1 Z value is acquired on the POZ form.
Table 4. The predicted results of the remaining 60 participants based on the regression equation.
observed predicted
complete incomplete percentage correct
complete 36 4 90%
incomplete 12 8 40%
overall percentage 73%
3.3. The Feedback Processing Characteristics of the High and Low Cognitive Flexibility on the WCST
Back to the processing of WCST, two stages were included: rule-search and rule-application. During rule searching, learners needed to infer the relationship between the stimulus and reaction cards. A variety of processes were involved, such as suppressing previous rules, checking alternative rules, and updating the information according to the feedback information. The present study focused on rule-search stages to explore the possible cause of the performance differences. At the very beginning, learners did not have sufficient awareness of the rules to classify the cards. During the task, the feedback on the last trial was the only information could be used. Previous studies have shown that the efficiency of reasoning controlled the performance of WCST and the low reasoning efficiency was related to lower attention to feedback and integration of the prior and present feedback information [14].
just after the previous correct feedback, erCO refers to a CORRECT response after the previous error feedback, and erER refers to an ERROR response after the last error
feedback. Based on the regression equation [Logit P
.531 1.773Z .743Z %], each participant had a new
value for the task. Sorted by this value, the first 27% of the
participants (160*0.27≈43) were divided into the high
flexibility group, and the last 27% (160*0.27≈43) were
divided into the low group.
The average of the total trials for the low CF (cognitive flexibility) group was 122.98, and 97.28 for the high CF group. The T-test demonstrated a significant difference between them [t(84) = 7.882, p <.000, Cohen’s d = 1.70].
We further compared the feedback processing
characteristics of the high and low cognitive flexibility groups. A mixed-design ANOVA was performed on the ratio of the number of times needed in each feedback combination type to the total trials of the rule-search. The feedback combination type was a within-subject variable, while the group (high vs. low) was a between-subject variable. There were significant effects of feedback combination type [F(3,252) = 38.560, p <.000, η2 =.315] and group [F(1,84) = 18.276, p <.000, η2 =.179] on the ratio. In addition to the main effects, there was also significant interaction between the feedback combination type and the group [F(3,252) = 5.582, p =.001, η2 =.062]. An LSD post hoc test showed the two groups had significant differences in coER [F(1,84) = 36.065, p <.000, η2 =.300] and erCO [F(1,84) = 19.261, p
<.000, η2 =.187]. In detail, during the rule-search phase, the high CF group has a significantly higher percentage of response times in the coER and a lower percentage of response times in the erCO than the low group.
Figure 3. The ratio of response times under four feedback combination types between high and low CF groups.
4. Discussion
4.1. The Predicting Power of Indexes in the WCST
WCST is a classical rule switch task that is widely used to
estimate cognitive flexibility [15-16]. As one of the components of executive function (EF), cognitive flexibility is a composite concept, including many cognitive components [5, 17]. And, cognitive flexibility may be a key factor for improving other dimensions of EF [18]. Before using WCST to group participants for further studies, it is necessary to analyze the effectiveness of WCST indexes in college participants.
Although many indexes are given, they are not completely independent. The study of factor analysis classified the indexes into 1 to 3 factors [19-21]. Our regression analysis showed that TCF and PR% are powerful predictors of one’s performance on the WCST. Why are these two indexes so useful? TCF may be easier to understand. If a participant needs fewer trials to complete the first classification, it is likely that he or she has quickly found the key character (color/form/number) or simply had good luck. That is, the TCF itself is not enough to predict the overall performance. PR% =PR/TT*100%, if one has a high value of PR%, he may also have a large PR and/or a small TT. Based on the regression analysis results, the PR and TT values alone are not predictive variables. The TT was removed for the collinearity with other indexes. Since there was no significant difference in PR between the complete and incomplete groups (as shown in Table 2) and PR%=PR/TT*100%, TT played a great role for the significant difference of PR%. A high PR% may mean that one can find the key character as soon as possible after a certain amount of perseverative responses. It reflects the ability to integrate comprehensive information. It is worth considering why the PE% is not predictive. First, the PE% was removed for the collinearity with the other indexes. Second, the PE is different from the PR in terms of the amount of information available. Take Figure 1 for example. Here, the key character was the number or form after trial 3 in the PR condition. Additionally, if the participant had integrated the information from the previous trial, he or she already knew the form should be the correct character for the next trial. In contrast, in the PE condition, the participant only knew that the selected number was not correct and therefore still did not know the correct key character. Thus, efficient learners may prefer more PRs than PEs.
Of course, there are significant differences in the selection of indexes for different kinds of participants and different research concerns. For example, in schizophrenic patients, the PE had better sensitivity and diversity [22-23]. From the point of the stability of the WCST, PE and TCF were better in the normal and the disease population [24]. Our study focused on determining which indexes could be used for predicting college participant performances in the WCST. Based on the regression analysis, TCF and PR% are powerful predictive factors. If one has a good ability to build an initial concept and integrate comprehensive information, he or she will perform well on the WCST.
4.2. Feedback Processing Characteristics on the WCST
whether high and low cognitive flexibility participants have differences in their feedback processing. Participants who do well on the WCST can be referred to as high cognitive flexibility individuals [6-8]. Based on our previous analysis, TCF and PR% are powerful indexes to describe one’s performance on the WCST. After substituting participants’ original TCF and PR% into the regression equation, everyone had a new value for the WCST. Sorted by this value, the first 27% participants were divided into the high cognitive flexibility group, and last 27% ones were regarded as the low cognitive flexibility group.
The high CF group had a greater proportion of response times in the coER condition. Even if the previous feedback was correct, the high CF group made more wrong choices. This initially sounds counterintuitive; however, what needs to be stressed is that we focus on the rule-search phase. In this phase, participants have no idea about the correct rule. They need to keep trying until they are sure of a classification rule. The high CF group transfers more frequently and has more exploration than the low group. At the same time, although participants of this group generate a higher proportion of mistakes, most of them have successfully entered the stage of rule-application and accomplished the task successfully (for high CF group, 37 to 43 participants accomplished the 6 classifications, while for the low CF group, 11 to 43 participants completed the 6 classifications. Chi-square results showed a significant difference between these two groups [χ2 = 31.873, p <.000]. The number of participants in the high CF group who successfully completed the WCST was significantly higher than that in the low CF group.). Furthermore, they completed 6 classifications with relatively few trials (For the high CF group, the mean total trials they needed were 97.28; the number was 122.98 for the low CF group. A T-test showed a significant difference between the two groups). All of people in the high CF group were more capable of learning from the wrong feedback. Participants in the low CF group are more likely to follow the last reaction rule after correct feedback. Although the proportion of wrong response times after correct feedback was lower than that in the high group, this fails to help them successfully complete the 6 classifications. This result is similar to the findings of a previous study [13]. In their study, avoiding being stuck to the response rule was given because participants could not ignore the previous reward feedback, so researchers analyzed the first four trials in the WCST. During the first four trials, the correct feedback had not been given to the participants, and their choice might purely due to the feedback information. These results revealed that most of the patients could make a win-stay choice after the correct feedback, while many of them could not make a lose-shift choice after the error feedback. The impairment of this basic ability to use feedback information to guide behavior could explain the poor performance of patients on the WCST. When negative feedback was removed from WCST, the performance of individuals with Asperger’s syndrome was enhanced, while was no difference for the control group [25]. In our study, even the participants were all college students, the
differences in the learning ability of the feedback information could also lead to differential performances on the WCST tasks. This inconsistent result may partly due to the different learning phase been referred [11, 26]. Furthermore, the data showed that the low group had a higher proportion of reaction times in the erCO condition. Even if the previous feedback was wrong, the low group made more correct choices than the high CF group in the rule-search phase. It seemed that they had touched the correct rule many times. However, why did not they make more successive correct choices by using the right rule? Actually, many cycles of error-correct feedback types were seen in the data. One possible reason for this observation was that even though they had correct reaction times after the wrong feedback, this reaction was not based on the application of the correct rules after the integration of the error feedback information. In other words, they did not form a stable rule dimension concept according to the previous error feedback. The error feedback information might not be fully integrated and utilized to guide their choice. Just as mentioned in former researches, informative value and valence value were both included in feedback [11, 26-27]. Participants who failed to extract the information value of feedback would receive a lower score in the rule learning task [27].
5. Conclusion
In summary, this study is concerned with the predicting power of indexes in WCST, and the differences of feedback processing characteristics between the different WCST performance levels. Based on the analysis of college students, we found that the TCF (trials to complete the first classification) and the PR% (percentage of the perseverative response) are powerful tools for predicting one’s performance on the WCST. By focusing on the feedback processing characteristics of the rule-search phase, we also found that learners with high cognitive flexibility are better able to learn from feedback. The difference in the feedback processing ability may be one of the reasons for the differential performance of college students on the WCST task.
References
[1] Berg, E. (1948). A simple objective test for measuring flexibility in thinking. The Journal of General Psychology, 39 (1), 15-22.
[2] Milner, B. (1963). Effects of different brain lesions on card sorting -- the role of the frontal lobes. Arch Neurol, 9 (1), 90-100.
[3] Robinson, A. L., Heaton, R. K., Lehman, R. A., & Stilson, D. W. (1980). The utility of the wisconsin card sorting test in detecting and localizing frontal lobe lession. Journal of Consulting and Clinical Psychology, 48 (5), 605-614.
[5] Li, F., & Sun, F. (2017). Feedback based catetory learning: a new task of exploring children's cognitive flexibility. Journal of Psychological Science, 40 (6), 1399-1404.
[6] Dong, X., Du, X., & Qi, B. (2016). Conceptual Knowledge Influences Decision Making Differently in Individuals with High or Low Cognitive Flexibility: An ERP Study. Plos One, 11 (8): e0158875.
[7] Liu, H., Fan, N., Shen, X., & Ji, J. (2013). Effects of cognitive flexibility on language switching in non-proficient bilinguals: an ERPs study. Ata Psychologica Sinica, 45 (6), 636-648.
[8] Li, M., & Bai, X. (2005). A comparative study of the results of working memory and the reading of scientific essays of college students with different cognitive flexibility. Psychological Science, 28 (2), 329-331.
[9] Dajani, D. R., & Uddin, L. Q. (2015). Demystifying cognitive flexibility: Implications for clinical and developmental neuroscience. Trends in Neuroscience, 38 (9), 571-578.
[10] Buchsbaum, B. R., Greer, S., Chang, W., & Berman, K. F. (2005). Meta-Analysis of Neuroimaging Studies of the Wisconsin Card-Sorting Task and Component Processes. Human Brain Mapping, 25, 35-45.
[11] Wang, J., Cao, B., Cai, X., Gao, H., & Li, F. (2015). Brain Activation of Negative Feedback in Rule Acquisition Revealed in a Segmented Wisconsin Card Sorting Test. Plos One, 10 (10), e0140731.
[12] Monchi, O., Petrides, M., Petre, V., Worsley, K., & Dagher, A. (2001). Wisconsin Card Sorting Revisited: Distinct Neural Circuits Participating in Different Stages of the Task Identified by EventRelated Functional Magnetic Resonance Imaging. The Journal of Neuroscience, 21 (19), 7733-7741.
[13] Prentice, K. J., Gold, J. M., & Buchanan, R. W. (2008). The Wisconsin Card Sorting impairment in schizophrenia is evident in the first four trials. Schizophrenia Research, 106, 81-87.
[14] Somsen, R. J. M., Molen, M. W. V. d., Jennings, J. R., & Beek, B. v. (2000). Wisconsin Card Sorting in adolescents: analysis of performance, response times and heart rate. Ata Psychologica, 104 (2), 227-257.
[15] Langea, F., Seera, C., & Kopp, B. (2017). Cognitive flexibility in neurological disorders: Cognitive components and event-related potentials. Neuroscience and Biobehavioral Reviews, 83, 496-507.
[16] Rabin, L. A., Barr, W. B., & Burton, L. A. (2005). Assessment practices of clinical neuropsychologists in the United States and Canada: A survey of INS, NAN, and APA Division 40
members. Archives of Clinical Neuropsychology, 20 (1), 33-65.
[17] Langea, F., Kip, A., Klein, T., Müller, D., Seer, C., & Kopp, B. (2018). Effects of rule uncertainty on cognitive flexibility in a card-sorting paradigm. Acta Psychologica, 190, 53-64.
[18] Buttelmann, F., & Karbach, J. (2017). Development and plasticity of cognitive flexibility in early and middle childhood. Frontiers in Psychology, 8: 1040
[19] Greve, K. W., Brooks, J., Crouch, J. A., & Rice, W. J. (1997). Factorial structure of the wisconsin card sorting test. British Journal of Clinical Psychology, 36 (2), 283-285.
[20] Greve, K. W., Stickle, T. R., Love, J. M., Bianchini, K. J., & Standford, M. S. (2005). Latent structure of the Wisconsin Card Sorting Test: a confirmatory factor analytic study. Archives of Clinical Neuropsychology, 20 (3), 355-364.
[21] Polgár, P., Réthelyi, J. M., Bálint, S., Komlósi, S., Czobor, P., & Bitter, I. (2010). Executive function in deficit schizophrenia: What do the dimensions of the Wisconsin Card Sorting Test tell us? Schizophrenia Research, 122, 85-93.
[22] Li, C. S. R. (2004). Do schizophrenia patients make more perseverative than non-perseverative errors on the Wisconsin Card Sorting Test? A meta-analytic study. Psychiatry Research, 129 (2), 179-190.
[23] Perry, W., & Braff, D. L. (1998). A multimethod approach to assessing perseverations in schizophrenia patients. Schizophrenia Research, 33, 69-77.
[24] Tan, Y., Zou, Y., Qu, Y., & Guo, X. (2002). Stability of commonly used measures in the wisconsin card sorting test. Chinese Mental Health Journal, 16 (12), 831-833.
[25] Broadbent, J., & Stokes, M. A. (2013). Removal of negative feedback enhances WCST performance for individuals with ASD. Research in Autism Spectrum Discorders, 7 (6), 785-792.
[26] Li, F., Wang, J., Du, B., & Cao, B. (2018). Electrophysiological Response to the Informative Value of Feedback Revealed in a Segmented Wisconsin Card Sorting Test. Frontiers in Psychology, 9 (57).