http://www.sciencepublishinggroup.com/j/aff doi: 10.11648/j.aff.20180705.12
ISSN:2328-563X (Print); ISSN:2328-5648 (Online)
Genetic Variability, Heritability and Expected Genetic
Advance in Soybean [
Glycine max
(L.) Merrill] Genotypes
Besufikad Enideg Getnet
Department of Plant Sciences, Gambella University, Gambella, Ethiopia
Email address:
To cite this article:
Besufikad Enideg Getnet. Genetic Variability, Heritability and Expected Genetic Advance in Soybean [Glycine max (L.) Merrill] Genotypes.
Agriculture, Forestry and Fisheries. Vol. 7, No. 5, 2018, pp. 108-112. doi: 10.11648/j.aff.20180705.12 Received: October 27, 2018; Accepted: November 13, 2018; Published: December 28, 2018
Abstract:
Information on the extent and pattern of genetic variability, heritability, and genetic advance under selection are essential to design breeding strategies in the available germplasm of soybean and helps to identify elite genotypes that will be incorporated in to soybean crop improvement programs to address the growing demand of the crop in Ethiopia. Forty-nine soybean (Glycine max (L.) Merrill) genotypes were evaluated in a field study in 7x7 simple lattice design with two replications at Jimma Agricultural Research Center (JARC) with the objective of estimating genetic variability, heritability, expected genetic advance, and to estimate genetic divergence, thereby, to cluster the test genotypes in to genetically divergent classes. The result indicated substantial variations for all the traits evaluated. Analysis of variance revealed that there was statistically significant difference among the forty-nine genotypes for most of the traits studied except root volume and root dry weight. The highest heritability value was recorded for total nodules per plant followed by effective nodules per plant and plant height. Significant wide range of mean values was observed in all the characters evaluated. This indicates that the characters can be improved through selection. The Divergence analysis grouped the 49 soybean genotypes into five which shows crossing between genotypes which fall in to different classes would result in hybrid vigour. The principal component analysis revealed that 6 components have accounted for 79.90% of the total variation among the genotypes.Keywords:
Divergence Analysis, Genetic Variability, Genetic Advance, Heritability, Principal Component Analysis1. Introduction
The magnitude of genetic variability present in a population of any crop species is central to crop improvement which must be exploited by plant breeders for yield improvement. Soybean is economically important and genetically diverse cultivated species. Because the crop is grown in diverse agro-ecological environments, variation in genetic constitution do exist among the various genotypes. This implies the potential for utilizing such variability in crop improvement programs. Soybean (Glycine max (L.) Merrill) belongs to the family Leguminacae, subfamily Papilionoideae, tribe phaseolae, and genus Glycine. It is reported to be domesticated in Asia, probably in north eastern China about 2500 B. C. [13]. Since then, it has spread to different countries in the world and became an established component of world agriculture. According to Agricultural Sample Survey of Ethiopia [2], there are 49,642 private peasant holdings that cultivate about 6,352.5 hectares of land
m.a.s.l. in the country. As a result, varieties suitable for production in the country were recommended or released for general cultivation. This research is therefore undertaken with the objective of estimate the extent of phenotypic and genotypic variability, heritability and the genetic advance expected under selection.
2. Materials and Methods
An investigation study was carried out at Jimma Agricultural Research Center, Jimma, Ethiopia. Forty nine soybean genotypes of diverse genetic origin were evaluated for their genetic parameters. The materials were sown out to the field in simple lattice design with two replications on the main cropping season of 2012.
2.1. The Experimental Site
The experiment was conducted at Jimma Agricultural Research Center of Ethiopian Institute of Agricultural Research. It is geographically located at 70 40’9”N latitude and 36047’6”E longitude at elevation of 1,753 m. a. s. l. in south western part of Ethiopia. It is categorized under tepid to cool sub-humid sub agro-ecology zone of the country. The average annual rainfall is 1,559 mm. The maximum and minimum temperatures are 26.2°C and 11.3°C, respectively. The major soil types of the area are chromic Nitosols and Cambisols in the uplands, whereas Fluvisol is the dominant soil type in the bottom land and almost all soil types have pH less than 5.
2.2. Experimental Design and Management
The experiment was laid out in a 7X7 simple lattice design with two replications. The plot size was three rows of 4m length with 0.6m row spacing i.e. 4m x 0.6m = 4.8m2 .
In order to facilitate the nitrogen fixation process of the roots, rhizobia bacteria (Rhizobium japonicum) were incorporated into the soil uniformly.
2.3. Data Analyses
The data were subjected to statistical analysis of variance as per the simple lattice design for each character by the GLM and ANOVA procedures of SAS [15]. Efficiency of the simple lattice design relative to RCBD was checked and in most of the traits studied the lattice design was found to be more efficient than that of the RCBD. Least Significant Difference (LSD) was used to separate the means.
3. Results and Discussion
3.1. Mean, Range and Estimates of Genetic Parameters
Range and mean values of the 15 characters are shown in Table 1. The 49 soybean genotypes showed wide range of variability for all characters; except pod length and root dry weight. The highest grain yield (3,868 kg/ha) was recorded from TGX-297-6E-1 followed by G01892 (3,735kg/ha) which were higher than the grand mean of the genotypes studied (2,160.00 kg/ha). While low yield (795 kg/ha) was obtained from the genotype PR-160-6.
Table 1. Range, mean, variance, broad sense heritability, genotypic and phenotypic coefficient of variation and genetic advance as per cent of mean for characters of soybean genotypes.
Characters Range Mean ± S.E Mean σ2g σ2e σ2p GCV (%) PCV (%) H2 (%) GA GA (%)
DF 46.00-86.00 64.20±2.55 43.79 7.26 51.05 10.30 11.12 85.77 12.82 19.97
DPS 57.00-97.00 75.62±2.39 44.95 5.66 50.61 8.86 9.40 88.81 13.47 17.81
DM 111.00-148.00 125.74±2.69 42.89 8.04 50.93 5.20 5.67 84.21 13.08 10.40
PH 37.00-120.00 76.78±4.23 240.51 14.97 255.48 20.20 20.81 94.14 32.04 41.73
PPP 26.00-79.00 46.43±4.00 137.30 14.95 152.25 25.23 26.57 90.18 23.70 51.02
PL 3.00-5.00 4.10±0.22 0.24 0.05 0.29 11.83 13.03 82.45 0.93 22.64
BY 19.00-51.00 32.99±3.22 62.48 11.07 73.55 23.96 26.00 84.94 16.20 49.11
TNPP 13.00-98.00 31.53±1.88 175.92 3.42 179.34 42.07 42.47 98.09 27.72 87.91
ENPP 7.00-66.00 21.18±1.91 104.64 3.58 108.22 48.28 49.10 96.69 21.20 100.06
RDW 2.00-5.00 2.92±0.66 0.11 0.48 0.59 11.35 26.30 18.64 0.31 10.67
RV 4.00-16.00 8.02±2.01 0.37 4.85 5.22 7.58 28.48 7.08 0.87 10.81
RBR 4.34-16.00 8.93±1.96 2.67 3.83 6.50 18.27 28.53 41.03 2.99 33.51
HSW 8.00-22.00 12.35±1.97 2.72 3.93 6.65 13.35 20.88 40.86 2.28 18.46
HI 16.80-72.63 38.21±6.38 101.82 43.31 145.14 26.41 31.53 70.15 18.65 48.80
GY 795.00-3868.00 2160.12±14.09 399246.81 189.18 399436.00 29.25 29.26 85.95 1428.4 66.14
DF=Days to 50% flowering, DPS=Days to 50% pod setting, DM=Days to maturity, PlH=Plant height, PPP=Pod per plant, PL=Pod length, BY=Biomass yield, TNPP=Total nodules per plant, ENPP=Effective nodules per plant, RV=Root volume, RDW= Root dry weight, RBR=Root to biomass ratio, HSW=Hundred seed weight, HI=Harvest index, GY=Grain yield. S.E. Mean= Standard error of the mean, σ2g= Genotypic variance, σ2e = Environmental variance, σ2p=
Phenotypic variance, H2 (%) = Broad sense heritability,
GCV (%) = Genotypic coefficient of variation, PCV (%) = Phenotypic coefficient of variation, (%) ECV= Environmental coefficient of variation, GA= Genetic advance, GA (%) = Genetic advance as per cent of mean.
About 57.14 per cent of the genotypes gave above the grand mean of grain yield. If the breeding objective is to improve seed yield, genotypes with high yield in this study
and harvest index showed higher values at with mean of 76.79cm, 46.44, 31.53, 18.29, 32.99g, 8.02g, and 38.12, respectively. The genotype G01853 scored the highest plant height (118.17cm). Therefore, when breeding for higher plant height this genotype should be considered. PR-160-6 scored the highest pod number per plant (79.00) indicating it could be the preferable genotype in breeding for high number of pods per plant.
3.2. Estimates of Variance Components
grain yield, biomass yield, number of pods per plant, plant height, total nodules per plant, effective nodule per plant, days to 50% flowering, days to pod setting, days to maturity and harvest index exhibited high genotypic and phenotypic variances. Phenotypic coefficients of variation (PCV) values ranged from 5.67% for days to maturity to 49.10% for effective nodules per plant, whereas the genotypic coefficients of variation (GCV) ranged from 5.20%
for days to maturity to 48.28% for effective nodules per plant. In addition, PCV values were generally higher than their corresponding GCV values for all the characters considered indicating the importance of environment in the expression of these traits.
According to [3], PCV and GCV values greater than 20% are regarded as high, whereas values less than 10% are considered to be low and values between 10% and 20% to be medium. Based on this delineation, PCV and GCV values were high for grain yield, biomass yield, number of pods per plant, plant height, total nodules per plant, effective nodules per plant, and harvest index. It indicates that selection may be effective based on these characters and there phenotypic expression would be a good indication of genetic potential. The PCV and GCV values were medium for pod length, and days to 50% flowering. The low PCV and GCV values were obtained for days to pod setting and days to maturity indicating lack of adequate variability for these traits which hinders the breeding work for the improvement of these traits.
3.3. Estimation of Broad-Sense Heritability and Genetic Advance
Estimates of heritability in broad sense ranged from 7.08% for root volume to 98.09% for total nodule per plant (Table 1). All the characters except root dry weight, root volume, root to biomass ratio and hundred seed weight had high to very high heritability. The magnitudes of heritability for most of the quantitative characters were moderate to high, except the low heritability of root dry weight and root volume. Genetic advance as percent of mean ranged from 10.48 for days to maturity to 100.06 for effective nodules per plant (Table 5). At this location relatively high genetic advance as percent of mean was recorded for effective nodules per plant (100.06%), total nodules per plant (87.91%), grain yield (66.14%), pod number per plant (51.02%), biomass yield (49.11%), harvest index (48.80%), plant height (41.73%), root to biomass ratio (33.51%) and pod length (22.64%). Medium genetic advance as percent of mean was recorded for days to 50% flowering (19.97%), hundred seed weight (18.46), days to pod setting (17.81%), root volume (10.81%), root dry weight (10.67%) and days to maturity (10.40%).
3.4. Cluster Analysis
Divergence analysis is a technique used to categorize genotypes that are similar into one group and others into a different group. D-square statistics (D2) developed by Mahalanobis [7], has been used to classify the divergent genotypes into different groups. The genetic improvement through hybridization and selection depends upon the extent of genetic diversity between parents.
The genotypes were grouped in to five distinct clusters (Table 2). This indicates the tested soybean genotypes were moderately divergent. The genotypes were distributed in such a way that 21 (42.85%) genotypes were grouped into Cluster I, 14 (28.57%) genotypes into Cluster III, 8 (16.32%) genotypes into Cluster II, 4 (8.16%) genotypes into cluster IV and 2 (4.08%) genotypes into cluster V.
Table 2. The distribution of genotypes into five clusters based on D2 analysis for the 49 soybean genotypes.
Cluster Number of genotypes Genotypes included
I 21 11, H10, G01892, H5, AGS-7-1, G9945, F81-7636-4, JSL1, AGS-3-1, AGS-234, AGS-299-2, PR-145-2,
IAC-6, Essex-1, H2, V1-1, H1, Promoveria, H4, SR-4-3, HS-82-2136
II 8 PR-41(339), IAC-73-5115, Assosa local check 1, G03705, TGX-1895-49-F, H18, Protana, PR-160-6
III 14 Lotus, Clark 63k, PR-149-81-EP, G01853, H14, F82-7629-2, G00391, H3, FB1-7636, G00386, Crowford,
PR-143-(14), SR-4-1, TGX-1895-33F
IV 4 AGS-3, G00141, Davis, AGS-214
V 2 TGX-297-6E-1, Hardee-1
Table 3. Cluster mean for the 15 characters studied.
Traits Cluster I Cluster II Cluster III Cluster IV Cluster V
Days to 50% flowering 64.29 73.00** 64.07 62.75 55.00*
Days to pod setting 72.00 83.88** 73.18 71.50 71.00*
Days to maturity 123.90 136.53** 124.44 123.02 119.65*
Plant height 73.91 92.07** 72.66* 75.20 77.89
Pod number per plant 44.55 58.50** 46.07 57.00 39.50*
Pod length 4.27** 3.88 4.11 3.69* 3.85
Traits Cluster I Cluster II Cluster III Cluster IV Cluster V
Total nodules per plant 31.10 23.94* 34.29 42.38** 25.50
Effective nodules per plant 16.86 16.25 16.79 37.50** 13.50*
Root volume 7.69 8.06 8.93** 7.38 6.25*
Root dry weight 2.85 2.90** 2.64* 2.88 2.75
Root to biomass ratio 9.40 8.83 7.97* 10.08** 8.89
Hundred seed weight 12.75** 11.88 12.36 12.57 11.00*
Harvest index 38.08 37.07 36.57 51.41** 29.44*
Grain yield 2480.00 1158.40* 1746.40 3115.30 3794.50**
**= highest value and *= lowest value
3.5. Genetic Distance Between Clusters
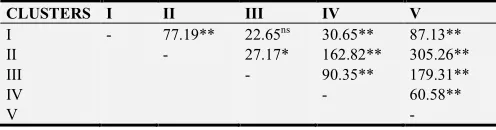
The pair wise generalized squared distance (D2) among clusters is depicted in table 3.
The χ2-test for the five clusters (Table 3) indicated that there was statistically significant difference among the clusters except between cluster I and III (22.65). The maximum distance was found between cluster II and cluster V (D2=305.26) followed by cluster III and cluster V (D2 =179.31), cluster II and cluster IV (D2 = 162.82), cluster III and cluster IV (D2 = 90.35), cluster I and cluster V (D2 =87.13), cluster I and cluster II (D2 = 77.19) and cluster IV and cluster V (D2= 60.58). Increasing parental distance implies a great number of contrasting alleles at the desired loci, and then to the extent that these loci recombine in the F2 and F3 generation following a cross of distantly related parents, the greater will be the opportunities for the effective selection for yield factors.
Crosses involving parents belonging to most divergent clusters are expected to manifest maximum genetic recombination and variation in genetic architecture (Singh et al., 1987). For instance, in the present result, crosses involving parents belonging to most divergent clusters, for example clusters V with cluster II, cluster V with cluster III, and cluster IV with cluster II are expected to provide relatively better genetic recombination and combination in their progenies. However, the selection of parents should also consider the special advantages of each cluster and each genotype within a cluster depending on specific objectives of hybridization.
In most of the cases, genotypes collected from same place of origin fell in to the different clusters and from different places of origin fell in to same cluster.
Regarding to genotypes collected from Ethiopia, at Jimma, those genotypes from Awassa area are distributed in to cluster I (47.36%) and the rest of the genotypes were distributed in to cluster II to cluster V each cluster having 10.52% of the genotypes. Genotypes from Pawe area are also distributed in to different clusters at Jimma. For instance, 40% of the genotypes are in cluster III, 30% in cluster II, 20% in cluster I and 10% in cluster IV. The genotypes from Jimma area are distributed in cluster III and cluster IV each having 66.66% and 33.34%, respectively. The genotype from Assosa area is found in cluster II.
Table 4. Mahalanobis distance between groups of soybean genotypes.
CLUSTERS I II III IV V
I - 77.19** 22.65ns 30.65** 87.13**
II - 27.17* 162.82** 305.26**
III - 90.35** 179.31**
IV - 60.58**
V -
χ2= 23.68 and 29.14 at 5%, 1% probability level respectively.
*, ** Significant at 0.05 and 0.01 probability levels, respectively.
4. Conclusion
Based on the relative squared distance values (D2) between any two genotypes, the 49 soybean genotypes were grouped into five distinct clusters. This indicates that the soybean genotypes were moderately divergent.
The present study generally implied the presence of significant genetic variability among the tested genotypes. Thus, there is an opportunity to bring about improvement through direct selection or hybridization. However, all the above conclusions were derived from results of studies conducted within one season. So, further studies of soybean genotypes with larger sample size in broad environments and seasons should be conducted on soybean variability in order to give confirmative results.
The principal component analysis at revealed six principal components (PCs) having eigenvalues between 1.17 and 4.20 extracted a cumulative of about 79.90% of the total variation noted among the genotypes. It was also noted that differentiation of the genotypes into different cluster was because of a cumulative effect of a number of characters rather than the small contribution of each character.
Phenotypic coefficient of variability (PCV) values ranged from 5.67% for days to maturity to 49.10% for effective nodules per plant, whereas the genotypic coefficient of variability (GVC) ranged from 5.20% for days to maturity to 48.28% for effective nodules per plant. Phenotypic coefficient of variability values were low for days to pod setting, and days to maturity; medium for pod length and days to 50% flowering and it was high for the rest of the characters. Genotypic coefficient of variability values were low for days to pod setting, days to maturity, and root volume; high for grain yield, biomass yield, number of pods per plant, hundred seed weight, plant height, total nodules per plant, effective nodules per plant, and harvest index.
possibility of improving these traits through selection.
References
[1] Asrat A.; Abush T.; Sentayehu A. and Mulugeta A. Food and Forage Legumes of Ethiopia: Progress and Prospects. Proceedings of the Workshop on Food and forage Legumes, 22 – 26 September 2003. Addis Ababa, Ethiopia.
[2] CSA., 2014. Agricultural sampale survey 2013/14. Report on Area and Production of Major Crops (Private Peasant Holdings, Meher Season), Vol. I, Statistical Bulletin 532, Central Statistics Agency, Addis Ababa, pp: 1-124.
[3] Deshmukh, S. NS. S, M. S. Basu and P. S. Reddy, (1986). Genetic variability, character association and path coefficient analysis of quantitative traits in Vignia bunch varieties of ground nut. Indian jour. Agri. Sci. 56: 515-518.
[4] Gutu, B., 2015. Genetic variability and path coefficient analysis for yield and yield related traits in common bean (Phaseolus vulgaris L.). M. Sc. Thesis, Haramaya University, Hararge, Ethiopia.
[5] Jollife, I. T (1986) Principal component analysis, New York: Springer.
[6] Kausar H. (2005). Genetic investigations in segregating populations of soybean (Glycine max (L.) Merrill). M. Sc. (Agri.) Thesis, University of Agricultural Sciences, Dharwad. [7] Mahalanobis, P. C., (1936). On the generalized distance in
statistics. In : Proceedings of National Academy of Science (Indian), 2 : 49-55. Poehlman and Sleeper, 1995.
[8] Malik, M. F. A., A. S. Qureshi, M. Ashraf and A. Ghafoor. (2006). Genetic variability of the main yield related characters in soybean. Inter. Journ. Agri. & Biol., 8 (6): 815-619.
[9] More, A. D. and A. T. Borkar, 2016. Analysis of genetic variability, heritability and genetic advance in Phaseolus vulgaris L. Int. J. Curr. Microbiol. Applied Sci., 5: 494-503.
[10] Narayan, J., 2013. Variability and correlation analysis in diverse genotypes of French bean (Phaseolus vulgaris L.). M. Sc. Thesis, Banaras Hindu University, Varanasi, India.
[11] Negash, K., 2006. Studies on genetic divergence in common bean (Phaseolus vulgaris L.) introductions of Ethiopia. M. Sc. Thesis, Addis Ababa University, Ethiopia.
[12] Prakash, J., R. B. Ram and M. L. Meena, 2015. Genetic variation and characters interrelationship studies for quantitative and qualitative traits in French bean (Phaseolus vulgaris L.) under Lucknow conditions. Legume Res.: Int. J., 38: 425-433.
[13] Poehlman, J. M. and D. A. Sleper, (1995). Breeding Field Crops. 4th ed. Iowa State University Press, Ames, Iowa 50014, USA.
[14] Sardana, S., R. K. Mahajan, N. K. Gautam and B. Ram, 2007. Genetic variability in pea (Pisum sativum L.) germplasm for utilization. SABRAO J. Breed. Genet., 39: 31-41.
[15] SAS Institute Inc., 2008. Statistical Analysis System, Version 9.2. Cary, North Carolina, USA.
[16] Soy Stats (2008). A reference guide to important soybean facts and figures. Available at http://www.soystats.com (verified 03/09/09).