An Assessment Of Product Returns Related To
Non-Conformities In A Chicken Dressing And
Processing Company
Dr. Aile T. Amorado, Jean S. Magtibay, Ramel M. Manaloand Jenica Marie M. Pulmones
Batangas State University, Batangas City, Batangas, Philippines,
Batangas State University, Batangas City, Batangas, Philippines,
Batangas State University, Batangas City, Batangas, Philippines,
Batangas State University, Batangas City, Batangas, Philippines,
Abstract: The study entitled “An Assessment of Product Returns Related to Non-Conformities in a Chicken Dressing and Processing Company” aimed to assess the product returns of the company in relation to non-conformities. Statistical Process Control Tools such as the Pareto Analysis and Cause and Effect Diagram (Ishikawa diagram or Fish-Bone Technique) were used and applied by the researchers to the historical data of their product returns. These tools are incorporated with the 5 Why Analysis in the form of tree diagram. Pareto Analysis was used in order to determine the most occurring product defects or the 80% while the Cause and Effect Diagram was used in determining the causes of product returns. The 5 Why Analysis was also used in order to determine the root causes of product returns. As the study was conducted and performed, the researchers were able to formulate proposed plan of actions in reducing the product returns in which the company may consider for application. It was concluded that man, methods and management of the company are the main reason for the problem. Additional manpower is proposed in order to prevent the accumulation and stack-up of chicken at the tray and repositioning the tray of the chicken are also proposed in order to prevent the throwing movement of the workers. Additional quality tools for awareness such as illustrative charts and graphs installed in different areas wherein workers usually stay and strict supervision are also proposed to the management. On the other hand, materials, machine and environment of the company has a less impact for the product returns. To conclude, all of the aspect of the company contributes to the causes of product returns thus the company must continuously be aware of maintaining and promoting quality.
Keywords: Conformance, Non-Conformities, Process Control, Product Returns.
Introduction
Quality is conformance to requirements so the role of management is to establish requirements, supply the necessary resources and encourage and help employees to be stick to the policy “Doing right things the first time”. The measurement of quality is the price of nonconformance and can account for 20 to 35% of revenues whereas the price for conformance is 3 to 4 %. In this sense, management must identify and determine where the cost of quality occurs to properly address reasons why it occurs.[1] Similarly, it is a challenge to every manufacturing firms to quantify actual cost that can be associated with correction of defects and same with calculating savings that can be associated with eliminating such defects throughout the design and manufacturing stages. Quantifying the cost of correcting defects could help them easily determine the benefits of investment in quality improvement initiatives thus could pursue quality improvement programs. [2] Quality planning like product development plan, the financial plan, the marketing plan and the plans for the utilization of human resources is vital to an organization’s long term business success. It is strategic quality plan of an organization in a way that a huge amount of money, time, and effort will be wasted with fault designs, manufacturing defects, field
area of entire Luzon. The said company supplies them with fresh chilled whole chicken, fresh chilled non-marinated bone-in cut-ups, frozen marinated bone-in cut-ups and deboned meat. They also produces chicken products of this leading food corporation which caters to some of the most popular and biggest names in the fast food industry from which according to their specifications, were ready for breading and frying. The said company adheres and complies with different food processing and food safety guidelines such as ISO 9001 and 22000 – Quality and Food Safety Management Systems (QFSMS), Good Manufacturing Practice (GMP), and other relevant customers and government regulatory. In spite of their compliance and adherence to these different regulatory, the company wasn’t able to control and prevent their product returns. Defect rate is the percentage of products passing through a processing operation that receives defects. It plays a significant role in improving financial capacity of any organization. So it is their concern to strive hard just to decrease the defect rates of product especially in manufacturing process.[5] This chicken dressing and processing company on the other hand, experiences different types of defects. These defects are classified into growing, handling and processing defects. Under the growing defects are scars, bites, blisters, scratches, eruptions, deformities and emaciated. On the other hand, handling defects consists of bruises, hematoma, broken bone and disjointed bone with reddening. Processing defects consists of broken or disjointed bone without reddening, mangled, over scald, cuts and tears, severed parts and under bled. Due to the continuous tallies of product returns caused by these defects or non-conformances, the company wishes to determine the major causes of these defects so as to prevent product returns. Thus, the management along with the researchers came up in assessing their product returns related to non-conformance that allows them to use the different Statistical Process Control Tools such as Pareto Chart, and Ishikawa Diagram or the Cause and Effect Diagram along with Five Why Analysis. The Pareto Charts are tools for organizing the data such as errors, problems, or defects and used mainly to solve problem issues. These charts show the 80% of a firm’s problems are a result of only 20% of the causes. The Cause and Effect Diagram (Ishikawa diagram or Fish-Bone Technique) is a tool for identifying possible locations of quality problems.[6] This diagram is composed of six categories such as man, materials, machine or equipments, methods, management and environment. Through brainstorming process individual causes are associated in each category and wrote down and arranged like bones of a fish. The effect of the analyzed causes is associated to the head of the fish. The Five Why analysis is used to explore the Cause and Effect Analysis. It determines the root cause of a problem or the defect by repeating the question “Why? “. It is also a technique used in the Analyze phase of the Six Sigma DMAIC (Define, Measure, Analyze, Improve, Control) Methodology. The existing process of the company was the first considerations of the researchers to be able to determine the cause of non-conformities. This process starts at the receiving of live birds directly from the farm and followed by hanging of live birds. The next process is Killing where stunning, neck sitting and bleeding occurs and Dressing were scalding, de-feathering, pinning, head pulling and hock cutting occurs. After this processes, Eviscerating occurs where internal organs are being removed then carcass inspection. In this process manual handling is
most present. Then the products go through carcass washing and chilling which prepares it for packaging and crating. Here, products are packed and crated according to format. This is also where the carcass is being sorted out and classified as Class A, B and Squab. This process includes carcass sizing and quality grading. Weighing and turnover are being done before the finished products are delivered. With the success of the study and aid of different Statistical Process Control tools, researchers could help the company in minimizing or eliminating product returns being received. Through this, the company will not only be able to control and improve the good quality of their products but they can also reduce their cost by every returned product. Several studies that used process control tools for process improvement were considered by the researchers in their study. In the study of Ahmad, M., and Ahmad, N. [7]entitled “ An Application of Pareto and
Cause-and-Effect Diagram (CED) For Minimizing Rejection of Raw Materials in Lamp Production Process” the operational wastage like in raw materials was reduced through the use of Pareto and CED. Using Pareto, the researchers identified different defects and classified these defects according to their significance. To determine the possible root causes of rejection, the CED was employed as a useful tool. By this method causes of specific problem or defect were identified, sorted, and displayed for thorough analysis. The study of
Doshi, J., Kamdar, J., Jani, S. and Chaudhary, S. [8] with the title “Root Cause Analysis Using Ishikawa Diagram For Reducing Radiator Rejection” mentioned first the importance of Fishbone or Cause-and-Effect Diagram. Then under data analysis and by using Fishbone or Cause-and-Effect Diagram the researchers found out that problem of fin opening in radiator although in good amount needs immediate action. There were also other problems found and considered important but with less contribution to overall rejection. In the study of Casiquin, Eusebio and Lim [9]
which entitled “A System Studyon the Credit Investigation Process in Union Bank of the Philippines “where the problem was analyzed by selecting the root causes using tools such as Ishikawa, Pareto and the Five Why analysis. The study of Souza and Campos[10] entitled “Evaluation of Turbidity Measuring Instruments Using Statistical Process Control” used control charts to reduce the variability of the process. In this study statistical analysis and graphic measurement system were accomplished by using control charts like the average chart and range chart to monitor the results of the quality characteristics measured by the measuring instruments. And lastly, the study of Abid et al. entitled "How to Minimize the Defects Rate of Final Product in Textile Plant by the Implementation of DMAIC Tool of Six Sigma” was also used because the main focus of the study is to eliminate defects acquired in the process.
Objectives of the Study
The main objective of the study is to assess the product returns related to non-conformities in a chicken dressing and processing company. In order to meet the main objective, the researchers considered the following specific objectives. 1. To quantify the different types of product returns of the
company from January to June 2012 operation. 2. To apply Pareto Analysis in evaluating product returns. 3. To identify the causes of product returns in relation to:
3.2.Method 3.3.Management 3.4.Machine 3.5.Materials 3.6.Environment
4. To propose plan of actions in order to reduce the product returns related to non-conformities.
Research Design
The study employed the descriptive method of research. Descriptive research involved the collection of historical information of product returns of the company in order for the researchers to solve the problem concerning the current status of the company with regards to the continuous tally of product defects. Applications of Statistical Process Control tools such as Pareto Chart helped the researchers determine the major type of product defects on where to give extra effort and prioritization. Also, Cause and Effect Diagram assisted the researchers categorize the potential causes of product returns and achieved through the aid of brainstorming and 5 Why’s Analysis to identify its root causes. Interviews with the concerned officials and personnel, observations to the production and facilities and collaborations with the company were administered and conducted to substantiate the method and to further enrich the analysis and interpretation of the data.
Subject of the Study
The main focus of the researchers in the study is product returns of the said company. The plant manager and the workers of the company, on the other hand, are the main source of the researchers for the information needed in the success of the study.
Data Gathering Instrument
The major instrument that was used by the researchers to gather information in the study was the interview guide questions. Aside from interview guide questions, observations in the production and facilities for several days were also conducted in order to meet the objectives of the study. After the researchers formulated the interview guide questions that helped them in determining the causes of product returns present to man, machine, method, management, materials and environment aspects, it was checked and validated by the adviser and several panels. The results of interview conducted between the plant manager of the company and the researcher was analyzed and interpreted. Historical data of product returns was produced by the management and was used by the researcher as an instrument in determining the major types of product returns that must be given extreme focus and prioritization. The data was processed to be used as the major data for Pareto Diagram and Analysis. It was used to identify the most significant factors, to show where to focus efforts, and to allow better use of limited resources. On the other hand, Cause and Effect diagram is used as an aid to visually display the many potential causes for a problem or effect. It was achieved by the use of 5 Why’s Analysis and severe brainstorming.
Data Gathering Procedure
Permission was sought from the concerned authorities for the study to be carried out with necessary permits and letters. Outside the campus researches for related studies and data
were also conducted. Interviews and brainstorming to the management of the company were performed. It was the help of formulated interview guide questions that was validated by the adviser and approved by several panels that assisted the researchers meet the objectives of the study. Observations to the process of production and facilities were also performed for support system of the interview. The data and information that was gathered were treated on the process of the different statistical process control tools mentioned in the data gathering instrument. The researchers considered the use of Pareto Chart and Cause and Effect Diagram in determining the major causes of product returns. The reliability of the output was checked and validated with the help of the adviser.
Statistical Treatment of Data
Percentage and cumulative percentage of defect types were computed to be used in Pareto Analysis. Statistical Process Control tools such as Pareto, Ishikawa or Cause and Effect Diagram including the 5 Why analysis were used in the analysis of data to meet the objectives.
Results and Discussions
1. Amount of the different types of product returns of the company from January to June 2012 operation.
The tallied and quantified product returns, computed percentage and its cumulative percentage were presented in Table 1. Researchers presented the data in a table format in order to visualize and interpret the information clearly and correctly. In addition, it was arranged in decreasing manner in order to easily pinpoint the most frequent product returns that occur as well as the least frequent product returns that occur in January 2012 to June 2012 operation. This time span was considered in the study because of the complete records of defects provided by the company to the researchers.
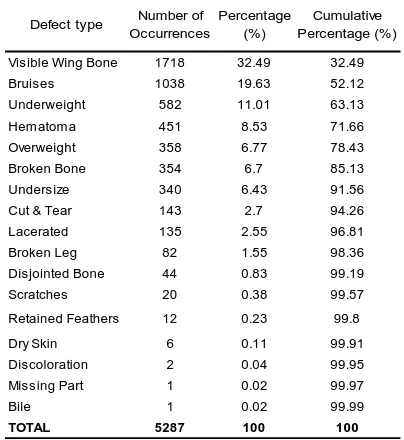
Table 1: Number of Occurrences, Percentage and Cumulative Percentage of Types of Defects Resulting to
Product Returns from January to June 2012
Source: The Company
Defect type Number of Occurrences
Percentage (%)
Cumulative Percentage (%)
Visible Wing Bone 1718 32.49 32.49
Bruises 1038 19.63 52.12
Underweight 582 11.01 63.13
Hematoma 451 8.53 71.66
Overweight 358 6.77 78.43
Broken Bone 354 6.7 85.13
Undersize 340 6.43 91.56
Cut & Tear 143 2.7 94.26
Lacerated 135 2.55 96.81
Broken Leg 82 1.55 98.36
Disjointed Bone 44 0.83 99.19
Scratches 20 0.38 99.57
Retained Feathers 12 0.23 99.8
Dry Skin 6 0.11 99.91
Discoloration 2 0.04 99.95
Missing Part 1 0.02 99.97
Bile 1 0.02 99.99
Table1 showed the different defect types, it was based on the company’s validation result that was complained and returned by their various customers. Visible wing bone contributes a large factor on product returns. It accumulated 1718 returns. The visible wing bone contributed 32.49% of the total percentage of the product returns. This defect was followed by defect types such as bruises and underweight accumulating 1038 and 582 returns respectively in which also contributed a large sum on product returns. Bruises contributed 19.63% to the overall product returns while underweight contributes 11.01% of the total product returns. Visible wing bone, bruises and underweight were considered in this data analysis as the major cause of product returns. It was also visible that defects like dry skin, discoloration, missing part and bile contributed small sum on product returns. In this data analysis, these defect types, dry skin, discoloration, missing part were considered as the minor cause of product returns since it only contributed a little number of frequencies of product returns.
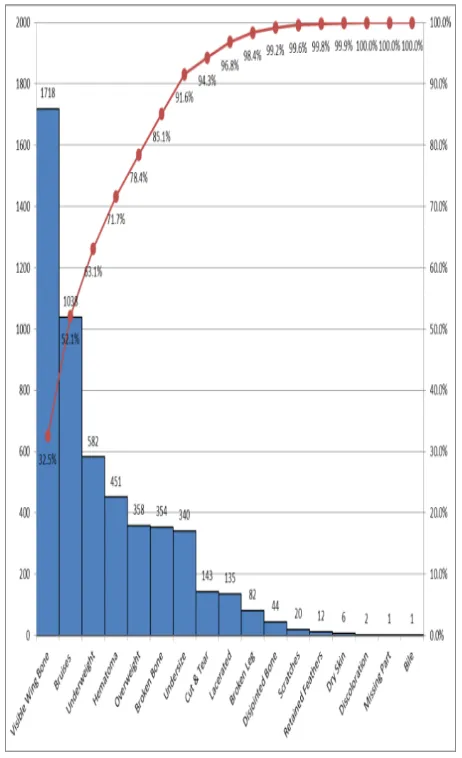
2. Evaluation of product returns through Pareto Analysis
In the application and analysis of Pareto principle, it showed that visible wing bone, bruises, underweight, hematoma and overweight belong to the 20% of the causes that results to the 80% of the problem which is product returns.
Figure 2: Pareto Diagram of the Total Frequency of Product Returns of the company from the Month of January
2012 to June 2012
With these findings it can be said that the following defects must be given a closed monitoring, extreme focus and inspection on where it is occurring. Likewise, prioritizing solution to the leftmost product defect or the 80% can have a great impact on the reduction of the product returns.
3. Identification of the causes of product returns in relation to:
3.1. Man 3.2. Method 3.3. Management 3.4. Machine 3.5. Materials 3.6. Environment
The different types of product defects are classified in to growing, handling and processing defects. In the application of Statistical Process Control tool particularly the Cause and Effect Diagram, the researchers were able to determine the causes of product defects in relation to different aspects such as man, machine, methods, management, materials and environment.
Figure 3: Cause and Effect Diagram
Based on the researcher’s brainstorming and interview to the plant manager as well as observation in the production area, the researchers were able to determine the different causes of defects that results to product returns. Man, methods and management are the main cause of the problem which is product returns while machine, materials and environment are minor causes of product returns.
4. Proposed plan of actions in order to reduce the product returns related to non-conformities.
The researchers with their assessment on the problem of the study came up with the following proposed plan of actions. A. Workers have different ways of hanging the chicken.
Strict supervision to the workers assigned in this process must be conducted in order to prevent product defects. Workers must be provided with regular trainings focusing in quality issues.
throwing. The tray must be slightly elevated and be near to the classifier so that there will be no throwing action. C. Additional workers for transferring the chicken to the
crates were also proposed so that bottleneck or the accumulation and stack up on tray will be prevented. D. Existing quality awareness that was carried out by the
company still need promotional activities in order to maximize its benefits. Installing visual aids in presenting the do’s and don’ts procedure in different areas of the production may be provided by the company. Illustrative charts and graphs showing the status of the quality of product and performance of employees can make workers aware of the quality issues.
E. Based on the Operations Standard of the company, overweight and underweight of chicken are classified into growing defects. Overweight and underweight are charged to their client but this defect may also affect the company’s credibility and reputation. A more regulated calibration of weighing scale must be performed by the company.
Conclusions
After the study has been analyzed the researchers came up with the following conclusions.
1. The growing of chicken and handling of chicken are the main reason for these product returns.
2. Customers of the company frequently complained the visible wing bone defect. In addition to the complaints and returns are the Bruises, Underweight, Hematoma and Overweight. These causes must be given prioritization and must solve first in order to have great decrease in product returns.
3. Man category is the main cause of product returns of the company. It is followed by method performed inside the production and management of the company. Next to this are the machine and materials of the company. Least to this category is the environment category.
Recommendations
The following recommendations were formed in the study. 1. The management of the company must be vigilant in
monitoring the production area especially the handling and processing of the chicken since it is the main cause of the problem which is product returns.
2. Workers of the company especially those assigned in areas where extreme noise are generated particularly the classification area must be provided with ear plugs or ear buds.
3. A proper waste water treatment must also be the focus of the company in order to eliminate the bad odor of the working environment may it be inside or outside the production area.
4. The management of the company must consider the removal of re-hanging process by having a continuous moving shackle for chicken.
References
[1]. Crosby, P. Four Absolutes of Quality Management and 14-Step Quality Improvement Plan.Quality Management System Handbook for Product Development. pp. 2 – 3, 2005. (book style)
[2]. Olivier, D. and Singer, N. Assessing the Cost of Poor Quality: Medical Device and Diagnostic Industry, 2007. (General internet site)
[3]. Montgomery, D. Management Aspects of Quality Improvement. Introduction to Statistical Quality Control.pp. 16 – 17, 2009. (book style)
[4]. Sissonen, J.Poka – Yoke for Mass Customization. The Principle of Poka-yoke Methodology, 2008. (General Internet site)
[5]. Abid, M., Rehman, A., and Anees, M. “How to Minimize the Defects Rate of Final product by the Implementation of DMAIC Tool of Six Sigma. University of Boras.School of Engineering.Swedent.Thesis number 17, 2010. (technical report style)
[6]. Heizer, J. and Render, B. Knowledge of TQM Tools. Operations Management.pp. 232-236, 2011. (book style)
[7]. Ahmad, M. and Ahmad, N. An Application of Pareto and Cause-and-Effect Diagram (CED) For Minimizing Rejection of Raw Materials in Lamp Production Process, 2011.(General Internet site)
[8]. Doshi, J., Kamdar, J., Jani, S. and Chaudhary, S. Root Cause Analysis Using Ishikawa Diagram for Reducing Radiator Rejection, 2012. (General Internet site) [9]. Casiquin, A.,Eusebio, M., and Lim, F. A System Study
on the Credit Investigation Process in Union Bank of the Philippines.Thesis Archive.De La Salle University, 2012. (technical report style)
[10].Souza, L. and Milton, C. Evaluation of Turbidity Measuring Instruments Using Statistical Process Control. Ciencia e Agro Technologia Vol. 36 No.4, 2012. (journal)