O R I G I N A L A R T I C L E
Open Access
Improving the Glossiness of Cooked Rice,
an Important Component of Visual Rice
Grain Quality
Seul-Gi Park, Hyun-Su Park, Man-Kee Baek, Jong-Min Jeong, Young-Chan Cho, Gun-Mi Lee, Chang-Min Lee,
Jung-Pil Suh, Choon-Song Kim
†and Suk-Man Kim
*†Abstract
Background:Rice is one of the few cereals consumed as a whole grain, and therefore the appearance of the final milled product, both before and after cooking, strongly influences the consumer’s perception of product quality. Matching consumer preference for rice grain quality is a key component of rice variety development programs, as the quality drives demand, which in turn drives variety adoption, market price, and profitability. The quality of cooked rice is normally evaluated indirectly, through measurement of key elements driving quality as well as more directly by sensory evaluation, but remains a complex trait conditioned by the genetic complexity of factors driving quality, changes wrought by environment, and the complexity of consumer preferences.
Result:In this study, we evaluated 17 traits, including the taste value obtained by glossiness of cooked rice (TV), to explain rice eating quality by statistical methods and identified QTLs associated with TV. To explain the correlation among traits, exploratory factor analysis was performed for 2 years. The overall eating quality (OE) was correlated with TV and protein content loading at the same factor (PA1) in 2017, and there was a relationship between the OE (PA1) and the TV (PA2) in 2018 (PA1:PA2, r= 0.3). In QTL analysis using 174 RILs, three QTLs for TV derived from Wandoaengmi6 were detected on chromosomes 4, 6, and 9. The QTLqTV9delimited within Id9007180 and 9,851, 330 on chromosome 9 was detected in both years, explaining approximately 17% of the variation, on average. Through the use of fine mapping,qTV9 was delimited to an approximately 34-Kbp segment flanked by the DNA markers CTV9_9 and CTV9_13, and nine ORFs were listed in the target region as candidate genes associated with TV. In the evaluation of qTV9’s effect on OE, the lines with qTV9 showed a significant increase in correlation coefficiency compared to the negative lines. These data will apply to functional analysis on the glossiness and the MAS breeding program to improve the eating quality ofjaponicaas a donor line.
Conclusion:In this paper we report a number of QTL associated with changes in glossiness of cooked rice, and these may have utility in the development of MAS in breeding programs with a specific focus on cooked grain quality.
Keywords:Eating quality, Glossiness of cooked rice, Palatability test, QTL, MAS, Rice
Background
Rice (Oryza sativa L.) is grown in more than one
hun-dred countries worldwide and is the most widely con-sumed main daily staple for more than 50% of the global population, especially in Asia. The quality of rice used for eating and rice yield potential is one of the main
goals of rice breeding programs. Indeed, the market de-mand for eating quality is continuously increasing around the globe because it is the most important factor
in determining the market price (Aluko et al. 2004).
However, the genetic complexity of eating quality and the difficulty in accurate evaluation practically constrain how to improve the eating quality in rice breeding pro-grams operated by conventional breeding techniques (Lestari et al.2009; Rebeira et al. 2014). Moreover, sub-jective factors, such as eating culture or dietary habits,
© The Author(s). 2019Open AccessThis article is distributed under the terms of the Creative Commons Attribution 4.0 International License (http://creativecommons.org/licenses/by/4.0/), which permits unrestricted use, distribution, and reproduction in any medium, provided you give appropriate credit to the original author(s) and the source, provide a link to the Creative Commons license, and indicate if changes were made.
* Correspondence:[email protected]
†Choon-Song Kim and Suk-Man Kim contributed equally to this work.
postharvest practices, and cooking methods, were in-volved in assessing the taste of rice (Izumi et al. 2007). The facts made it more difficult to develop rice varieties with high eating quality. In this case, molecular technol-ogy could be suggested as one solution to address the constraints caused by genetic complexity or selection in-accuracy (Ebadi et al.2013; Yun et al.2016).
Based on various factors associated with eating quality, an understanding of consumer preference caused by dif-ferent backgrounds is also required if improvements are
to be made (Champagne et al.2014; Windham 2014). In
the sensory properties of the rice sub-speciesindica,rice aroma is one of most important preferences in deter-mining rice quality (Suwannaporn and Linnemann
2008). Aromatic rice, e.g., Jasmine and Basmati rice, ac-count for 14% of the global rice trade, and these rice types sell at higher prices due to their unique flavor and texture (Childs and Livezey2006). However, a glossy ap-pearance and a soft and sticky texture are preferred
fac-tors when consuming japonica rice in temperate Asia
(Takeuchi et al.2007).
Eating quality could normally be assessed by direct and indirect evaluation methods. The factor directly re-lated to rice eating quality is determined by a palatability test using the sensory properties of cooked rice, such as aroma, appearance, sweet taste, and texture (Ramesh et al.2000; Bett-garber et al.2001). Therefore, the palat-ability test by trained panels is the most appropriate evaluation system. However, the results of sensory evalu-ation are often inconsistent, even among the same sam-ples, and show less selection efficiency when performed at early generation, in which genetic segregation can still
occur (Wada et al. 2008; Yun et al. 2016). Then, the
physicochemical characteristics, such as alkali spreading value (ASV), amylose content, and protein content, and the glossiness of cooked rice and the rice starch viscosity (RVA) profile have been suggested and used as an indir-ect method to estimate rice eating quality (Juliano1971; Bao et al.2000; Kobayashi et al.2008; Wada et al.2008). Starch viscosity and thermodynamic properties are add-itional properties for evaluating eating quality. Through physicochemical evaluation, studies of eating quality have been performed to identify traits such as amylose content (He et al.1999; Tan et al.1999; Bao et al.2000), protein content (Juliano 1971; Bao 2004), glossiness of cooked rice using a Toyo taste meter (Lestari et al.2009; Yun et al.2016) and textural characteristics (Wada et al.
2006; Hsu et al. 2014). The methods have mainly
fo-cused on describing eating quality by identifying the cor-relation among the indirect traits.
Recently, several studies have been carried out to iden-tify the QTLs for eating quality, focusing on these indirect traits because the use of molecular marker technology can contribute to the elucidation of the complexity of
quantitative traits or the inheritance of eating quality in rice. Wang et al. (2007) identified 26 QTLs in 2 years to analyze the genetic basis of the cooking and eating quality of rice as reflected by 17 traits. The results revealed that
the Wx locus also affects the ASV, while the Alk locus
makes minor contributions to gel consistency and some paste viscosity parameters. Takeuchi et al. (2007) reported that four QTLs on the short arm of chromosome 3 and five QTLs on chromosome 6 were mapped and clustered at the same region of the QTLs for amylose content. To reveal the genetic regions controlling the eating quality of
japonica rice Koshihikari, QTL analysis was conducted
using 92 RILs indicating 43 QTLs on 16 regions across all chromosomes except chromosome 5. The results showed that 37 QTLs from Koshihikari alleles increased the eating quality, 8 QTLs affected the textural characteristics of cooked rice and 3 QTLs affected the amino acid ratio of polished rice (Wada et al.2008). Using 144 RILs derived
from a cross of indicacombinations, 54 QTLs related to
cooking and eating quality were detected for the investi-gated traits, suggesting that most of the QTLs for the tested traits were clustered close to and controlled by the
Wxlocus and Alk on chromosome 6, respectively (Ebadi
et al. 2013). The QTLs associated with 12 grain quality
traits were identified using 96 introgression lines (IL) de-rived from a cross between anO. sativa japonicacultivar
and O. rufipogon. Most detected QTLs clustered near
qDTH6 for heading date on chromosome 6, including
qGCR9 for the glossiness of cooked rice on chromosome
9 (Yun et al. 2016). By association mapping usingindica
multi-parent advanced generation intercross (MAGIC) lines, 16 QTLs for ten physicochemical properties were identified related to eating quality inindicarice, and nine QTLs on chromosome 6 suggested that GBSSI impacts the overall eating quality (Ponce et al.2018).
In this study, we evaluated 17 traits related to rice
eating quality for 2 years using the RIL with a japonica
genetic background. Based on the results, correlation analysis was performed to identify the relationship be-tween the glossiness of cooked rice and rice eating qual-ity. In the QTL analysis, the QTLs for the tested traits were identified and anchored on the rice chromosomes. In addition, the target region was further narrowed down by fine mapping using the derived cleaved ampli-fied polymorphic sequence (dCAPS) marker, and the se-lected QTL introgression lines indicated increasing degrees of OE and TV. The marker developed in this
study would be useful for developing japonica cultivars
with improved eating quality based on glossiness.
Results
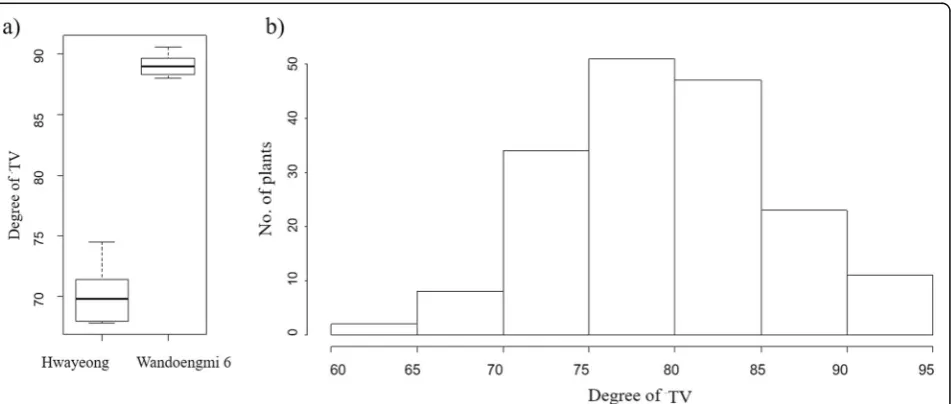
Evaluation on the TV of Parents and Development of RILs
was evaluated using the TOYO meter (Fig. 1a and Add-itional file 1: Figure S1). From the result on the TV of Wandoaengmi6, the median was 88.9, and the interquar-tile range (IQR) was from 87 to 89, while the corre-sponding values of Hwayeong were relatively low
(median = 70, IQR = 67–72). For further study, the 174
RILs were developed by SSD, and the distribution of the
TV was analyzed in the RILs (Fig. 1b). The histogram
exhibited approximately normal distributions in the population with transgressive segregation.
Range of Variation for Tested Traits in Parents and the Population
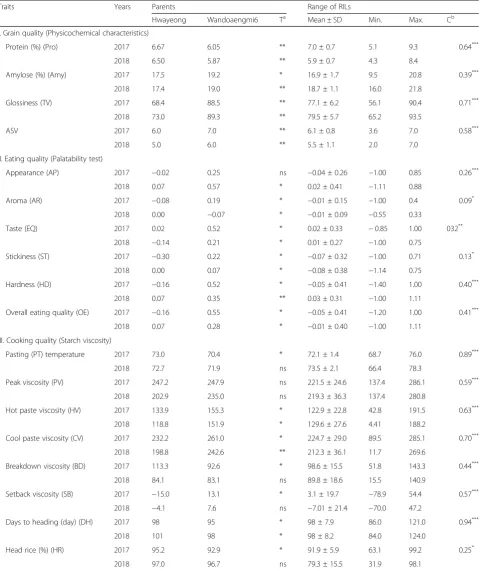
The phenotypic variations of parents and the RILs for
17 traits were evaluated for 2 years (2017–2018)
(Table 1). A significant difference was detected
be-tween the parents using the t test for all tested traits
(P< 0.05). The parents showed significant differences in all parameters, including grain quality and eating
quality, as shown in Table 1, except for AP in the
palatability test in 2017. In the case of the cooking quality, pasting temperature (PT), breakdown viscosity (BD), and setback viscosity (SB) were not significantly different both years, especially PV, which was not dif-ferent between the parents for the years. Year-to-year correlations between the traits in both years were sig-nificant (P< 0.05 to P< 0.001) for all 17 traits, and there was a relatively weak positive correlation in the seven eating-quality traits under the palatability test within the annual periods. From the results of the correlation analysis, the values of TV, PT, CV, and DH showed less variation in the RILs in both years, indicating a moderate positive correlation (r> 0.7, P<
0.001). The RIL population showed a general normal distribution in the tested traits, with transgressive seg-regation in both directions for both years.
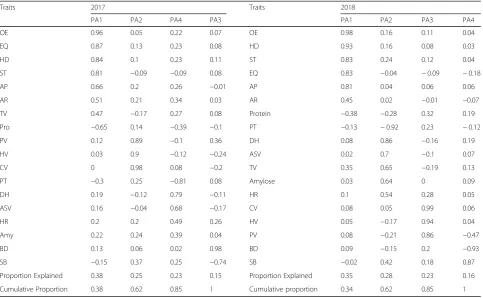
Factor Analysis of Parameters and Correlation of Traits
To explain the relationships among the observed vari-ables of each trait, especially between OE and TA, EFA was conducted for 17 traits evaluated for both years (Table 2). In the scree test for the decision of the num-ber of factors to extract, a total of four factors were taken above the eigenvalues of the factor analysis (data not shown). The results revealed that the contribution of the first three principal axes (PA) was 85% in 2017 and 2018, respectively, and two factors (PA1 and PA2) accounted for over 60% of the variance in the traits related to eating quality. In 2017, all traits in the palat-ability test and TV and Pro in the physicochemical char-acteristics were clustered as PA1, and the corresponding loadings of each trait were positive except for the pro-tein. In others, only the loading of the PT and the SB were negatively contributed in EFA for the years. PA1
was correlated with PA4 (r= 0.6) and PA3 (r= 0.3) in
2017. In 2018, TV was involved in PA2, while Pro was
still involved in PA1, and two groups (PA1:PA2, r= 0.3
and PA2:PA4,r= 0.3) were correlated with each other in
2018 (Additional file2: Figure S2).
The correlation value among 13 traits involved in PA1 and PA2 was summarized and generally consistent for 2 years when it was analyzed along with the OE (Add-itional files 3: Figures S3, S4). From the analysis, some traits (HD, ST, and EQ) of the palatability test showed a strong positive correlation (r> 0.8) with OE, while Amy, DH, and HR showed a weak positive correlation (r< 3.2)
Table 1Phenotypic variation of 17 traits among parents and the RIL
Traits Years Parents Range of RILs
Hwayeong Wandoaengmi6 Ta Mean ± SD Min. Max. Cb
I. Grain quality (Physicochemical characteristics)
Protein (%) (Pro) 2017 6.67 6.05 ** 7.0 ± 0.7 5.1 9.3 0.64***
2018 6.50 5.87 ** 5.9 ± 0.7 4.3 8.4
Amylose (%) (Amy) 2017 17.5 19.2 * 16.9 ± 1.7 9.5 20.8 0.39***
2018 17.4 19.0 ** 18.7 ± 1.1 16.0 21.8
Glossiness (TV) 2017 68.4 88.5 ** 77.1 ± 6.2 56.1 90.4 0.71***
2018 73.0 89.3 ** 79.5 ± 5.7 65.2 93.5
ASV 2017 6.0 7.0 ** 6.1 ± 0.8 3.6 7.0 0.58***
2018 5.0 6.0 ** 5.5 ± 1.1 2.0 7.0
II. Eating quality (Palatability test)
Appearance (AP) 2017 −0.02 0.25 ns −0.04 ± 0.26 −1.00 0.85 0.26***
2018 0.07 0.57 * 0.02 ± 0.41 −1.11 0.88
Aroma (AR) 2017 −0.08 0.19 * −0.01 ± 0.15 −1.00 0.4 0.09*
2018 0.00 −0.07 * −0.01 ± 0.09 −0.55 0.33
Taste (EQ) 2017 0.02 0.52 * 0.02 ± 0.33 −0.85 1.00 032**
2018 −0.14 0.21 * 0.01 ± 0.27 −1.00 0.75
Stickiness (ST) 2017 −0.30 0.22 * −0.07 ± 0.32 −1.00 0.71 0.13*
2018 0.00 0.07 * −0.08 ± 0.38 −1.14 0.75
Hardness (HD) 2017 −0.16 0.52 * −0.05 ± 0.41 −1.40 1.00 0.40***
2018 0.07 0.35 ** 0.03 ± 0.31 −1.00 1.11
Overall eating quality (OE) 2017 −0.16 0.55 * −0.05 ± 0.41 −1.20 1.00 0.41***
2018 0.07 0.28 * −0.01 ± 0.40 −1.00 1.11
III. Cooking quality (Starch viscosity)
Pasting (PT) temperature 2017 73.0 70.4 * 72.1 ± 1.4 68.7 76.0 0.89***
2018 72.7 71.9 ns 73.5 ± 2.1 66.4 78.3
Peak viscosity (PV) 2017 247.2 247.9 ns 221.5 ± 24.6 137.4 286.1 0.59***
2018 202.9 235.0 ns 219.3 ± 36.3 137.4 280.8
Hot paste viscosity (HV) 2017 133.9 155.3 * 122.9 ± 22.8 42.8 191.5 0.63***
2018 118.8 151.9 * 129.6 ± 27.6 4.41 188.2
Cool paste viscosity (CV) 2017 232.2 261.0 * 224.7 ± 29.0 89.5 285.1 0.70***
2018 198.8 242.6 ** 212.3 ± 36.1 11.7 269.6
Breakdown viscosity (BD) 2017 113.3 92.6 * 98.6 ± 15.5 51.8 143.3 0.44***
2018 84.1 83.1 ns 89.8 ± 18.6 15.5 140.9
Setback viscosity (SB) 2017 −15.0 13.1 * 3.1 ± 19.7 −78.9 54.4 0.57***
2018 −4.1 7.6 ns −7.01 ± 21.4 −70.0 47.2
Days to heading (day) (DH) 2017 98 95 * 98 ± 7.9 86.0 121.0 0.94***
2018 101 98 * 98 ± 8.2 84.0 124.0
Head rice (%) (HR) 2017 95.2 92.9 * 91.9 ± 5.9 63.1 99.2 0.25*
2018 97.0 96.7 ns 79.3 ± 15.5 31.9 98.1
a
Difference between the mean value of each parent byt-test. ns, *, ** indicates not significant, significant atP< 0.05, and significant atP< 0.001, respectively b
Year-to-year correlation. Significance levels:*P < 0.05,**P
with OE (Table 3). Among the physicochemical charac-teristics, TV and Pro showed a relatively moderate cor-relation with OE. In the case of the TV, the mean correlation coefficiency was observed to be the largest for Pro (r=−0.51).
Linkage Map and QTL Analysis
Of the 7098 SNPs tested, 1024 showed a polymorphic
pattern between japonica parents. Before linkage
ana-lysis, SNPs stacked in the same linkage position with 0 cM intervals were first removed. A total of 468 SNPs were eventually selected to be anchored on the 12
chro-mosomes (Additional file4: Figure S5). The
polymorph-ism rate ranged from 4.33 to 29.23%, with a mean of 14.42%, and on average, approximately 41 SNPs were
anchored on each chromosome (Additional file5: Table
S1). The linkage map resulted in a total length of 1064 cM and an average distance of 2.1 cM within the flank-ing markers. On the linkage map, there were two break-ing gaps, which means that the distance of flankbreak-ing markers was greater than 50 cM apart on chromosomes 4 and 5. The gaps were produced by the absence of markers in the regions because of the similarity of the
genetic background caused by japonica to japonica
combination.
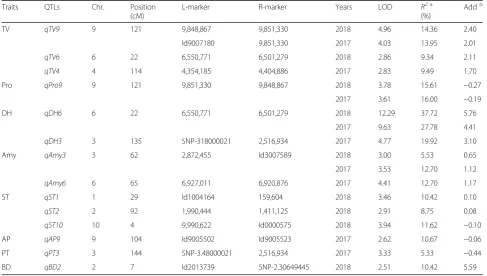
From the QTL analysis based on the linkage map, a total of 14 QTLs associated with traits of eating quality were identified and mapped at an empirical threshold of LOD > 2.40 for the study years (Table 4). Of the tested traits, the QTLs of TV, Pro, DH, Amy, ST, AP, PT and BD were detected on chromosomes 1, 2, 3, 4, 6, 9, and 10 using inclusive composite interval mapping (ICIM)
(Fig. 2). Only the four QTLs, qTV9, qPro9, qDH6, and
qAmy3 on chromosomes 9, 6, and 3, were continuously
detected for the experimental periods. The others (qAmy37, qDH37, qPT37, qTV47, qAmy67,and qAT97in 2017 and qST18, qBD28, qST28, qTV68, and qST108 in 2018) were detected only in either experimental year of
2017 or 2018 (Fig. 2). For TV, all three QTLs on
chro-mosomes 4, 6, and 9 revealed a positive influence on the
alleles derived from Wandoaengmi6. qTV9, with an
LOD score of 4.96 within 9,848,867 and 9,851,330 and 4.03 within Id9007180 and 9,851,330 was detected on chromosome 9, respectively, explaining 14.36 and 13.95% of phenotypic variation (R2) in ICIM analysis,
re-spectively. In addition, qTV6 and qTV4, with LODs of
2.86 and 2.83, respectively, were detected within flanking
Table 2Factor analysis with orthogonal rotation of the 17 traits evaluated using the RIL population
Traits 2017 Traits 2018
PA1 PA2 PA4 PA3 PA1 PA2 PA3 PA4
OE 0.96 0.05 0.22 0.07 OE 0.98 0.16 0.11 0.04
EQ 0.87 0.13 0.23 0.08 HD 0.93 0.16 0.08 0.03
HD 0.84 0.1 0.23 0.11 ST 0.83 0.24 0.12 0.04
ST 0.81 −0.09 −0.09 0.08 EQ 0.83 −0.04 −0.09 −0.18
AP 0.66 0.2 0.26 −0.01 AP 0.81 0.04 0.06 0.06
AR 0.51 0.21 0.34 0.03 AR 0.45 0.02 −0.01 −0.07
TV 0.47 −0.17 0.27 0.08 Protein −0.38 −0.28 0.32 0.19
Pro −0.65 0.14 −0.39 −0.1 PT −0.13 −0.92 0.23 −0.12
PV 0.12 0.89 −0.1 0.36 DH 0.08 0.86 −0.16 0.19
HV 0.03 0.9 −0.12 −0.24 ASV 0.02 0.7 −0.1 0.07
CV 0 0.98 0.08 −0.2 TV 0.35 0.65 −0.19 0.13
PT −0.3 0.25 −0.81 0.08 Amylose 0.03 0.64 0 0.09
DH 0.19 −0.12 0.79 −0.11 HR 0.1 0.54 0.28 0.05
ASV 0.16 −0.04 0.68 −0.17 CV 0.08 0.05 0.99 0.06
HR 0.2 0.2 0.49 0.26 HV 0.05 −0.17 0.94 0.04
Amy 0.22 0.24 0.39 0.04 PV 0.08 −0.21 0.86 −0.47
BD 0.13 0.06 0.02 0.98 BD 0.09 −0.15 0.2 −0.93
SB −0.15 0.37 0.25 −0.74 SB −0.02 0.42 0.18 0.87
Proportion Explained 0.38 0.25 0.23 0.15 Proportion Explained 0.35 0.28 0.23 0.16
Cumulative Proportion 0.38 0.62 0.85 1 Cumulative proportion 0.34 0.62 0.85 1
Table 4QTLs identified for the traits of rice eating and cooking quality for 2 years in the RIL population
Traits QTLs Chr. Position
(cM)
L-marker R-marker Years LOD R2a
(%)
Addb
TV qTV9 9 121 9,848,867 9,851,330 2018 4.96 14.36 2.40
Id9007180 9,851,330 2017 4.03 13.95 2.01
qTV6 6 22 6,550,771 6,501,279 2018 2.86 9.34 2.11
qTV4 4 114 4,354,185 4,404,886 2017 2.83 9.49 1.70
Pro qPro9 9 121 9,851,330 9,848,867 2018 3.78 15.61 −0.27
2017 3.61 16.00 −0.19
DH qDH6 6 22 6,550,771 6,501,279 2018 12.29 37.72 5.76
2017 9.63 27.78 4.41
qDH3 3 135 SNP-318000021 2,516,934 2017 4.77 19.92 3.10
Amy qAmy3 3 62 2,872,455 Id3007589 2018 3.00 5.53 0.65
2017 3.53 12.70 1.12
qAmy6 6 65 6,927,011 6,920,876 2017 4.41 12.70 1.17
ST qST1 1 29 Id1004164 159,604 2018 3.46 10.42 0.10
qST2 2 92 1,990,444 1,411,125 2018 2.91 8.75 0.08
qST10 10 4 9,990,622 Id0000575 2018 3.94 11.62 −0.10
AP qAP9 9 104 Id9005502 Id9005523 2017 2.62 10.67 −0.06
PT qPT3 3 144 SNP-3.48000021 2,516,934 2017 3.33 5.33 −0.44
BD qBD2 2 7 Id2013739 SNP-2.30649445 2018 2.51 10.42 5.59
a
Percentage of phenotypic variation explained by the QTL b
Additive effect
Table 3Correlation coefficients among traits associated with eating quality in 174 RILs for 2017 and 2018
Traits Years TV Pro EQ ST HD OE Amy DH HR
TV 2017 −0.58*** 0.39*** 0.50*** 0.39*** 0.48*** 0.19* 0.30** 0.23*
2018 −0.44*** 0.30** 0.38*** 0.37*** 0.41*** 0.58*** 0.63*** 0.39***
Pro 2017 −0.58*** −0.60*** −0.62*** −0.60*** −0.67*** −0.34*** −0.42*** −0.23*
2018 −0.44*** −0.49*** −0.31** −0.35*** −0.35*** −0.22* −0.31** 0.06
EQ 2017 0.39*** −0.60*** 0.62*** 0.88*** 0.93*** 0.36*** 0.30** 0.39***
2018 0.30** −0.49*** 0.62*** 0.88*** 0.77*** 0.01 0.02 −0.08
ST 2017 0.50*** −0.62*** 0.62*** 0.61*** 0.73*** 0.04 0.10 −0.02
2018 0.38*** −0.31** 0.62*** 0.88*** 0.92*** 0.26** 0.22* 0.31**
HD 2017 0.39*** −0.60*** 0.88*** 0.61*** 0.92*** 0.37*** 0.32*** 0.43***
2018 0.37*** −0.35*** 0.88*** 0.88*** 0.95*** 0.31** 0.21* 0.23*
OE 2017 0.48*** −0.67*** 0.93*** 0.73*** 0.92*** 0.34*** 0.33*** 0.36***
2018 0.41*** −0.35*** 0.77*** 0.92*** 0.95*** 0.31** 0.21* 0.24*
Amy 2017 0.19* −0.34*** 0.36*** 0.04 0.37*** 0.34*** 0.23* 0.31**
2018 0.58*** −0.22* 0.01 0.26** 0.31** 0.31** 0.70*** 0.64***
DH 2017 0.30** −0.42*** 0.30** 0.1 0.32*** 0.33*** 0.23* 0.41***
2018 0.63*** −0.31** 0.02 0.22* 0.21* 0.21* 0.70*** 0.48***
HR 2017 0.23* −0.23* 0.39*** −0.02 0.43*** 0.36*** 0.31** 0.41***
2018 0.39*** 0.06 −0.08 0.31** 0.23* 0.24* 0.64*** 0.48***
Significance levels:*
P< 0.05,**
P< 0.01, and***
markers (6550771–6,501,279 and 4,354,185–4,404,886)
on chromosomes 6 and 4 with R2 values of 9.34 and
9.49, respectively.
Genetic Improvements in Eating Quality byqTV9
Before verifying the effectiveness of the QTL, the 110 RILs were selected to minimize environmental errors, considering a range of DH (86 to 106) and less variation in TV for the experimental years. The distribution of OE was analyzed according to the presence of the QTL
qTV9(Fig.3). In the case of the positiveqTV9,the
intro-gression lines with qTV9 showed a significant
correl-ation (r= 0.55,P< 0.001) and a determination coefficient
(R2= 0.27, P< 0.001) between TV and OE, while the
negative introgression lines showed a weak correlation and a determination coefficient (R2= 0.07, P< 0.01) within the traits (r= 0.21, P< 0.05). The result revealed
that the presence ofqTV9positively increased the TV in
the lines, and it was also affected to improve the OE of the introgressed line.
Delimitation of the Physical Location ofqTV9
From the QTL analysis, the QTL qTV9was designated
by 20.83 and 21.29 Mbp on chromosome 9 in 2017 and
by 21.17 to 21.29 Mbp in 2008, respectively (Table 4
and Fig. 4). Among the tested lines, five recombinant
lines showing discordance by genotype and phenotype data were observed, and two recombinants (HW085 and HW135) were finally selected to delimit the position because the two were able to be significantly distinguished by their degree of TV. For dissection of
the qTV9 locus, a total of 16 CAPS markers were
de-signed based on the result of the whole-genome rese-quencing (WGR) using the parents, and five markers showing polymorphism between the parents were
se-lected (Additional file 6: Table S2) to be anchored on
the target region, except for CTV9_6. The target region
Fig. 3Distribution of the QTL,qTV9, on the scatter plot of taste value and overall eating quality (OE) for correlation analysis. The green spots indicate lines withqTV9,and the red spots indicate lines without the QTL. The linear lines on the plot show the correlations for significance between the taste value and OE of lines distinguished by the two colors
was narrowed to approximately 34-Kbp segments delimited by the flanking markers CTV9_9 and CTV9_
13 (Fig.4). Nine ORFs based on the MSU Osa1 Release
7 located in the target region were identified in the tar-get region as candidate genes associated with the TV of cooked rice (Additional file7: Table S3).
Development of theqTV9Introgression Lines
To select promising lines for improving eating quality, we started to evaluate agronomic traits and grain
qual-ity using RILs at F6 generation. Through phenotypic
selection, physicochemical characteristics and palat-ability test, elite lines were continuously selected for each breeding generation. Ten breeding lines were
se-lected at F8generation and confirmed QTLs in the
se-lected lines using QTL validation test. Of them three
lines with qTV9(HW148, HW184, and HW191) were
finally selected as promising lines associated with eat-ing quality (Table5). For DH, the selected were similar to the parents, and for PL and NP, the degree was not much different within the variation of parents, ranging from 21.1 to 22.8 and 9.6 to 10.6, respectively. CL in-creased in general on the side of Wandoeognmi6. In Pro, Amy, and ASV, the values of the three lines were
distributed at the level of the normal japonicacultivar
in Korea, even though the amylose contents were biased to Wandoaengmi6. In the case of TV, the values showed a definite increase compared to Hwayeong,
ac-cording to the presence of qTV9. Grain appearance
and other traits of the selected three lines were also evaluated (Additional file 8: Table S4). The results re-veal that resistance to BL and BB and panicle type also improved with eating quality.
Discussion
Rice eating quality is one of the main objectives of
the japonica rice breeding program, and the demand
for high quality rice is increasing along with increased interest in health and the nutritional quality of food
(Kobayashi et al. 2008; Kwon et al. 2008; Lau et al.
2015). Therefore, many studies have been performed
to understand eating quality or the relationship be-tween eating quality and other traits while simultan-eously attempting to improve these issues in rice. However, there are some difficulties in improving rice eating quality following the demand due to the eva-luation methods, genetic complexity, interaction be-tween genotypes and the environment, etc. The development and applications of DNA markers associ-ated with eating quality are useful to address these problems and to increase the selection efficiency in the early breeding stage. Thus, in this study, we used a RIL population to assess whether TV, which means glossiness of cooked rice, improved eating quality.
From QTL analysis, the QTL qTV9 associated with
eating quality was identified, and the dCAPS markers, including the target region delimited within the 34-kb
segment, were developed. Three lines with qTV9 were
selected and confirmed that OE was maintained at the donor level in conjunction with TV, showing promising agronomic traits.
The RIL population derived from a cross between Hwayeong and Wandoaengmi6 was developed on the basis of the difference between the TV of parents and used for the genetic analysis on the glossiness of cooked rice. The phenotypic variation of the trait exhibited a normal distribution, associated by the QTL, and the mean value of RIL for the TV was significantly corre-lated each year (Table1). In the correlation coefficiency for the 2 years, the tested traits involved physicochemical characteristics and starch viscosity indicated over 0.58 on average, while traits evaluated by the palatability test showed relatively low consistency (r< 0.27) across years.
In EFA performed for the tested 17 traits, the four fac-tors were extracted to calculate the factor loadings with
orthogonal rotation (Table 2). The OE along with TV
and Pro in 2017 loaded on the first factor (PA1) and the OE (PA1) and the TV (PA2) were separated in 2018, but the correlation between both factors was still identified
in 2018 (PA1:PA2, r= 0.3). In fact, the OE indicated a
Table 5Comparison of parents and selected promising three lines on agronomic performance and physicochemical characteristics includingqTV9
Parents & Lines Major agronomic traits Physicochemical characteristics QTLs
(qTV9,
qTV6, qTV4)
DH (day)
CL (cm)
PL (cm)
NP TV OE
(−3−+ 3) Pro (%)
Amy (%)
ASV (1–7)
Hwayeong 99.5aa 73.4b 21.1b 11.7a 68.4b −0.16b 6.67a 17.5c 6.0ab -,−,−b
Wandoaengmi6 96.5a 99.4a 19.8c 9.4b 88.4a 0.55a 6.05a 19.1bc 7.0a +, +, +
HW148 102a 98.4a 22.8a 10.6ab 83.5a 0.64a 6.54a 21.32ab 6.3ab +, +, +
HW184 98.5a 94.6a 21.6b 10.0b 87.8a 0.65a 5.99ab 19.98ab 7.0a +, +, +
HW191 97.5a 92.8a 21.1b 9.6b 86.5a 0.75a 5.38b 21.58a 5.7b +, +, +
a
Duncan Multiple Range Test (DMRT) of agronomic traits of tested lines. Means followed by the same letter are not significant at the 5% significant level b
positive correlation with the TV for the 2 years (r= 0.48 in 2017 andr= 0.41 in 2018), and the Pro was negatively correlated with the OE for these years. Among the pa-rameters in the palatability test, OE presented a rela-tively strong correlation with EQ, ST, and HD, and in the case of Amy, DH, and HR, the correlation was weak
both years (Table 3). In general, many studies have
re-ported a correlation between traits known to directly or indirectly affect rice eating quality. The texture parame-ters of cooked rice correlated with AC (Champagne et al. 2014). Sensory properties related to stickiness had statistical correlation coefficients with the AC and Pro (Lyon et al. 1999). Windham (2014) reported that it is very important to determine the correlation between the sensory and instrumental methods on palatability, which can lead better methods to quickly evaluate and predict end-use qualities. However, finding the relationships is not easy because the sensory properties of cooked rice are very subtle and can be influenced by many factors.. The result is meaningful in that the TV was more stable as an evaluation method for eating quality and showed less susceptibility to the growing environment in this study. Therefore, we think that TV obtained by an ac-curate instrument is appropriate for explaining the OE measured by the selected panel group.
In this study, a total of 14 QTLs associated with traits of eating quality were identified using QTL analysis
(Table4). Only the four QTLs,qTV9, qPro9, qDH6, and
qAmy3 on chromosomes 9, 6, and 3, were continuously
detected for the experimental periods. Regarding the TV of cooked rice, three QTLs were detected on chromo-somes 4, 6, and 9, indicating a positive influence on the alleles derived from Wandoaengmi6. In particular, the
QTL qTV9 delimited within Id9007180 and 9,851,330
on chromosome 9 was detected in both years, explaining approximately 17% of the variation on average in the
ICIM analysis. The target region of qTV9 was located
within 20.83 to 21.28 Mbp, indicating the physical pos-ition (Fig.4). The glossiness is known as an indirect par-ameter for eating quality based on the significant correlation between the palatability test and the
glossi-ness of cooked rice (Takeuchi et al. 2007; Kwon et al.
2011). qGCR6 affecting the glossiness of cooked rice
from backcross inbred lines (BILs) developed from Koshihikari was identified on the short arm of chromo-some 6 delimited to a 43.9-kb chromosomal region
con-taining ten putative genes (Wang et al. 2017). Three
QTLs derived from the japonica cultivar Ilpum in 2
years were identified on chromosomes 3 and 6, explain-ing a range of 7.5 to 28.0% (Cho et al.2014). In
particu-lar, qGCR9, which is derived from the O. rufipogon
allele, was associated with a higher glossiness of cooked rice and was reported within RM242 and RM245 on
chromosome 9 (Yun et al. 2016). The physical position
ofqTV9detected in this study was included in the target
region of qGCR9delimited within 18.64 Mbp and 22.04
Mbp on chromosome 9; in addition, althoughqGCR9is
relatively weak, both QTLs were negatively related with the protein contents of cooked rice. On the other hand, the QTLs have something in common that the allele did
not derived from normaljaponicaorindicacultivars.
To verify the effect of improvement in eating quality, the correlation coefficient between OE and TV was com-pared with the presence or absence of the detected
qTV9. The positive effect on improvement of the OE
was significantly confirmed in the introgression lines withqTV9(Fig.3). From the results, the development of PCR-based markers was thought to be practically avail-able to increase the selection efficiency by marker-assisted selection (MAS) for rice breeding programs on eating quality, even thoughTV9is the trait controlled by the QTL. To develop a DNA marker for MAS, we
per-formed fine mapping of the target region of qTV9. To
further narrow the region by the selected recombinants,
qTV9 was delimited to an approximately 34-Kbp
seg-ment flanked by the dCAPS markers CTV9_9 and CTV9_13, and 9 ORFs were listed in the target region as candidate genes associated with TV. Regarding ORFs listed in the target region, however, genetic information associated with grain formation or eating quality was not found in either previous relevant study or public data-base. In the further study we are planning to excess ex-pression pattern of those at RNA level for confirming gene related to TV of cooked rice.
The CTV9_9 among developed markers was used to select the promising lines with the improved OE value, and then three lines within the introgression lines with
qTV9 were eventually selected (Table 5). In particular,
the selected were maintained TV and OE without loss of favorable agricultural traits by a typical breeding method, such as resistance to BB and blast and panicle type (Table5and Additional file8: Table S4). The values of the lines’grain appearance also did not deviate signifi-cantly between the range of parents. In the case of physi-cochemical characteristics, the traits TV, OE, Pro and Amy of the lines tended to be somewhat close to Wandoaengmi6.
In this study, we tried to suggest that TV, which is ob-tained by the instrumental method, was one of the main traits explaining OE by statistical methods, and thus, we
identified that qTV9 was associated with the glossiness
of cooked rice through QTL analysis. Moreover, qTV9
focus on characterizing the glossiness of cooked rice through functional analysis of the target region. In addition, we hopefully believe that this adds to the sci-ence surrounding rice eating quality and that molecular markers for the trait will prove valuable to breeding pro-grams seeking to develop high quality rice lines with new sources.
Materials and methods
Plant materials and mapping population
Hwayeong, a mid-maturing japonica cultivar with high
grain quality, and Wandoaengmi6, a japonica-type
Ko-rean weedy rice with high eating quality and a high de-gree of glossiness of cooked rice were crossed to develop a recombinant inbred lines (RILs) population using a
single descent method (SSD). The population (F8)
com-posed of 174 lines was used to access the phenotypic data of tested traits related to rice eating quality as well as to construct a molecular genetic map to identify the QTLs controlling eating quality.
Evaluation of properties for eating quality Physicochemical characteristics
The taste value (TV) is obtained by quantifying the glossiness of the surface of cooked rice. The value was measured from cooked rice left at room temperature for 5 min after cooking 33 g of head rice from each line at 80 °C for 10 min using a Toyo meter (MA-90, Toyo Rice Cleaning Machine Co., Ltd., Wakayama, Japan).
The amylose content was determined by the
methods of Perez and Juliano (1978). Briefly, 100 mg
rice flour left in a 95 °C dry oven for 5 h was gelati-nized with 1 ml EtOH and 9 ml 1 N NaOH in a 97 °C water bath for 10 min. After cooling, distilled water was added up to 100 ml at room temperature. The 5 ml taken from the solution was mixed with 1 ml
CH3COOH and 2 ml 2% lodine solution to a total of
100 ml and treated for 20 min. The value was mea-sured from the solution at 620 nm using an Ultrospec 4300pro spectrophotometer (Amersham Bioscience, UK). The protein content was determined following
the micro-Kjeldahl method (AOAC 2002). The ASV
was determined visually using a score (1–7) of
spread-ing accordspread-ing to the standard evaluation system for
rice from the IRRI (IRRI 2013) and by the clearing of
milled rice kernel soaked in 1.4% KOH solution for 23 h at a constant temperature of 30 °C.
Sensory test for evaluating eating quality
Using one cultivar—Shindongjin—as a standard, a check sensory test was carried out following the evaluation manual (Yamamoto et al.1996). A total of 200 g of white rice polished at 92% degree of milling was prepared for
the test. The white rice was washed 3–4 times and
soaked for 30 min before cooking in an electric rice cooker (CUCKOO CR-0313 V, Seoul, Korea) at a ratio of white rice to water of 1:1.1 (w/v). The eating quality of cooked rice was evaluated to discriminate eating qual-ity differences among tested lines by adult 7–15 panel-ists. The evaluation of eating quality was performed according to the six categories of research: AP: appear-ance and glossiness of cooked rice, AR: aroma of cooked rice, EQ: eating taste of cooked rice, ST: stickiness of cooked rice, HD: hardness of cooked rice, and OE: over-all eating quality. The OE score was determined by sum-ming the results of the five tests mentioned above. The
eating quality of each tested item was scored from −3
(extremely low) to + 3 (excellent) compared with that of the reference cultivar (score = 0). The mean score of all panelists was used as the trait value for the sensory test in this study.
Paste viscosity profile
The pasting properties of the rice flour were determined using a Rapid Visco Analyzer (RVA 4500, Perten Instru-ments, Stockholm, Sweden) according to the instruction
method reported by the AACC method 61–02.01
(AACC International1995). Three grams of rice flour at
14% moisture from each line was dispersed in 25 ml dis-tilled water and subjected to gelatinization analysis. The sequential temperature curve was as follows: incubating at 50 °C for 1 min, heating at 95 °C for 1.4 min, cooling from 95 °C to 50 °C and then holding for 1.4 min. Four primary parameters, including pasting temperature (PT), peak viscosity (PV), hot paste viscosity (HV), and cool paste viscosity (CV), can be obtained from the pasting curve or temperature profile of the diagram. In addition, the secondary parameters of paste viscosity breakdown viscosity (BD) and setback viscosity (SB) were calculated; BD is the decrease in viscosity during cooking at 95 °C
(BD = PV–HV), and SB is the viscosity (SB = CV–PV)
when cooled to 40 °C min peak viscosity.
Evaluation of major agronomic traits
Head rice (HR) is the ratio of unbroken rice grain de-rived from a defined mass of paddy rice after complete milling. The HR was prepared following the method
de-scribed by Tan et al. (1999) From the NICS standard
evaluation system (RDA, 2012), major agronomic traits
were evaluated; days to heading (DH) were calculated from the total number of days from seeding to 40% flow-ering, and culm length (CL) and panicle length (PL) were measured from 20 plants.
Genotyping and linkage mapping
in IRRI (International Rice Research Institute, Philippines). The selected SNPs from the genotypic data sets decoded to generate SNP data using GenomeStudio Software were used to construct a linkage map using QTL IciMapping version 4.0 (Meng et al.2015). The mapping distance dur-ing linkage map construction was calculated with the Kosambi mapping function, and the options By LOD and By Input were used for grouping and ordering of the se-lected factors, respectively.
Data analysis
To detect the QTLs related to eating quality in rice, the phenotypic measurement and the genotypic SNP data were combined and analyzed using conventional mapping for inclusive composite interval mapping for additive
QTLs (ICIM-ADD) (Zhang et al.2008). Permutation tests
with 1000 replicates (P≤ 0.05) were applied to confirm
the significant threshold values (≥2.40 in 2017 and≥2.55 in 2018) of the detected QTLs according to the method
by Churchill and Doerge (1994). The naming of the QTLs
followed the nomenclature suggested by McCouch 2008.
The statistical packages, psych and ggplot2, in R software were applied to produce correlation coefficients and among tested traits, determination coefficients between TV and OE, and exploratory factor analysis (EFA). The corr.test () function produced correlations and signifi-cance levels for matrices of the Pearson correlations. In
addition, the MASS package in R was used for t.test to
compare to the mean value of traits within parents.
Development of DNA markers using whole-genome resequencing
To harbor additional DNA markers within the target re-gion, WGR was performed using an Illumina NovaSeq 6000 system (Illumina, USA) following provided proto-cols for 2 × 100 sequencing. The DNA library was pre-pared according to the Truseq Nano DNA library prep protocol (Cat. No. FC-121-4001). After QPCR using SYBR Green PCR Master Mix (applied Biosystems), the libraries that index tagged in equimolar amounts in the pool were combined. Using the resequencing data, the dCAP markers were designed by primer 3 by detecting the specific restriction site according to the sequence of parents in the target region.
Supplementary information
Supplementary informationaccompanies this paper athttps://doi.org/10. 1186/s12284-019-0348-0.
Additional file 1: Figure S1.Comparison of the glossiness on the surface of cooked rice in the parents Hwayeong and Wandoaengmi6.
Additional file 2: Figure S2.Diagram of the oblique four-factor solu-tion for the traits data associated with rice eating quality using the RILs in 2017 and 2018. Toyo is TV evaluated by a Toyo meter.
Additional file 3: Figure S3.Coefficients of pairwise correlations of 13 traits detected in eating quality of rice grain in the RILs in 2017.Figure S4.Coefficients of pairwise correlations of 13 traits detected in eating quality of rice grain in the RILs in 2018.
Additional file 4: Figure S5.Genetic linkage map of the RIL mapping population from a cross between Hwayeong and Wandoaengmi6, using 498 SNP markers.
Additional file 5: Table S1.Summary of the linkage map for QTL analysis.
Additional file 6: Table S2.List of dCAPs markers within the target region ofqTV9.
Additional file 7: Table S3.List of putative ORFs in MSU and RAP version within the target region.
Additional file 8: Table S4.Grain appearance and other traits of selected lines and parents.
Acknowledgments
Not applicable.
Authors’contributions
S-GP wrote an original draft and performed main analysis including QTL. H-SP and Y-CC developed the mapping population. MGB evaluated the agro-nomic traits of the RILs. J-MJ evaluated traits associated with physicochemi-cal characteristics. J-PS evaluated starch viscosity in relation to cooking quality. G-ML and C-ML prepared DNA samples for genotypic analysis devel-oped the PCR based markers regarding eating quality. C-SK was involved in all aspects of the study and reviewed the manuscript and data. S-MK de-signed this study and reviewed & edited the manuscript. All authors read and approved the final manuscript.
Funding
This work was carried out with the support of the“Cooperative Research Program for Agricultural Science & Technology Development (Project title: Detection of novel gene/QTL related to high eating quality using domestic rice genetic resources, Project No. PJ01133102)”.
Availability of data and materials
Not applicable.
Ethics approval and consent to participate
Not applicable.
Consent for publication
Not applicable.
Competing interests
The authors declare that they have no competing interests.
Received: 26 September 2019 Accepted: 6 November 2019
References
AACC International (1995) Approved Methods of Analysis, 11th Ed. 61-02.01. Determination of the Pasting Properties of Rice with the Rapid Visco Analyser. St. Paul, MN.
Aluko G, Martinez C, Tohme J et al (2004) QTL mapping of grain quality traits from the interspecific crossOryza sativaxO. glaberrima. Theor Appl Genet 109:630–639.https://doi.org/10.1007/s00122-004-1668-y
AOAC (2002) Official Methods of Analysis,. In: Association of Official Analytical Chemists, Inc., 17th ed, (Virginia, U.S.A., Arlington). pp 152–169
Bao J (2004) Analysis of quantitative trait loci for some starch properties of rice (Oryza sativaL.): thermal properties, gel texture and swelling volume. J Cereal Sci 39:379–385.https://doi.org/10.1016/S0733-5210(04)00006-2
Bao JS, Zheng XW, Xia YW et al (2000) QTL mapping for the paste viscosity characteristics in rice (Oryza sativaL.). Theor Appl Genet 100:280–284.https:// doi.org/10.1007/s001220050037
Champagne ET, Bett-garber K, McClung AM, Bergman C (2014) Sensory characteristics of diverse rice cultivars as influenced by genetic and environmental factors sensory characteristics of diverse rice cultivars as influenced. Cereal Chem 81:237–243.https://doi.org/10.1094/CCHEM. 2004.81.2.237
Childs N, Livezey J (2006) Rice backgrounder. Economic Research Service, Washington DC
Cho Y-C, Baek M-K, Suh J-P et al (2014) QTL detection associated with eating quality based on palatability test inJaponicaRice (Oryza sativaL.). Plant Breed Biotechnol 2:342–353
Churchill GA, Doerge RW (1994) Empirical threshold values for quantitative trait mapping. Genetics 138:963–971.https://doi.org/10.1534/genetics.107.080101
Ebadi AA, Farshadfar E, Rabiei B (2013) Mapping QTLs controlling cooking and eating quality indicators of iranian rice using RILs across three years. Aust J Crop Sci 7:1494–1502
He P, Li SG, Qian Q et al (1999) Genetic analysis of rice grain quality genetic analysis of rice grain quality. Theor Appl Genet 98:502–503.https://doi.org/ 10.1007/s001220051098
Hsu YC, Tseng MC, Wu YP et al (2014) Genetic factors responsible for eating and cooking qualities of rice grains in a recombinant inbred population of an inter-subspecific cross. Mol Breed 34:655–673. https://doi.org/10.1007/s11032-014-0065-8
IRRI (2013) Standard Evaluation System for Rice, 5th edn. Interanational Rice Reserach Institute, Manila.
Izumi OE, Yuji M, Kuniyuki S, Toshiro K (2007) Effects of rising temperature on grain quality, palatability and physicochemical properties of rice. Sci Reports Fac Agric - Okayama Univ 96:13–18
Juliano BO (1971) A simplified assay for endonuclease. Cereal Sci Today 16:334–340 Kobayashi A, Tomita K, Yu F et al (2008) Verification of quantitative trait locus for stickiness of cooked rice and amylose content by developing near-isogenic lines. Breed Sci 58:235–242.https://doi.org/10.1270/jsbbs.58.235
Kwon S-W, Cho Y-C, Kim Y-G et al (2008) Development of near-isogenic japonica rice lines with enhanced resistance to Magnaporthe grisea. Mol Cells 25:407–416 Kwon S, Cho Y, Lee J et al (2011) Identification of quantitative trait loci associated
with Rice eating quality traits using a population of recombinant inbred lines derived from a cross between two temperate japonica cultivars. Mol Cells 31: 437–445.https://doi.org/10.1007/s10059-011-0289-y
Lau WCP, Rafii MY, Ismail MR et al (2015) Review of functional markers for improving cooking, eating, and the nutritional qualities of rice. Front Plant Sci 6:1–11.https://doi.org/10.3389/fpls.2015.00832
Lestari P, Ham T-H, Lee H-H et al (2009) PCR marker-based evaluation of the eating quality ofJaponicaRice (Oryza sativaL.). J Agric Food Chem 57: 2754–2762
Lyon BG, Champagne ET, Vinyard BT et al (1999) Effects of degree of milling, drying condition, and final moisture content on sensory texture of cooked rice. Cereal Chem 76:56–62.https://doi.org/10.1094/CCHEM.1999.76.1.56
McCouch SR (2008) Gene nomenclature system for rice. Rice 1:72–84.https://doi. org/10.1007/s12284-008-9004-9
Meng L, Li H, Zhang L, Wang J (2015) QTL IciMapping: integrated software for genetic linkage map construction and quantitative trait locus mapping in biparental populations. Crop J 3:269–283.https://doi.org/10.1016/j.cj.2015.01.001
Perez CM, Juliano BO (1978) Modification of the simplified amylose test for milled Rice. Starch 30:424–426.https://doi.org/10.1002/star.19780301206
Ponce KS, Ye G, Zhao X (2018) QTL identification for cooking and eating quality in indica rice using multi-parent advanced generation intercross (MAGIC) population. Front Plant Sci 9:1–9.https://doi.org/10.3389/fpls. 2018.00868
Ramesh M, Bhattacharya KR, Mitchell JR (2000) Developments in understanding the basis of cooked-rice texture. Food Sci Natrition 40:449–460
RDA (Rural Development Administration) (2012) Manual for standard evaluation method in agricultural experiment and research. RDA Press, Suwon Rebeira SP, Wickramasinghe HAM, Samarasinghe WLG, Prashantha BDR (2014)
Diversity of grain quality characteristics of traditional rice (Oryza sativaL.) varieties in Sri Lanka. Trop Agric Res 25:570–578.https://doi.org/10.4038/tar. v25i4.8062
Suwannaporn P, Linnemann A (2008) Rice-eating quality among consumers in different rice grain preference countries. J Sens Stud 23:1–13.https://doi.org/ 10.1111/j.1745-459X.2007.00129.x
Takeuchi Y, Nonoue Y, Ebitani T et al (2007) QTL detection for eating quality including glossiness, stickiness, taste and hardness of cooked Rice. Breed Sci 57:231–242.https://doi.org/10.1270/jsbbs.57.231
Tan YF, Li JX, Yu SB et al (1999) The three important traits for cooking and eating quality of rice grains are controlled by a single locus in an elite rice hybrid, Shanyou 63. Theor Appl Genet 99:642–648.https://doi.org/10.1007/ s001220051279
Wada T, Uchimura Y, Ogata T et al (2006) Mapping of QTLs for Physicochemical Properties in Japonica Rice. Breed Sci 56:253–260.https://doi.org/10.1270/ jsbbs.56.253
Wada T, Ogata T, Tsubone M et al (2008) Mapping of QTLs for eating quality and physicochemical properties of the japonica rice‘Koshihikari’. Breed Sci 58: 427–435.https://doi.org/10.1270/jsbbs.58.427
Wang LQ, Liu WJ, Xu Y et al (2007) Genetic Basis of 17 Traits and Viscosity Parameters Characterizing the Eating and Cooking Quality of Rice Grain. Theor Appl Genet 115:463–476.https://doi.org/10.1007/s00122-007-0580-7
Wang S-S, Chen K-Y, Lin Y, Chen R-K (2017) Genetic Mapping of the qGCR6 Locus Affecting Glossiness of Cooked Rice. Euphytica 213:115.https://doi.org/ 10.1007/s10681-017-1904-6
Windham WR (2014) Sensory and Instrumental Relationships of Texture of Cooked Rice from Selected Cultivars and Postharvest Handling Practices from Selected Cultivars and Postharvest Handling Practices. Cereal Chem 77:64–69.
https://doi.org/10.1094/CCHEM.2000.77.1.64
Yamamoto T, Horisue N, Ikeda R (1996) Rice Breeding Manual. Yokendo Ltd., Tokyo Yun Y, Chung C, Lee Y, et al. (2016) QTL Mapping of Grain Quality Traits Using
Introgression Lines CarryingOryza rufipogonChromosome Segments in Japonica Rice. Rice 9:62–75.https://doi.org/10.1186/s12284-016-0135-0
Zhang L, Li H, Li Z, Wang J (2008) Interactions Between Markers can be Caused by the Dominance Effect of Quantitative Trait Loci. Genetics 180:1177–1190.
https://doi.org/10.1534/genetics.108.092122
Publisher’s Note