Volume 2008, Article ID 364142,14pages doi:10.1155/2008/364142
Research Article
Demosaicking Based on Optimization and Projection in
Different Frequency Bands
Osama A. Omer and Toshihisa Tanaka
Department of Electrical and Electronic Engineering, Tokyo University of Agriculture and Technology, Tokyo 184-8588, Japan
Correspondence should be addressed to Osama A. Omer,[email protected]
Received 30 July 2007; Revised 10 November 2007; Accepted 23 November 2007
Recommended by Alain Tremeau
A fast and effective iterative demosaicking algorithm is described for reconstructing a full-color image from single-color filter array data. The missing color values are interpolated on the basis of optimization and projection in different frequency bands. A filter bank is used to decompose an initially interpolated image into frequency and high-frequency bands. In the low-frequency band, a quadratic cost function is minimized in accordance with the observation that the low-low-frequency components of chrominance slowly vary within an object region. In the high-frequency bands, the high-frequency components of the unknown values are projected onto the high-frequency components of the known values. Comparison of the proposed algorithm with seven state-of-the-art demosaicking algorithms showed that it outperforms all of them for 20 images on average in terms of objective quality and that it is competitive with them from the subjective quality and complexity points of view.
Copyright © 2008 O. A. Omer and T. Tanaka. This is an open access article distributed under the Creative Commons Attribution License, which permits unrestricted use, distribution, and reproduction in any medium, provided the original work is properly cited.
1. INTRODUCTION
Usage of digital cameras is spreading rapidly as they are easy-to-use image input devices. The increasing popularity of dig-ital cameras has provided motivation to improve all elements of the digital photography signal. Digital color cameras are typically designed to use a single image sensor. Each indi-vidual sensor element is able to capture a single color. The arrangement of the color filters is called a color filter ar-ray (CFA). In the Bayer pattern [1], a popular CFA pattern, the sensor produces a two-dimensional array in which each spatial location contains only a red (R), green (G), or blue (B) component. Green pixels are sampled at a higher rate than blue and red pixels. The recovery of full-color images from a CFA-based detector requires a method for calculat-ing the values of the misscalculat-ing colors at each pixel. Such meth-ods are commonly referred to as interpolation or color-demosaicking algorithms.
A number of demosaicking algorithms [2–22] with an exploiting structure between channels have been proposed. These algorithms vary from fast with lower quality to more complex with higher quality and can be classified into two categories: noniterative [2–10] and iterative [12–16].
varying quotient is not enough to overcome the error around edges.
In addition, some algorithms [8] are very complex due to the need for matrix inversion and nonlinear operations. With others [9,10], the frequent switching between horizon-tal and vertical directions may break thin, low-contrast lines into pieces. One way to overcome this problem is to use an averaging filter (as suggested by the authors), but this leads to a smoothness problem, as will be shown in the simulation results.
The iterative algorithms update the initially interpolated image on the basis of the assumption that an improvement in one channel will lead to improvements in other channels. In Kimmel’s algorithm [12], the demosaicking is performed in two steps. The first step is reconstruction: the green com-ponent is first reconstructed using the red and blue gradi-ents, and then the red and blue ones are reconstructed using the green values, edge approximations, and a simple color ra-tio rule that says that, within a given “object,” the red/green ratio is locally constant (the same is true for the blue/green one). In the second step, the reconstructed full-color image is enhanced using an inverse diffusion filter. This algorithm is very complex due to the calculation of the color ratios in each iteration and the use of nonlinear operations for im-age enhancement. Moreover, convergence is not guaranteed. Gunturk et al. proposed an algorithm based on projections onto convex sets to refine the red and blue planes that alter-natively enforce the two convex-set constraints [13]. While this algorithm efficiently uses the spectral correlation, the spatial correlation is not incorporated effectively. An exten-sion of this algorithm incorporates spatial correlation [14]. It is used in a simultaneous demosaicking and super-resolution framework. It forces the full-color image to obey the color difference rule by inserting a color difference constraint in the alternative projection process. The main disadvantage of this algorithm is its complexity. It requires filtering in each iteration. Moreover, the incorporation of the spatial corre-lation property without avoiding smoothness across edges leads to color artifacts in the reconstructed image. The algo-rithm proposed by Su [16] effectively incorporates the spatial correlation in the initial step by using weighted-edge inter-polation. Both the refinement and iterative steps are based on a color difference rule, which states that (green-blue) and (green-red) color differences are constant within a region. The iteration is based on thresholding the variance of the change for each channel. If the variance is larger than a cer-tain value, the color difference rule is applied to that chan-nel. The main disadvantage of this algorithm is that there is no guarantee of convergence during the iteration since the iterative step is not convex, so the resulting full-color image depends on the initial estimation. In a way similar to Su’s al-gorithm [16], the idea of iteratively applying the color dif-ference rule in an algorithm has been proposed [15]. How-ever, this algorithm is more complex than Su’s and conver-gence is not guaranteed. In the algorithms of Farsiu et al. [23,24], the assumption of smooth luminance and chromi-nance is used in a simultaneous demosaicking and super-resolution framework. The main drawbacks of this algorithm are its complexity and the over-smoothness of chrominance
G11 R12 G13 R14 G15 R16
B21 G22 B23 G24 B25 G26
G31 R32 G33 R34 G35 R36
B41 G42 B43 G44 B45 G46
G51 R52 G53 R54 G55 R56
B61 G62 B63 G64 B65 G66
Figure1: Bayer pattern.
because avoiding smoothness across chrominance edges is not considered.
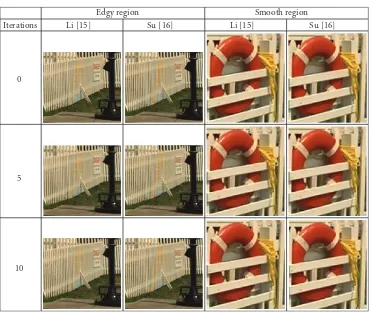
Although these iterative algorithms partially reduce the errors around edges, some of them produce errors in the smooth regions, as shown inTable 1, which presents exam-ples of the effect of an increasing number of iterations on the edgy and smooth regions. While the successive iterations re-duce the artifacts around the edges, the smooth regions are deformed with new artifacts.
We addressed three outstanding problems with demo-saicking algorithms: the deformation of smooth regions by successive iterations, the lack of convergence, and algorithm complexity. These problems can be overcome by iteratively enhancing only the edgy regions in the low-frequency band rather than the entire initially interpolated image because the chrominance is smoother in the low-frequency band than in the whole image. Moreover, a significant improvement in the quality of demosaicked images is obtained by combining enhancement of the low-frequency band with projection of high-frequency bands from known channels onto unknown channels as proposed by Gunturk et al. [13]. A dyadic fil-ter bank can be used to obtain the low-frequency and high-frequency bands. The enhancement is achieved by viewing the demosaicking as an optimization problem in which a cost function is minimized. The cost function is based on the ob-servation that the chrominance varies slowly in an object re-gion. Unlike the one used by Farsiu [24], the proposed cost function is defined as the weightedL2-norm of the chromi-nance in the low-frequency band, where edge indicators are used as weights to ensure slowly varying chrominance in each object region while high-frequency bands are reconstructed by projection. Using edge indicators helps to avoid smooth-ness in the chrominance across edges. Since the proposed cost function is positive definite quadratic by definition, it is guaranteed to converge to a global minimum. Compari-son of the proposed algorithm with seven demosaicking al-gorithms (both noniterative and iterative) showed that the proposed algorithm works well in producing full-color im-ages with fewer color artifacts in both the edgy and smooth regions.
The rest of this paper is organized as follows.Section 2 describes our iterative demosaicking algorithm and sug-gests an initial interpolation for fast convergence.Section 3 presents and discusses the simulation results.Section 4 con-cludes the paper with a brief summary.
Table1: Effect of iterations on edgy and smooth regions.
Iterations
Edgy region
Li [15] Su [16]
Smooth region
Li [15] Su [16]
0
5
10
by usingRi,j,Gi,j, orBi,j. For matrixAof sizeM×N,Ais defined as a lexicographically ordered vector of sizeMN×1.
2. PROPOSED ITERATIVE DEMOSAICKING ALGORITHM
We assume that the given color channels are sampled using the Bayer pattern [1] (seeFigure 1). Therefore, only one out of theR,G, andBvalues is known at each pixel. Our goal is to reconstruct the missing values. To achieve this goal, we devel-oped a fast and efficient demosaicking algorithm consisting of simple interpolation, projection of high-frequency bands of unknown values onto high-frequency bands of known val-ues, and chrominance enhancement in the low-frequency band. An illustrative example for the proposed algorithm is shown inFigure 2. A row-crossing edgy part is used to illus-trate the main steps. The dashed lines in the graphs indicate the original values for the blue channel, and the solid lines indicate the estimated values for the blue channel. There are four main steps:
(i) initial interpolation: each of the three channels is in-terpolated;
(ii) high-frequency bands projection: each initially inter-polated channel is subsampled into four subimages, then the high-frequency components of the unknown values are projected onto the high-frequency compo-nents of the corresponding known values;
(iii) low-frequency band optimization: the low-frequency band components are enhanced by optimizing the weighted L2-norm of the chrominance, and high-frequency bands of red and blue channels are forced to equal the high-frequency bands of green channel; (iv) postprocessing: the estimated color values at the
loca-tions of the known color values are replaced by the observed color values, and the estimated color values at locations of the unknown color values are projected onto the range [0, 255].
Note that the smooth regions in the low-frequency band of the initially interpolated image are not updated because an iterative update of a smooth region deforms it, as shown in Table 1. As the iteration number increases, degradation in the smooth regions increases. Also note that the low-frequency band of the green channel after it is interpolated in the initial stage is not updated in order to reduce complexity. Besides, in our framework, updating the green values leads to negligi-ble improvements. The initial interpolation, moreover, helps speed up convergence in the optimization step. The main steps of the proposed algorithm are described in more detail in the following subsections.
2.1. Initial interpolation
have proven to be effective in demosaicking [13,15,16], they have two drawbacks. First, they test whether each pixel be-longs to a horizontal or vertical edge, and this test is not al-ways accurate because it depends on the values in a single row or column. Second, because the difference between the vertical and horizontal colors is used to detect an edgy re-gion (directional area), a small variation in colors can lead to a wrong decision, that is, nondirectional regions are likely to be considered directional regions. We overcome these two drawbacks by using an interpolation method with two mod-ifications. The first is to use robust differentiation to deter-mine whether the current pixel is in a nondirectional or di-rectional (horizontal or vertical) region. This differentiation is done using a 3×5 (horizontal) or a 5×3 (vertical) mask. The second is to use a certain threshold, denoted byθ, that is used to determine the nondirectional regions. The algorithm for this more efficient interpolation method is as follows.
(1) Interpolate missing green values: missing green values are interpolated using modified edge-sensitive inter-polation. Each pixel is checked if it belongs to a pure horizontal edge, a pure vertical edge, or a nondirec-tional region using the following test:
(a) at the blue positions (such asB43inFigure 1),
G43=
⎧ ⎪ ⎪ ⎪ ⎪ ⎪ ⎪ ⎪ ⎪ ⎪ ⎪ ⎪ ⎪ ⎪ ⎪ ⎪ ⎪ ⎪ ⎨ ⎪ ⎪ ⎪ ⎪ ⎪ ⎪ ⎪ ⎪ ⎪ ⎪ ⎪ ⎪ ⎪ ⎪ ⎪ ⎪ ⎪ ⎩ 1 2
G33+G53
+1 4
2B43−B23−B63
ifΔH>ΔV+θ, 1
2
G42+G44
+1 4
2B43−B41−B45
else ifΔV>ΔH+θ, 1
4
G33+G53+G42+G44
+1 8
4B43−B23−B63−B41−B45
otherwise,
(1)
where
ΔH= 1
42G33−G31−G35+ 1
42G53−G51−G55 +1
2G42−G44+ 1
42B43−B41−B45 +1
2R32−R34+ 1
2R52−R54,
ΔV =1
42G42−G22−G62+ 1
42G44−G24−G64 +1
2G33−G53+ 1
42B43−B23−B63 +1
2R32−R52+ 1
2R34−R54.
(2)
Testing in the diagonal direction is omitted be-cause preliminary experiments showed that in-cluding a diagonal direction step in the test does not significantly improve the results;
(b) the same procedure is used at the red positions, but blue pixels are replaced by red ones.
(2) Interpolate missing blue values:
(a) at the known red positions (such as R34 in Figure 1),
B34=G34+1
4 B23−G23
+ B45−G45
+ B43−G43
+ B25−G25
; (3)
(b) at the known green positions (such asG33 and
G44inFigure 1),
B33=G33+ 1
2 B23−G23
+ B43−G43
,
B44=G44+1
2 B43−G43
+ B45−G45
.
(4)
(3) Interpolate missing red values:follow the same steps as for the blue values.
2.2. High-frequency bands projection
Since there is high correlation between the high-frequency components [13], high-frequency bands projection is per-formed by replacing the high-frequency components of the unknown colors with those of the known colors. This is done by obtaining four subimages for each of the three channels. For example, the green channel is regarded to have two subimages corresponding to the known green ues and two corresponding to the interpolated green val-ues. These subimages are obtained by downsampling each channel (as shown in Figure 3). The high-frequency bands of the subimages corresponding to unknown values are re-placed with the ones corresponding to known values. An example for the green channel that illustrates this step is shown in Figure 3. The high-frequency bands of the un-known green values are replaced with the high-frequency bands of the corresponding known red or blue values. The
RandB indicate the interpolated red and blue values, re-spectively, and GR and GB indicate the interpolated green values at known red and blue positions, respectively. The es-timated green values after high-frequency bands projection at the known red and blue positions are, respectively, de-noted byGR andGB. Once the subimages for each channel are reconstructed, they are recombined to reconstruct the full channel.
2.3. Low-frequency band optimization
After projection of the high-frequency bands of unknown values for all three channels onto the high-frequency bands of known values, each channel is decomposed into low-frequency and high-low-frequency bands using filter banks. How-ever, high-frequency bands are not changed; they are forced to equal the high-frequency bands of the green channel.
Initial interpolation Mosaicked image High-frequency bands projection H ig h -fr equency bands Su bband dec o mposition
Force high-frequency bands to equal high-frequency
bands of green channel
Re co n st ru ct io n Post-processing Low-frequency band optimization Lo w-fr equency band Demosaicked image 0 5 10 15 20 25 30 35 40 45 50
90 100 110 120 130 140 150 160 170 180
0 5 10 15 20 25 30 35 40 45 50 90 100 110 120 130 140 150 160 170 180
0 5 10 15 20 25 30 35 40 45 50 90 100 110 120 130 140 150 160 170 180
0 5 10 15 20 25 30 35 40 45 50 90 100 110 120 130 140 150 160 170 180
0 5 10 15 20 25 30 35 40 45 50 90 100 110 120 130 140 150 160 170 180
Figure2: Illustrative example of the proposed algorithm.
R R R R R R R R R R R R R R R R
Downsampling decompositionSubband
High-frequency bands
Downsampling decompositionSubband Interpolated red channel Interpolated green channel Interpolated blue channel Low-frequency band Reconstruction Downsampling Shift Subband decomposition Low-frequency band Reconstruction Downsampling Subband decomposition High-frequency bands Replacement R R R R
GR G R
GR G R
GR GR
GR GR
GB GB
GB GB
GB GB
GB GB
B B B B G GR G GR
GB G GB G G GR G GR GB G GB G
B B B B B B B B B B B B
B B B B G GR G GR
GB G GB G G GR G GR
GB G GB G
Table2: CMSE for test images.
Image Proposed Su Li POCS Hirakawa Zhang Lu Pei
1 11.5223 9.0701 9.5491 9.8627 20.1915 10.0229 48.4652 35.4014
2 6.6941 8.1973 7.1488 9.2067 8.2553 26.7206 14.0848 11.5806 3 4.1522 5.2607 5.1317 5.5116 4.9136 4.8436 8.7821 7.3658
4 8.6130 7.5209 8.1469 7.8791 14.2556 10.5272 29.0382 22.6715
5 10.9657 15.9342 14.8761 13.8602 18.6441 11.7424 42.4376 32.5822
6 8.6494 7.6680 8.1018 8.1252 11.4361 8.4658 34.7384 26.9961
7 4.0838 5.4185 4.6469 5.7639 5.8584 6.4146 9.7627 8.2171
8 17.6564 16.3399 16.9477 17.3349 27.2797 17.9737 93.4438 70.8990
9 3.5502 5.1127 4.2510 5.3213 4.3785 10.2184 8.0024 6.1832 10 5.1811 5.4941 6.1356 5.7750 8.1553 6.3844 14.4991 11.8602
11 7.3630 7.1778 8.0242 7.7097 11.4476 7.1311 25.4871 19.6494
12 22.2441 20.4843 24.6354 21.4891 32.9665 20.5274 52.7753 39.9807
13 24.1887 16.5642 21.3501 19.8854 47.3841 22.7666 84.4676 63.3374
14 14.8775 25.5082 22.8913 21.5165 19.0774 12.7567 32.0745 25.8959
15 8.1653 8.7452 8.7311 9.3909 10.9574 11.1007 14.1436 12.6439
16 3.9119 3.5109 4.2093 3.6718 4.6243 3.1003 15.6243 12.2054
17 4.5278 4.2685 5.1082 4.5449 7.5514 4.3734 13.4949 10.6898
18 3.7819 4.1147 4.0167 4.6106 4.9912 3.2537 12.2795 9.4206
19 6.3387 5.9186 6.5390 6.4372 9.5870 7.0495 35.0623 24.1324
20 3.9205 4.1727 4.3868 4.5715 5.7961 4.5516 12.1711 9.1130
Average 9.0194 9.3241 9.7414 9.6234 13.8875 10.4962 29.9683 22.1695
Table3: S-CIELAB metric (ΔEab) for test images.
Image Proposed Su Li POCS Hirakawa Zhang Lu Pei
1 1.2580 1.1994 1.2554 1.2675 1.2655 1.1808 1.8778 1.9168
2 0.7083 0.8288 0.7450 0.8854 0.8313 1.2427 1.0470 0.8619 3 0.5374 0.5989 0.5818 0.6075 0.5677 0.5422 0.7498 0.6107
4 0.9426 0.9227 0.9702 0.9635 1.0072 0.9778 1.3082 1.2325
5 1.0957 1.4254 1.3662 1.2927 1.3019 1.1403 1.8354 1.4773
6 0.9117 0.9093 0.9428 0.9532 0.8705 0.8735 1.4045 1.3525
7 0.6378 0.7329 0.6922 0.7569 0.6900 0.6872 0.8841 0.7282
8 1.4321 1.5043 1.5116 1.5459 1.4312 1.3867 2.5748 2.3764
9 0.5247 0.6356 0.5834 0.6365 0.6035 0.6377 0.7522 0.5644 10 0.5716 0.5940 0.6019 0.6146 0.6407 0.6129 0.8247 0.6970
11 0.8083 0.8204 0.8466 0.8576 0.8478 0.7641 1.2469 1.1156
12 1.1313 1.2049 1.2314 1.2045 1.3084 1.1308 1.5831 1.2792
13 1.7115 1.5818 1.7135 1.6925 1.9018 1.6234 2.4384 2.1515
14 1.0650 1.3373 1.2697 1.2550 1.1750 0.9907 1.5685 1.2791
15 0.6859 0.7571 0.7444 0.7872 0.8015 0.7427 0.9122 0.7302
16 0.6289 0.6309 0.6593 0.6548 0.5812 0.5611 0.9866 0.9360
17 0.5605 0.5566 0.5742 0.5806 0.6017 0.5265 0.7950 0.6928
18 0.6188 0.6497 0.6429 0.6904 0.6255 0.5654 0.8905 0.7698
19 0.7996 0.8211 0.8219 0.8675 0.8637 0.8159 1.4199 1.2509
20 0.5880 0.6076 0.6135 0.6427 0.6224 0.5875 0.8548 0.7108
(a) (b) (c) (d) (e)
(f) (g) (h) (i) (j)
(k) (l) (m) (n) (o)
(p) (q) (r) (s) (t)
Figure4: Original images (numbered from left-to-right and top-to-bottom).
smooth regions are not. The classification is based on “edge indicators,” which are coefficients that indicate existence of edges at certain pixel positions as will be discussed later. If the average number of edge indicators within a certain win-dow size [(2w+ 1)×(2w+ 1)] centered at location (i,j) is less than a certain threshold (θ1), this pixel location belongs to an edgy region; otherwise it belongs to a smooth one. The classification is represented by
CL∈RE ifeav< θ1,
CL∈RS otherwise,
(5)
where
eav(i,j)=
w
l=−w
w
m=−wel,mi,j (2w+ 1)2 ,
e0,0i,j =
1
1 +HLi,j+LHi,j+HHi,j
.
(6)
TheCLdenotes either the RL,GL, orBL, which is the low-frequency band component of the red, green, or blue chan-nel, respectively;wis a parameter that determines window
size;REandRSrepresent edgy and smooth regions, respec-tively; HLi,j,LHi,j, and HHi,j are coefficients of the high-frequency bands at position (i,j); andel,mi,j is a weight rep-resenting the edge indicator at position (i+l,j+m).
The main goal is to smooth the low-frequency compo-nents of the chrominance in the edgy regions. To do this, we propose to consider only pixel locations which belong to an edgy region (RE) and minimize the following cost function which is based on region-adaptive weights to avoid smooth-ness across edges:
J[RL,BL]= P
l=−P P
m=−P
Xcb−SlxSmyXcb
T
Wl,m X
cb−SlxSmyXcb
+ Xcr−SlxSmyXcr
T
Wl,m X
cr−SlxSmyXcr
∀RL,BL∈RE,
(7)
where
Wl,m=diag el,m
0 2 4 6 8 10 12 14 16 18 20 Iterations
2.95 3 3.05 3.1 3.15 3.2
×107 C o st function (a)
0 2 4 6 8 10 12 14 16 18 20
Iterations 23
23.5 24 24.5 25 25.5
CMSE
(b) Figure5: (a) Convergence of cost function; (b) corresponding convergence of CMSE.
andSl
xandSmy are shifting operators in directionsxandyby
landm, respectively.Wl,mis the normalized edge indicator matrix, which is a diagonal matrix consisting of elements
ei,jl,m=
el,mi,j
1
l=−1
1
m=−1el,mi,j
(9)
in lexicographical order;XcbandXcrare the chrominance re-arranged in lexicographical order:
Xcb= −0.169RL−0.331GL+ 0.5BL,
Xcr=0.5RL−0.419GL−0.081BL.
(10)
In the low-frequency band, full-color image enhancement is performed by optimizingJwith respect toRLandBL. Specif-ically, the recursion is given by
CLk+1=CkL−βCk∇kCLJ, (11)
where∇CLJ is the gradient ofJ with respect toCL,C
rep-resents a color channel (RorB),βCis a scalar representing the step size in the direction of the gradient ofCL, and super-scriptkrepresents thekth iteration. The gradient with respect to channelCLis
∇CLJ=2
P
l=−P P
m=−P
I−S−l x S−ym
Wl,m
×kcr(n)
Xcr−SlxSmyXcr
+kcb(n)
Xcb−SlxSmyXcb
, (12)
whereIis the identity matrix,βCk is determined by minimiz-ing the functionJ(Ck+1
L )=J(CLk−βkC∇kCLJ) [25] as follows:
JCk+1 L
= P
l=−P P
m=−P
Xcb−SlxSmyXcb
−kcb(n)βCk
∇k
CLJ−S
l xSmy∇kCLJ
T
Wl,m
×Xcb−SlxSmyXcb
−kcb(n)βkC
∇k
CLJ−S
l xSmy∇kCLJ
+Xcr−SlxSmyXcr
−kcr(n)βkC
∇k
CLJ−S
l xSmy∇kCLJ
T
Wl,m
×Xcr−SlxSmyXcr
−kcr(n)βkC
∇k
CLJ−S
l xSmy∇kCLJ
= P
l=−P P
m=−P
Xcb−SlxSmyXcb
T
Wl,mXcb−SlxSmyXcb
+Xcr−SlxSmyXcr
T
Wl,mXcr−SlxSmyXcr
+ βk Ckcb(n)
2
∇k
CLJ−S
l xSmy∇kCLJ
T
×Wl,m∇k
CLJ−S
l xSmy∇kCLJ
+ βk Ckcr(n)
2
∇k
CLJ−S
l xSmy∇kCLJ
T
×Wl,m∇k
CLJ−S
l xSmy∇kCLJ
−2βkCkcb(n)
Xcb−SlxSmyXcb
T
×Wl,m∇k
CLJ−S
l xSmy∇kCLJ
−2βkCkcr(n)
Xcr−SlxSmyXcr
T
×Wl,m∇k
CLJ−S
l xSmy∇kCLJ
.
(a) (b) (c)
(d) (e) (f)
(g) (h) (i)
Figure6: Part of image 19 containing smooth region: (a) original, (b) proposed, (c) POCS [14], (d) Su [16], (e) Li [15], (f) Hirakawa [9], (g) Zhang [10], (h) Pei [4], and (i) Lu [3] algorithms.
By differentiating this function with respect toβkCand then letting this differentiation equal zero, we can obtainβk
Cas fol-lows:
∂JCLk+1
∂βkC
= −2
P
l=−P P
m=−P
kcb(n)
Xcb−SlxSmyXcb
T
×Wl,m∇k
CLJ−S
l xSmy∇kCLJ
−2kcr(n)
Xcr−SlxSmyXcr
T
×Wl,m∇k
CLJ−S
l xSmy∇kCLJ
+ 2 kcb(n)
2
βCk
∇k
CLJ−S
l xSmy∇kCLJ
T
×Wl,m∇k
CLJ−S
l xSmy∇kCLJ
+ 2 kcr(n)
2
βkC
∇k
CLJ−S
l xSmy∇kCLJ
T
×Wl,m∇k
CLJ−S
l xSmy∇kCLJ
=2
P
l=−P P
m=−P
βk C kcb
2 + kcr
2
×∇k
CLJ−S
l xSmy∇kCLJ
T
Wl,m∇k CLJ−S
l xSmy∇kCLJ
−2kcb(n)
Xcb−SlxSmyXcb
T
×Wl,m∇k
CLJ−S
l xSmy∇kCLJ
−2kcr(n)
Xcr−SlxSmyXcr
T
×Wl,m∇k
CLJ−S
l xSmy∇kCLJ
=0.
(a) (b) (c)
(d) (e) (f)
(g) (h) (i)
Figure7: Part of image 19 containing edgy region: (a) original, (b) proposed, (c) POCS [14], (d) Su [16], (e) Li [15], (f) Hirakawa [9], (g) Zhang [10], (h) Pei [4], and (i) Lu [3] algorithms.
Therefore,
βCk =
Q1
Q2
, (15)
where Q1 =
P
l=−P
P
m=−P(∇kCLJ)
T
(I − S−l
x S−ym)Wl,m(I−
Sl
xSmy)(kcb(n)Xcb + kcr(n)Xcr), Q2 =
P
l=−P
P
m=−P(k2cb(n) +k2
cr(n))(∇kCLJ)
T (I−S−l
x S−ym)Wl,m(I−SlxSmy)∇kCLJ,kcb(n) and
kcr(n) are the coefficients in thenth term used to obtainXcb andXcr, respectively, as in (10);nequals 1 or 3 whenCequals
RorB, respectively.
2.4. Postprocessing
AfterKiterations of the optimization step, the cost function converges. The full-color channels are then reconstructed using the optimized low-frequency band and the projected high-frequency bands. After these two steps, the estimated values at the locations of the observed values are replaced by the observed ones. Also, due to the assumption that the color values are sampled using eight bits, the fully reconstructed image has to be projected onto the range [0, 255]:
C=Pc0 Pc1 CK
, (16)
where
Pc0 C
= I−Di,j∗Di,j
C+D∗i,jDi,jC,
Pc1 C
i=
⎧ ⎪ ⎪ ⎪ ⎨ ⎪ ⎪ ⎪ ⎩
0 ifCi<0,
Ci if 0≤Ci≤255, 255 ifCi>255.
(17)
Crefers to color channelsRandB,Di,jis the downsampling operator used to sample the pixels at locations (2m+i, 2n+j), wherem = 0,. . ., (M/2)−1 andn = 0,. . ., (N/2)−1;M
andNare assumed to be even numbers without loss of gen-erality, andDi,j∗ is the adjoint ofDi,j, that is, the upsampling operator. The projectionPc1(C) is performed by replacing values inC greater than 255 by 255 and values less than 0 by 0.
3. SIMULATION RESULTS
We tested our algorithm using 20 photographic images (test images are obtained fromhttp://r0k.us/graphics/kodak); see Figure 4. We compared the results with those of seven state-of-the-art demosaicking algorithms: the Su [16], Li [15], POCS [14], Hirakawa [9], Zhang [10], Lu [3], and Pei [4] algorithms. We compared the performance of these algo-rithms from three aspects. First, we compared their demo-saicked images using two objective quality measures: the color mean square error (CMSE) metric and the S-CIELAB metric (ΔE∗ab) [26]. We then compared their demosaicked images subjectively. Finally, we compared the computational complexity of the proposed algorithm with that of the other iterative algorithms [14–16] and with that of the optimal de-mosaicking solutions [9,10].
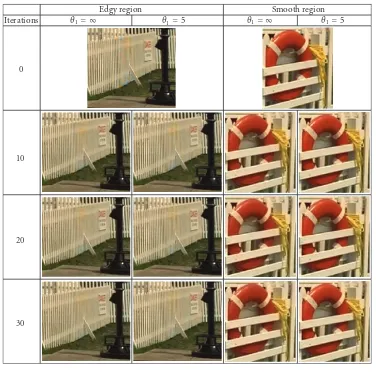
Table4: Effects of threshold (θ1) and iteration number on edgy and smooth regions.
Iterations
Edgy region
θ1= ∞ θ1=5
Smooth region θ1= ∞ θ1=5
0
10
20
30
as
hL=[ 1 2 1 ]/4,
hH=[ 1 −2 1 ]/4,
gL=[−1 2 6 2 −1 ]/8,
gH=[ 1 2 −6 2 1 ]/8,
(18)
wherehLandhHare the decomposition low-pass and high-pass filters, respectively, andgLandgHare the reconstruction ones, respectively.
3.1. Quality measure
Tables2and3show the CMSE and S-CIELAB metric results:
CMSE =
M
x=1
N
y=1
c=R,G,B[Ioc(x,y)−Irc(x,y)]2
3×M×N , (19)
whereM andN are the image dimensions, and IR o andIrR are the original and reconstructed red channels. The smallest values in each row are shown in bold. The proposed algo-rithm had the best average CMSE performance and the best average S-CIELAB performance.
The convergence of the cost function and the CMSE is shown in Figure 5. Five iterations were enough for conver-gence.
(a) (b) (c)
(d) (e) (f)
(g) (h) (i)
Figure8: Part of image 19 containing low-contrast, edgy region: (a) original, (b) proposed, (c) POCS [14], (d) Su [16], (e) Li [15], (f) Hirakawa [9], (g) Zhang [10], (h) Pei [4], and (i) Lu [3] algorithms.
artifacts with the Hirakawa [9] and Zhang [10] algorithms. These algorithms fail in regions that contain thin, low-contrast edges. This suggests the need to use subjective eval-uation along with objective measures.
Table 4shows the effects of the threshold and number of iterations in our algorithm. We used a part of the light-houseimage containing both smooth and edgy regions and performed 30 iterations. The table shows the resulting im-ages with and without the classification step (i.e., threshold
θ1 equals 10 and∞, resp.). Without using the classification step, the smooth region is deformed as the number of itera-tions increase.
3.2. Complexity
We compared the complexity of the proposed algorithm with that of the other iterative algorithms [14–16] and the opti-mal demosaicking solutions [9,10]. For our algorithm, we
usedP = 1 in (7), and we set the number of iterations for all the iterative algorithms to five, which is enough for most of the test images. For Hirakawa’s algorithm [9], we used two iterations in the postprocessing step as suggested by the au-thor. For Zhang’s algorithm [10], we used a constant, pre-computed, low-pass filter as used in the default parameters in the author’s MATLAB code. Therefore, in the complexity computation, we did not include the computations required to determine the adaptive filter.
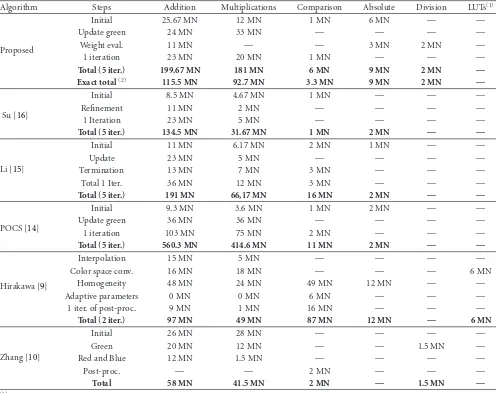
Table5: Computation complexity.
Algorithm Steps Addition Multiplications Comparison Absolute Division LUTs(1)
Proposed
Initial 25.67 MN 12 MN 1 MN 6 MN — —
Update green 24 MN 33 MN — — — —
Weight eval. 11 MN — — 3 MN 2 MN —
1 iteration 23 MN 20 MN 1 MN — — —
Total (5 iter.) 199.67 MN 181 MN 6 MN 9 MN 2 MN — Exact total(2) 115.5 MN 92.7 MN 3.3 MN 9 MN 2 MN —
Su [16]
Initial 8.5 MN 4.67 MN 1 MN — — —
Refinement 11 MN 2 MN — — — —
1 Iteration 23 MN 5 MN — — — —
Total (5 iter.) 134.5 MN 31.67 MN 1 MN 2 MN — —
Li [15]
Initial 11 MN 6.17 MN 2 MN 1 MN — —
Update 23 MN 5 MN — — — —
Termination 13 MN 7 MN 3 MN — — —
Total 1 Iter. 36 MN 12 MN 3 MN — — —
Total (5 iter.) 191 MN 66,17 MN 16 MN 2 MN — —
POCS [14]
Initial 9.3 MN 3.6 MN 1 MN 2 MN — —
Update green 36 MN 36 MN — — — —
1 iteration 103 MN 75 MN 2 MN — — —
Total (5 iter.) 560.3 MN 414.6 MN 11 MN 2 MN — —
Hirakawa [9]
Interpolation 15 MN 5 MN — — — —
Color space conv. 16 MN 18 MN — — — 6 MN
Homogeneity 48 MN 24 MN 49 MN 12 MN — —
Adaptive parameters 0 MN 0 MN 6 MN — — —
1 iter. of post-proc. 9 MN 1 MN 16 MN — — —
Total (2 iter.) 97 MN 49 MN 87 MN 12 MN — 6 MN
Zhang [10]
Initial 26 MN 28 MN — — — —
Green 20 MN 12 MN — — 1.5 MN —
Red and Blue 12 MN 1.5 MN — — — —
Post-proc. — — 2 MN — — —
Total 58 MN 41.5 MN 2 MN — 1.5 MN —
(1)LUTs: look-up tables operation.
(2)Exact total: the total number of operations when we exclude the smooth regions from computations.
MN, respectively, where M and N are the image dimensions. In addition, the proposed algorithm required 2 MN division operations to evaluate the weights and to weight the chromi-nance. The overall operations required by the proposed al-gorithm is about 50% of that required by POCS. Moreover, one iteration of the proposed algorithm requires only 44 MN operations which is less than the number required by both the alternative projection (144 MN operations) [14] and suc-cessive approximation (51 MN operations) [15] algorithms. This means that, if the number of iterations increases, the cost of the proposed algorithm will be less than that of both algorithms. Moreover, if we take into consideration the fact that the proposed algorithm performs the iteration step for only the edgy regions rather than the whole image, we see why the number of computations required by the proposed algorithm is reduced so much, as shown in the last row of Table 5. Experimentally, we found that only 47.7% of the to-tal area of the 20 test images is edgy.
4. CONCLUSION
quality and complexity points of view. The proposed al-gorithm overcomes the problem some iterative alal-gorithms have in smooth regions, the problem noniterative algorithms have in edgy regions, and the problem some optimal de-mosaicking solutions have in the low-contrast, edgy re-gions.
ACKNOWLEDGMENTS
The authors thank Dr. Bahadir K. Gunturk of Louisiana State University for sending them the MATLAB code for his al-gorithm and Dr. Xin Li at Western Virginia University, Dr. Chung-Yen Su at National Taiwan Normal University, Dr. Lei Zhang at Polytechnic University, Hong Kong, and Dr. Keigo Hirakawa at Cornell University for making the MATLAB code for their algorithms available on their web pages. Also, the authors would like to thank the reviewers for their useful comments which have greatly improved the paper. This work was supported in part by the Ministry of High Education, Egypt, and in part by the Telecommunications Advancement Foundation, Japan.
REFERENCES
[1] B. E. Bayer, “Color imaging array,” US patent no. 3 971 065, July 1976.
[2] D. Su and P. Willis, “Demosaicing of colour image using pixel level data-dependent triangulation,” inProceedings of the The-ory and Practice of Computer Graphics, pp. 16–23, Birming-ham, UK, June 2003.
[3] W. Lu and Y.-P. Tan, “Color filter array demosaicking: new method and performance measures,”IEEE Transactions on Im-age Processing, vol. 12, no. 10, pp. 1194–1210, 2003.
[4] S.-C. Pei and I.-K. Tam, “Effective color interpolation in CCD color filter arrays using signal correlation,”IEEE Transactions on Circuits and Systems for Video Technology, vol. 13, no. 6, pp. 503–513, 2003.
[5] M. R. Gupta and T. Chen, “Vector color filter array demosaic-ing,” inSensors and Camera Systems for Scientific, Industrial, and Digital Photography Applications II, vol. 4306 of Proceed-ings of SPIE, pp. 374–382, San Jose, Calif, USA, January 2001. [6] L. Chang and Y.-P. Tan, “Adaptive color filter array
demosaick-ing with artifact suppression,” inProceedings of the IEEE In-ternational Symposium on Circuits and Systems (ISCAS ’04), vol. 3, pp. 937–940, Vancouver, BC, Canada, May 2004. [7] R. Lukac, K. Martin, and K. N. Plataniotis, “Demosaicked
im-age post-processing using local color ratios,”IEEE Transactions on Circuits and Systems for Video Technology, vol. 14, no. 6, pp. 914–920, 2004.
[8] D. D. Muresan and T. W. Parks, “Demosaicing using optimal recovery,”IEEE Transactions on Image Processing, vol. 14, no. 2, pp. 267–278, 2005.
[9] K. Hirakawa and T. W. Parks, “Adaptive homogeneity-directed demosaicing algorithm,”IEEE Transactions on Image Process-ing, vol. 14, no. 3, pp. 360–369, 2005.
[10] L. Zhang and X. Wu, “Color demosaicking via directional lin-ear minimum mean square-error estimation,”IEEE Transac-tions on Image Processing, vol. 14, no. 12, pp. 2167–2178, 2005. [11] K. Hirakawa and T. W. Parks, “Joint demosaicing and denois-ing,”IEEE Transactions on Image Processing, vol. 15, no. 8, pp. 2146–2157, 2006.
[12] R. Kimmel, “Demosaicing: image reconstruction from color CCD samples,”IEEE Transactions on Image Processing, vol. 8, no. 9, pp. 1221–1228, 1999.
[13] B. Gunturk, Y. Altunbasak, and R. M. Mersereau, “Color plane interpolation using alternating projections,”IEEE Transactions on Image Processing, vol. 11, no. 9, pp. 997–1013, 2002. [14] M. Gevrekci, B. K. Gunturk, and Y. Altunbasak, “POCS-based
restoration of bayer-sampled image sequences,” in Proceed-ings of IEEE International Conference on Acoustics, Speech, Sig-nal Processing (ICASSP ’07), vol. 1, pp. 753–756, Honolulu, Hawaii, USA, April 2007.
[15] X. Li, “Demosaicing by successive approximation,” IEEE Transactions on Image Processing, vol. 14, no. 3, pp. 370–379, 2005.
[16] C.-Y. Su, “Highly effective iterative demosaicing using weighted-edge and color-difference interpolations,” IEEE Transactions on Consumer Electronics, vol. 52, no. 2, pp. 639– 645, 2006.
[17] K. H. Chung and Y. E. Chan, “Color demosaicing using vari-ance of color differences,”IEEE Transactions on Image Process-ing, vol. 15, no. 10, pp. 2944–2955, 2006.
[18] R. Lukac, K. N. Plataniotis, D. Hatzinakos, and M. Aleksic, “A novel cost effective demosaicing approach,”IEEE Transactions on Consumer Electronics, vol. 50, no. 1, pp. 256–261, 2004. [19] R. Lukac and K. N. Plataniotis, “Data adaptive filters for
de-mosaicking: a framework,” IEEE Transactions on Consumer Electronics, vol. 51, no. 2, pp. 560–570, 2005.
[20] R. Lukac and K. N. Plataniotis, “Color filter arrays: design and performance analysis,”IEEE Transactions on Consumer Elec-tronics, vol. 51, no. 4, pp. 1260–1267, 2005.
[21] B. C. de Lavar`ene, D. Alleysson, and J. H´erault, “Practical im-plementation of LMMSE demosaicing using luminance and chrominance spaces,”Computer Vision and Image Understand-ing, vol. 107, no. 1-2, pp. 3–13, 2007.
[22] B. K. Gunturk, J. Glotzbach, Y. Altunbasak, R. W. Schafer, and R. M. Mersereau, “Demosaicking: color filter array interpola-tion,”IEEE Signal Processing Magazine, vol. 22, no. 1, pp. 44– 54, 2005.
[23] S. Farsiu, D. Robinson, M. Elad, and P. Milanfar, “Robust shift and add approach to super-resolution,” inApplications of Digi-tal Image Processing XXVI, vol. 5203 ofProceedings of SPIE, pp. 121–130, San Diego, Calif, USA, August 2003.
[24] S. Farsiu, M. Elad, and P. Milanfar, “Multiframe demosaicing and super-resolution of color images,”IEEE Transactions on Image Processing, vol. 15, no. 1, pp. 141–159, 2006.
[25] R. Fletcher,Practical Methods of Optimization, John Wiley & Sons, New York, NY, USA, 2nd edition, 2006.
![Figure 7: Part of image 19 containing edgy region: (a) original, (b) proposed, (c) POCS [14], (d) Su [16], (e) Li [15], (f) Hirakawa [9], (g)Zhang [10], (h) Pei [4], and (i) Lu [3] algorithms.](https://thumb-us.123doks.com/thumbv2/123dok_us/899683.1587526/10.600.124.483.72.338/figure-containing-region-original-proposed-hirakawa-zhang-algorithms.webp)
![Figure 8: Part of image 19 containing low-contrast, edgy region: (a) original, (b) proposed, (c) POCS [14], (d) Su [16], (e) Li [15], (f)Hirakawa [9], (g) Zhang [10], (h) Pei [4], and (i) Lu [3] algorithms.](https://thumb-us.123doks.com/thumbv2/123dok_us/899683.1587526/12.600.181.421.71.463/figure-containing-contrast-region-original-proposed-hirakawa-algorithms.webp)