Eurasian Journal of Business and Economics 2010, 3 (5), 93-110.
Why Enforcing its UNCAC Commitments
Would be Good for Russia: A Computable
General Equilibrium Model
Michael P. BARRY
*Abstract
Russia has ratified the UN Convention Against Corruption but has not successfully enforced it. This paper uses updated GTAP data to reconstruct a computable general equilibrium (CGE) model to quantify the macroeconomic effects of corruption in Russia. Corruption is found to cost the Russian economy billions of dollars a year. A conclusion of the paper is that implementing and enforcing the UNCAC would be of significant economic benefit to Russia and its people. **
Keywords: Russia, corruption, computable general equilibrium, CGE, UN Convention against Corruption, UNCAC, Global Trade Analysis Project, GTAP
JEL Classification Codes:H50, O10, C32
*
Asst. Professor of Economics and Law, Mount St. Mary’s University, 16300 Old Emmitsburg Road, Emmitsburg, Maryland 21727, Phone: 301-447-5820 ext. 4816. Fax: 301-447-5335 Email: [email protected]
**
1. Introduction
The text of the U.N. Convention against Corruption was negotiated during seven sessions of the Ad Hoc Committee for the Negotiation of the Convention against Corruption, held between January 2002 and October 2003. This agreement was adopted by the General Assembly by resolution 58/4 in October 2003. The Convention needed 30 ratifications to come into force. In accordance with article 68 (1) of the resolution, the United Nations Convention against Corruption entered into force on 14 December 2005.
The Russian Federation signed the convention on December 9, 2003 and ratified it on May 6, 2006 (UN Office on Drugs and Crime, 2008). In total, 140 countries have signed the convention, and 116 have ratified it. Russia had a number of reservations, but none seemed very significant:
Table 1: Russian Federation Reservations to the UN Convention Against
Corruption
Reservation Content
1 The Russian Federation declares, in accordance with article 44, paragraph 6, subparagraph (a) of the Convention, that it will take the Convention as the legal basis for cooperation on extradition with other States Parties to the Convention, on a foundation of reciprocity.
2 The Russian Federation declares, on the basis of the last sentence of article 46, paragraph 13, of the Convention, that it will, on a foundation of reciprocity and in urgent circumstances, accept requests for mutual legal assistance and communications through the International Criminal Police Organization, provided that the documents containing such requests and communications are dispatched without delay in the prescribed manner.
3 The Russian Federation declares, in accordance with article 46, paragraph 14, of the Convention, that requests for mutual legal assistance and communications related thereto addressed to the Russian Federation must be accompanied by translations into Russian, unless otherwise established by an international agreement of the Russian Federation or unless otherwise arranged between the central authority of the Russian Federation and the central authority of the other State Party to the Convention.
Source: United Nations
Table 2: UN Convention Against Corruption: Article 5 Provisions
Promoting Prevention
Provision Content
1 Each State Party shall, in accordance with the fundamental principles of its legal system, develop and implement or maintain effective, coordinated anticorruption policies that promote the participation of society and reflect the principles of the rule of law, proper management of public affairs and public property, integrity, transparency and accountability.
2 Each State Party shall endeavor to establish and promote effective practices aimed at the prevention of corruption.
3 Each State Party shall endeavor to periodically evaluate relevant legal instruments and administrative measures with a view to determining their adequacy to prevent and fight corruption.
4 States Parties shall, as appropriate and in accordance with the fundamental principles of their legal system, collaborate with each other and with relevant international and regional organizations in promoting and developing the measures referred to in this article. That collaboration may include participation in international programs and projects aimed at the prevention of corruption.
Source: Article 5 of UN Convention Against Corruption
According to the UN, the major highlights of the convention include an emphasis on (a) prevention, (b) criminalization, (c) international cooperation, and (d) asset recovery. Article 5 of the Convention enjoins each State Party to establish and promote effective practices aimed at the prevention of corruption. Significant provisions of Article 5 are presented in Table 2.
Russia has also committed itself to criminalizing corruption. The Convention requires countries to establish criminal and other offences to cover a wide range of acts of corruption, if these are not already crimes under domestic law. In some cases, States are legally obliged to establish offences; in other cases, in order to take into account differences in domestic law, they are required to consider doing so. According to the UN Office of Drugs and Crime, the Convention goes beyond previous instruments of this kind, criminalizing not only basic forms of corruption such as bribery and the embezzlement of public funds, but also trading in influence and the concealment and laundering of the proceeds of corruption (UN Office on Drugs and Crime, 2008). Several provisions are aimed at criminalizing bribery or unjust enrichment of individuals. Table 3 presents selected provisions.
Finally, Russia’s ratification of the convention commits it to significant provisions on asset-recovery. Article 51 provides for the return of assets to countries of origin as a fundamental principle of this Convention (UN Convention Against Corruption, Chapter V, Article 51). Article 43 obliges state parties to extend the widest possible cooperation to each other in the investigation and prosecution of offences defined in the Convention (UN Convention Against Corruption, Chapter IV, Article 43).
Table 3: Selected Criminalization Provisions of the UN Convention Against
Corruption
Article Provision Article
15
Bribery of national public officials
Each State Party shall adopt such legislative and other measures as may be necessary to establish as criminal offences, when committed intentionally:
(a) The promise, offering or giving, to a public official, directly or indirectly, of an undue advantage, for the official himself or herself or another person or entity, in order that the official act or refrain from acting in the exercise of his or her official duties;
(b) The solicitation or acceptance by a public official, directly or indirectly, of an undue advantage, for the official himself or herself or another person or entity, in order that the official act or refrain from acting in the exercise of his or her official duties.
Article 17
Embezzlement, misappropriation or other diversion of property by a public official
Each State Party shall adopt such legislative and other measures as may be necessary to establish as criminal offences, when committed intentionally, the embezzlement, misappropriation or other diversion by a public official for his or her benefit or for the benefit of another person or entity, of any property, public or private funds or securities or any other thing of value entrusted to the public official by virtue of his or her position.
Article 20
Illicit enrichment
Subject to its constitution and the fundamental principles of its legal system, each State Party shall consider adopting such legislative and other measures as may be necessary to establish as a criminal offence, when committed intentionally, illicit enrichment, that is, a significant increase in the assets of a public official that he or she cannot reasonably explain in relation to his or her lawful income.
Article 21
Bribery in the private sector
Each State Party shall consider adopting such legislative and other measures as may be necessary to establish as criminal offences, when committed intentionally in the course of economic, financial or commercial activities:
(a) The promise, offering or giving, directly or indirectly, of an undue advantage to any person who directs or works, in any capacity, for a private sector entity, for the person himself or herself or for another person, in order that he or she, in breach of his or her duties, act or refrain from acting;
(b) The solicitation or acceptance, directly or indirectly, of an undue advantage by any person who directs or works, in any capacity, for a private sector entity, for the person himself or herself or for another person, in order that he or she, in breach of his or her duties, act or refrain from acting.
2. Russia’s Record on Corruption
Russia has ratified the UNCAC, but enforcement is a different matter. As suggested by Robert Orttung, in September 2006, Russian President Vladimir Putin declared that an inability to make much progress in the battle against corruption was one of his administration’s greatest failures. In fact, rising corruption has been a direct consequence of Putin’s policies to strengthen the state and to crack down on many elements of Russia’s civil society (Orttung, 2006). Several organizations seem to agree that corruption in Russia decreased in the early years of Putin’s administration, but has increased again in the last couple years. These organizations include Transparency International, the World Bank, and Freedom House. While the overall number of bribes may be shrinking, the size of the bribes is growing (Orttung, 2006).
One study of corruption in the Russian Federation questioned 1,502 people on their views of corruption. Forty-three percent of respondents said that corruption didn’t affect their families’ lives and 29% said that it “affected it to a small degree.” But 36% of the respondents held that there was a “medium” degree of influence of corruption in the business environment, and 32% described it as “strong.” More than a half the respondents (54%) said that corruption influences Russian political life “very strongly.” (Panfilova , 2006).
A Gallup Poll from Russia suggests the problem is even more widespread. In answering the question, "Is corruption widespread throughout the government in your country?" 80% of respondents gave an affirmative reply. Similarly, 79% replied affirmatively to the question, "Is corruption widespread within businesses located in your country?" (Gradirovski and Esipova, 2006). Only seven percent of Russians say they are satisfied with efforts to control crime and corruption in the country. In comparison, more than three times as high a percentage (23%) claim satisfaction in Italy, Turkey, and Mexico (Gradirovski and Esipova, 2006). The percentages in the United States (47%), Canada (47%), and France (50%) who say they are satisfied with control of crime and corruption are about seven times as high as that in Russia (Gradirovski and Esipova, 2006).
higher learning, in Housing Management Agencies, and in child care centers --
comprising about $3 billion of that.1
Transparency International placed Russia at 121 out of 163 countries in its Corruption Perceptions Index for 2006. Moscow has been placed 28th out of 30 in the 2005 rating of which cities are desirable places in which to do business (Novye izvestia, 2005). But in 2005, A.T. Kearney placed Russia in sixth place in its rating of attractiveness for investors. Russia’s country risk ranking, according to Euromoney in March 2005, moved up to 61 out of 185 countries surveyed, while Institutional Investor for the same month placed Russia at 58 out of 173 countries (BOFIT Weekly, April 15 2005). In its 2006 corporate governance ratings, the World Bank placed Russia at 151 out of 208 countries, behind Zambia, Uganda, and Swaziland,
(Moscow Times, September 182006) while its Doing Business survey put Russia at
96 out of 175 countries (BOFIT Weekly, September 15 2005). In the Transparency International’s Bribe Payers Index for 2006, Russia was placed 28th out of 30
countries(Moscow Times, October 52006). And in the 2007 International Property
Rights ranking, Russia came in at 63rd out of 70 countries (Moscow Times, 2007).
In conclusion, while Russia has signed and ratified the UN Convention Against Corruption, survey and other data suggest that Russia has yet to enforce the provisions of that convention. The question for this paper is this: how much does a failure to enforce the UNCAC cost Russia? Answering this question will require some assumptions and the use of a large mathematical model.
3. CGE Model for Corruption in Russia
This section will develop a computable general equilibrium model to quantify the macroeconomic effects of corruption in Russia and on its trading partners. The section is broken into several parts, including, (a) a background of CGE models; (b) the Global Trade Analysis Project (GTAP); (c) the structure of this paper’s model, (d) model results; (e) model limitations and future research.
3.1. Background of General Equilibrium Models
General equilibrium, a concept which dates back to Leon Walras (1834-1910), is a pillar of modern economic thought. General equilibrium recognizes that there are many markets in an economy, and that these markets all interact in complex ways with each other. In rough terms, everything depends on everything else. Demand for any one good depends on the prices of all other goods and on income. Income, in turn, depends on wages, profits, and rents, which depend on technology, factor supplies and production, the last of which, in its turn, depends on sales (i.e., demand). Prices depend on wages and profits and vice versa (Hertel, et al., 2007).
Computable General Equilibrium (CGE) modeling specifies all economic relationships in mathematical terms and puts them together in a form that allows the model to predict the change in variables such as prices, output and economic welfare resulting from a change in economic policies. To do this, the model requires information about technology (the inputs required to produce a unit of output), policies and consumer preferences. The key of the model is “market clearing,” the condition that says supply should equal demand in every market. The solution, or “equilibrium,” is that set of prices where supply equals demand in every market— goods, factors, foreign exchange, and everything else (Hertel, et al., 2007).
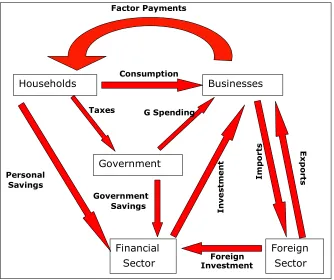
As presented in Figure 1, a CGE model is a closed system. This means that no production or financial flow escapes the system and none are created outside of the system. In basic closure terms, we assume output will equal income. Households, businesses, the government, and the financial sector, and the foreign sector are all connected by real flows and financial flows. Intuitively, the idea of a “general” equilibrium is captured; any given market is connected to all of the other markets for the system.
Figure 1: Factor Payments
Source: Created by the author
Households Businesses
Government
Financial Sector
Foreign Sector
Foreign Investment Factor Payments
Personal Savings
G Spending
I
n
v
e
s
tm
e
n
t
I
m
p
o
r
ts E
x
p
o
rt
s
Taxes
Consumption
Over the last 25 years, CGE models have become an important tool for analyzing economic issues, including trade policy, taxation policy, technological growth, energy policy, environmental issues, and even warfare. This development is explained by the ability of CGE models to provide an elaborate and realistic representation of the economy including the linkages between all agents, sectors and other economies. While this complete coverage permits a unique insight into the effects of changes in the economic environment throughout the whole economy, single country, and especially global CGE models very often include an enormous number of variables, parameters and equations (Brockmier, 2001).
CGE modeling is a very powerful tool, allowing economists to explore numerically a huge range of issues on which econometric estimation would be impossible; in particular to forecast the effects of future policy changes. The models have their limitations, however. First, CGE simulations are not unconditional predictions but rather ‘thought experiments’ about what the world would be like if the policy change had been operative in the assumed circumstances and year. The real world will doubtless have changed by the time we get there. Second, while CGE models are quantitative, they are not empirical in the sense of econometric modeling: they are basically theoretical, with limited possibilities for rigorous testing against experience. Third, conclusions about trade and other policies are very sensitive to data assumption. One can readily do sensitivity analysis on the parameter values assumed for economic behavior, although less so on the data, because altering one element of the base data requires compensating changes elsewhere in order to keep the national accounts and social accounting matrix in balance. Of course, many of these criticisms apply to other types of economic modeling, and therefore, while imperfect, CGE models remain the preferred tool for analysis of many global issues.
3.2. The Global Trade Analysis Project
One of the most widely-used CGE models is the GTAP Model. The Global Trade Analysis Project (GTAP), with headquarters at Purdue University, has organized a consortium of national and international agencies which provide guidance and base-level support for the Project (GTAP, 2008).
GTAP is a multi-regional CGE model which captures world economic activity in 57 different industries of 66 regions. The underlying equation system of GTAP includes two different kinds of equations. One part covers the accounting relationships which ensure that receipts and expenditures of every agent in the economy are balanced. The other part of the equation system consists of behavioral equations which based upon microeconomic theory. These equations specify the behavior of optimizing agents in the economy, such as demand functions (Brockmier, 2001). Input-out tables summarize the linkages between all industries and agents.
thousands of markets are “aggregated” into groups. For example, ‘transport and communications services’ appear as a single industry. In principle all the relationships in a model could be estimated from detailed data on the economy over many years. In practice, however, their number and parameterization generally outweigh the data available. In the GTAP model, only the most important relationships have been econometrically estimated. These include the international trade elasticities and the agricultural factor supply and demand elasticities. The remaining economic relationships are based on literature reviews.
3.3. Structure of this Paper’s Model
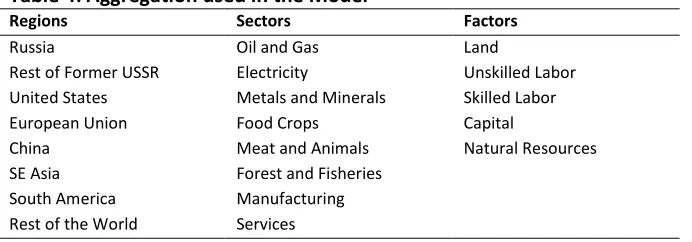
The model employed in this paper is that of the GTAP project. While the core database has 57 sectors and 66 regions, I have aggregated the matrices to simplify the world into just eight sectors, eight regions, and five factors of production. This aggregation is described in Table 4.
The data is first, “calibrated,” meaning the model is solved for its original equilibrium prices and volumes in all markets. This baseline is meant to represent the economy as is, before any shock takes place. Thousands of equations are created, each representing supply and demand conditions in markets inside each region, including markets for goods, services, factors of production, savings, government expenditure, and more. Equations are also generated for trade of all goods between each of the regions, separately created for each industry. The calibrated result is a large set of simultaneous equations, of which the solution matches the existing prices and quantity levels of the economy.
Table 4: Aggregation used in the Model
Regions Sectors Factors
Russia Oil and Gas Land
Rest of Former USSR Electricity Unskilled Labor United States Metals and Minerals Skilled Labor
European Union Food Crops Capital
China Meat and Animals Natural Resources
SE Asia Forest and Fisheries
South America Manufacturing Rest of the World Services
Source: Generated by Author
The “shock” in this model is the introduction of a tax on business, an income tax. In this sense, corruption is modeled as a cost of doing business (or participating in the economy). The revenues of this tax are not accrued to the government, but to other individuals in the economy. From a businessperson’s perspective, paying for corruption is just another cost of doing business, like a tax.
Theoretically, any tax on markets is thought to distort economic decisions and interfere with efficiency. From the producers’ side, a tax changes relative incomes. Producers change the amount of production, the type of production, and the method of production (inputs). On the consumers’ side, the tax changes the relative prices of goods. Income and substitution effects push the consumer to change the amount of his or her consumption and the choice of which goods to consumer. Together these changes in production and consumption are thought to result in an efficiency loss. More inputs are used to produce the same outputs, and
the economy consumes a different mix of goods.2
3.4. Model Results
The experiment in this model is a 5 percent “corruption tax,” applied to all sectors in the Russian economy. The pre-shock tax rates of each sector are presented in the first column of Table 5. The “corruption tax” is added to each sector, resulting in the second column of numbers. The goal of the GGE model will be to trade the ripple effects of these tax increases through the entire Russian economy.
Table 5: Russian Output tax by Sector (Percent)
RTO Initial rTO With Shock rTO
1 Land 6.8 11.8
2 UnSkLab 21.5 26.5
3 SkLab 21.5 26.5
4 Capital 6.8 11.8
5 NatRes 6.8 11.8
6 OilGas 18.7 23.7
7 Electricity 2.8 7.8
8 MetalsMin 3.3 8.3
9 FoodCrops 1.5 6.5
10 MeatAnimals -0.5 4.5
11 ForestFish 2.9 7.9
12 Mnfcs 2.5 7.5
13 Svces 2.6 7.6
14 CGDS 0 5
Source: Generated by Author
Gross Domestic Product (GDP) is a measure of the final value of all production of goods and services within the borders of the Russian Federation. As shown in Table 6, according to the model, the taxing effect of corruption results in a $1.98 billion decrease in Russian GDP. In other words, assuming a modest 5 percent burden on Russian business, corruption in Russia is costing the economy nearly $2 billion each year.
Table 6: Change in Russian GDP (Millions of Dollars)
Qgdp (Sim) Pre Post Change
Russia -0.64 309,948 307,963 -1,984.9
RestofUSSR -0.03 104,328 104,296 -32.6
USA 0 10,082,155 10,082,199 44.0
EU 0.01 7,929,525 7,930,110 585.0
China 0 1,321,825 1,321,828 3.5
SEAsia 0 5,531,997 5,532,130 133.5
SAmerica 0.01 1,345,630 1,345,704 74.0
ROW 0.01 4,653,195 4,653,461 266.0
Source: Generated by Author
While GDP measures the amount of production in the Russian economy, a slightly different question is what effect corruption has on consumer welfare—the utility consumers in Russia enjoy from consuming goods. As shown in Table 7, according to the model, corruption causes a $2.4 billion decrease in consumer welfare. This measure is made up of three parts. First is the allocative efficiency loss of $2.98 billion. This loss is equivalent to the decrease in GDP, and represents a loss in efficiency—that the same inputs produce less output in the presence of corruption. The second element to welfare loss is the $3.6 billion loss in Russian terms of trade. A terms of trade loss represents a drop in global competitiveness caused by corruption. A country exports goods in order to earn foreign exchange needed to purchase imports. With corruption, Russia will receive fewer imports in exchange for its exports.
These welfare losses are partially offset by a gain in savings and investment efficiency. While corruption and rent seeking is a distorting cost of doing business, there are individuals who are the recipients of the bribes and payoffs. These individuals have a source of extra funds now—available for savings, investment, or more consumption. This welfare gain, however, is not enough to make up for the loss in allocative efficiency and terms of trade. The total effect of corruption, according the model, remains a negative $2.4 billion.
percent), food crops (4.0 percent), and forest and fisheries (4.3 percent). But this is at the expense of other sectors in which production decreases, including electricity production 0.1 percent), manufacturing 0.3 percent), and the service industry (-2.7 percent).
Table 7: Welfare Effects (Millions of Dollars)
WELFARE
Allocative Efficiency
Endow
ments Technology Population
Terms of Trade
Savings and
Investment Total
1 Russia -1,984.9 0.0 0.0 0.0 -3,570.6 3,165.5 -2,389.9
2RestofUSSR -32.6 0.0 0.0 0.0 68.6 -8.2 27.8
3 USA 44.4 0.0 0.0 0.0 1,524.5 -100.3 1,468.6
4 EU 584.8 0.0 0.0 0.0 1,793.6 -759.3 1,619.0
5 China 3.5 0.0 0.0 0.0 345.6 -529.5 -180.5
6 SEAsia 133.6 0.0 0.0 0.0 1,642.0 -1,116.7 658.9
7 SAmerica 74.0 0.0 0.0 0.0 -70.2 -91.5 -87.7
8 ROW 266.0 0.0 0.0 0.0 -1,733.4 -559.9 -2,027.3
Total -911.1 0.0 0.0 0.0 0.0 0.0 -911.1
Source: Generated by Author
Possibly the most worrying output result, however, is the 39.8 percent drop in the output of capital goods. While the GTAP model is not well equipped to analyze dynamic changes in investment and future incomes, this decrease in capital good production is significant. Capital goods are expenditures by businesses to increase their future production capacity: factories, research and development, equipment, infrastructure. A decrease in this output represents both a current drop in output and, probably more importantly, a drop in future output potential. Even without corruption, the Russian Federation would be suffering from extremely low levels of business investment. That corruption would so strongly impact what little investment already takes place is striking. Corruption is hurting the present and the future of Russia.
Table 8: Change in Output, by sector (Percent)
Qo Russia
Restof
USSR USA EU China SEAsia SAmerica ROW
OilGas 3.5 -0.72 -0.57 -0.66 -0.52 -0.63 -0.6 -0.63 Electricity -0.14 0.14 -0.02 0 -0.02 -0.03 -0.02 0.03 MetalsMin 9.31 0.01 -0.16 -0.17 -0.09 -0.25 -0.16 -0.15 FoodCrops 4.09 -0.21 -0.04 -0.05 -0.01 -0.05 -0.08 -0.05 MeatAnimals 1.83 -0.1 -0.05 -0.1 0.01 -0.02 -0.06 -0.03 ForestFish 4.31 -0.04 -0.08 -0.09 -0.08 -0.11 -0.03 -0.02
Mnfcs -0.26 -0.04 -0.04 0 0.01 -0.08 0.16 0.29
Svces -2.73 0.13 0.02 0.02 0.03 0.04 0.02 -0.01
CGDS -39.8 0.74 0.31 0.38 0.2 0.38 0.38 0.36
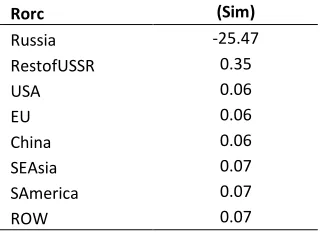
The significant drop in production of capital goods is caused by a significant decrease in returns on business investment. As shown in Table 9, the rate of return
on capital in Russia decreases by 25.5 percent.3 Businesses and individuals in Russia
see a much weaker incentive to take risks on innovation, invention, entrepreneurship, and investment. Apparently, a corruption tax disproportionately falls on capital good output. Again, this is a serious drag on economic growth for the Russian Federation.
Table 9: Rate of Return on Capital (Percent Change)
Rorc (Sim)
Russia -25.47
RestofUSSR 0.35
USA 0.06
EU 0.06
China 0.06
SEAsia 0.07
SAmerica 0.07
ROW 0.07
Source: Generated by Author
These results are consistent with economic literature. According to the International Monetary Fund (IMF), corruption may reduce investment by adding to its cost and by acting as a tax on its returns, and by adding to uncertainty. According to John Roaf of the IMF, high levels of corruption are likely to have been an especially important factor behind Russia’s extremely low level of foreign direct investment, for several reasons: (i) the relatively large size of foreign investments, and the special regulations applying to them, are particularly conducive to rent-seeking; (ii) local companies may use corruption to shut foreign competitors out; and (iii) foreigners lack specific knowledge of how to operate in a particular corrupt environment (Roaf, 2000).
From a Russian consumer’s perspective, corruption leads results in decreased consumption. As shown in Table 10, according to the CGE model, a 5 percent “corruption tax” results in a 7.2 percent decrease in Russian private consumption. Corruption leads to lower personal income, and thus less consumption. It also changes relative prices, producing substitution effects as consumers try to change their consumption away from more expensive goods and towards cheaper ones.
Table 10: Private Consumption (Percent Change)
Yp (Sim)
Russia -7.15
RestofUSSR -0.35
USA 0.19
EU 0.14
China 0.13
SEAsia 0.21
SAmerica 0.13
ROW 0.06
Source: Generated by Author
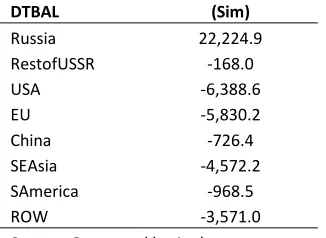
In addition to internal economic impacts, corruption appears to significantly affect Russia’s trade with other countries of the world. As shown in Table 11, according to the CGE model, this 5 percent “corruption tax” actually results in a $22.2 billion increase in Russia’s trade balance. This would not be inconsistent with the large terms of trade loss Russia experiences. Given Russia’s terms of trade, it would now take more Russian exports to finance the same number of imports. This would explain an increase in net exports. While Russia’s net exports increase, the trade balances of its trading partners decrease, including those of the United States (-6.4 billion), the European Union (-$5.8 billion), South and East Asia (-$4.6 billion), South America (-$1.0 billion), and the rest of the world (-$3.6 billion).
Table 11: Change in Trade Balances (Millions of Dollars)
DTBAL (Sim)
Russia 22,224.9
RestofUSSR -168.0
USA -6,388.6
EU -5,830.2
China -726.4
SEAsia -4,572.2
SAmerica -968.5
ROW -3,571.0
Source: Generated by Author
Table 12: Change in Trade Balances by Sector (Millions of Dollars)
DTBALi Russia
Restof
USSR USA EU China SEAsia SAmerica ROW
OilGas 2513.74 -27.28 560.3 733.17 -23.77 489.11 -430.79 -3843.45 Electricity -61.03 45.61 -9.54 3.21 -0.3 -0.41 -3.61 26.07 MetalsMin 3839.22 23.32 -753.25 -1100.17 -253.82 -790.49 -177.43 -810.39 FoodCrops 1685.77 -167.49 -315.66 -376.29 -56.63 -316.55 -156.49 -231.74 MeatAnimals 96.7 -11.93 -8.32 -36.72 -12.36 -9.87 -1.35 -17.1 ForestFish 180.51 -0.4 -13.62 -40.24 -24.77 -33.7 -2.2 -60.45 Mnfcs 6864.89 -136.57 -4048.72 -2459.41 -114.6 -2669.8 79.98 2380.14 Svces 7105.06 106.72 -1799.79 -2553.7 -240.16 -1240.46 -276.65 -1014.06
Source: Generated by Author
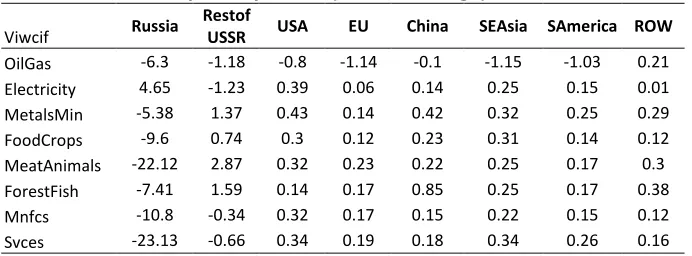
Exports and imports are examined individually in Table 13 and Table 14. In general, Russian exports increase in every sector and Russian imports decrease in every sector, except in the electricity sector. Sectors with the highest percent increase of exports in Russia include services (25.8 percent), meat and animals (23.6 percent), food crops (17.8 percent), and metals and minerals (15.0 percent). Sectors with the largest percent decrease in Russian imports include services (-23.1 percent), meat and animals (-22.1 percent), manufacturers (-10.8 percent), and forest and fisheries (-7.4 percent).
Table 13: Value of Exports by Sector (Percent Change)
Vxwfob Russia
Restof
USSR USA EU China SEAsia SAmerica ROW
OilGas 6.63 -2.04 -4.91 -2.12 -4.31 -2.48 -2.64 -1.93 Electricity -7.24 2.43 -0.44 0.11 0.08 -0.01 -0.01 0.28 MetalsMin 14.95 0.75 -0.74 -0.36 -0.32 -0.62 -0.37 -0.27 FoodCrops 17.75 -2.83 -0.3 -0.09 -0.1 -0.16 -0.24 -0.1 MeatAnimals 23.63 -3.47 -0.11 -0.37 -0.31 -0.13 -0.1 -0.12 ForestFish 10.51 0 -0.75 -0.61 -0.79 -0.85 -0.3 -0.81
Mnfcs 9.53 -1.39 -0.2 0 0.09 -0.13 0.36 0.47
Svces 25.81 0.53 -0.51 -0.26 -0.12 -0.32 -0.39 -0.25
Table 14: Value of Iports by Sector (Percent Change)
Viwcif Russia
Restof
USSR USA EU China SEAsia SAmerica ROW
OilGas -6.3 -1.18 -0.8 -1.14 -0.1 -1.15 -1.03 0.21 Electricity 4.65 -1.23 0.39 0.06 0.14 0.25 0.15 0.01 MetalsMin -5.38 1.37 0.43 0.14 0.42 0.32 0.25 0.29 FoodCrops -9.6 0.74 0.3 0.12 0.23 0.31 0.14 0.12 MeatAnimals -22.12 2.87 0.32 0.23 0.22 0.25 0.17 0.3 ForestFish -7.41 1.59 0.14 0.17 0.85 0.25 0.17 0.38 Mnfcs -10.8 -0.34 0.32 0.17 0.15 0.22 0.15 0.12 Svces -23.13 -0.66 0.34 0.19 0.18 0.34 0.26 0.16
Source: Generated by Author
3.5. Model Limitations and Future Research
This experiment raises several methodological questions. First, the magnitude and character of corruption costs to businesses are worth exploring. While this model imposes an empirically-supported “corruption tax” on businesses (as provided from survey data), that 5 percent tax on business is assumed to be the same across sectors. It would be reasonable to assume corruption is stronger in some sectors and weaker in others, so a better experiment would be one which allowed for these sectoral differences.
Second, this model is a static model. It does not capture the changes in capital infrastructure and production capacity over time. While the current effect on capital goods output is apparent, the long-term effect of that drop in production capacity is not modeled here. It would surely increase the final cost of corruption to society, as measured by a model.
Finally, while this experiment quantifies economic impacts of corruption, the causal relationship between anti-corruption laws and lower corruption remains an assumption of the model. A conclusion of the paper is that Russia should increase its laws and regulations in the battle against corruption, but exactly how much that campaign would change the numbers in this study is not clear.
4. Policy Implications
tax” distorts markets and causes change in producer and consumer behavior. The net result is a welfare loss to the Russia economy.
According to Robert Ortung of the CSIS, four components would define an effective anti-corruption policy in Russia (Orttung, 2006).The first would be to reduce and reform the current bureaucracy (Orttung, 2006). The second would be to allow society to hold its government accountable through mechanisms such as a free press, an active and independent civil society, and competitive elections (Orttung, 2006). A third feature of an anti-corruption policy would be the decentralization of power from the federal level to regional and local levels, providing for a system of checks and balances between the three levels of government (Orttung, 2006). Finally, Russia should try to address inequality between Moscow and St. Petersburg and the rest of the country (Orttung, 2006).
On the same lines, economists from the IMF suggest measures which would reduce opportunities for corruption by eliminating discretionary elements of government policy. In particular, a more transparent and well-administered tax-collection
system would reduce bribery and official corruption (Roaf, 2000). Equally
important, is government regulation and licensing of economic activity. According to the IMF, the average new business applicant must deal with 20-30 registration and licensing agencies. Simply cataloguing all the regulations applying to business would be useful in helping expose which regulations are economically justifiable and which exist mainly to extort rents (Roaf, 2000).
The list of suggestions go on and on, and the problems of corruption seems well appreciated. The contribution of this paper has been to quantify the impact of these problems. And in a general way, it emphasized the importance of adhering to a philosophy that corruption is detrimental to an economy. Whether it is the UN Convention Against Corruption, an agreement with the OECD, an internal campaign to reduce corruption, or a change in the behavior of Russian citizens themselves, the message is clear. Corruption comes at a cost. Russia should comply with the UNCAC.
References
BOFIT Weekly, Russia, April 15, 2005. BOFIT Weekly, September 15, 2006.
Brockmier, Martina (2001). “A Graphical Exposition of the GTAP Model,” GTAP Technical Paper No. 8, October 1996, Minor Edits, January 2000, Revised, March 2001.
Global Trade Analysis Project (GTAP) (2008), Department of Agricultural Economics, Purdue University, Website: https://www.gtap.agecon.purdue.edu/about/consortium.asp.
Hertel, T., Keeney, R., Ivanic M. and Alan Winters, L (2007). Distributional effects of WTO agricultural reforms in rich and poor countries. Economic Policy (April): 289-337.
Moscow Times, March 7, 2007. Moscow Times, October 5, 2006. Moscow Times, September 18, 2006. Novye izvestia, October 10, 2005.
Orttung, Robert (2006). Causes and Consequences of Corruption in Putin’s Russia, PONARS Policy Memo No. 430, Center for Strategic and International Studies (December).
Panfilova, Elena (2006), Corruption Levels in the Russian Federation: Research Data for 2006. Center for Anti-Corruption Research and Initiatives, Transparency International-Russia. (November).
Roaf, James (2000). Corruption in Russia, International Monetary Fund, European II Department, Conference on Post-Election Strategy, Moscow, April 5-7, 2000
UN Convention Against Corruption (2008), Text available at http://www.unodc.org/pdf/crime/convention_corruption/signing/Convention-e.pdf. Accessed April 16, 2008.