1535-9778/11/$12.00 doi:10.1128/EC.00305-10
Copyright © 2011, American Society for Microbiology. All Rights Reserved.
Conjugated Linoleic Acid Inhibits Hyphal Growth in
Candida albicans
by Modulating Ras1p Cellular Levels and Downregulating
TEC1
Expression
䌤
†
Julie Shareck,
1Andre
´ Nantel,
2,3and Pierre Belhumeur
1*
De´partement de Microbiologie et Immunologie, Universite´ de Montre´al, Montre´al, Que´bec, Canada1; Biotechnology Research Institute,
National Research Council of Canada, Montre´al, Que´bec, Canada2; and Department of Anatomy and Cell Biology,
McGill University, Montre´al, Que´bec, Canada3
Received 6 December 2010/Accepted 20 February 2011
The polymorphic yeastCandida albicansexists in yeast and filamentous forms. Given that the morphogenetic switch coincides with the expression of many virulence factors, the yeast-to-hypha transition constitutes an attractive target for the development of new antifungal agents. Since an untapped therapeutic potential resides in small molecules that hinderC. albicansfilamentation, we characterized the inhibitory effect of conjugated linoleic acid (CLA) on hyphal growth and addressed its mechanism of action. CLA inhibited hyphal growth in a dose-dependent fashion in both liquid and solid hypha-inducing media. The fatty acid blocked germ tube formation without affecting cellular growth rates. Global transcriptional profiling revealed that CLA down-regulated the expression of hypha-specific genes and abrogated the induction of several regulators of hyphal growth, including TEC1, UME6, RFG1, and RAS1. However, neither UME6 nor RFG1 was necessary for CLA-mediated hyphal growth inhibition. Expression analysis showed that the downregulation ofTEC1 expres-sion levels by CLA depended on RAS1. In addition, while RAS1 transcript levels remained constant in CLA-treated cells, its protein levels declined with time. With the use of a strain expressing GFP-Ras1p, CLA treatment was also shown to affect Ras1p localization to the plasma membrane. These findings suggest that CLA inhibits hyphal growth by affecting the cellular localization of Ras1p and blocking the increase inRAS1
mRNA and protein levels. Combined, these effects should prevent the induction of the Ras1p signaling pathway. This study provides the biological and molecular explanations that underlie CLA’s ability to inhibit hyphal growth inC. albicans.
Over the past decades, opportunistic fungal infections have gained importance among hospital-acquired infections due to a growing community of individuals immunocompromised by HIV infection, cancer treatment, or organ transplantation
(74). The opportunistic pathogenCandida albicans, a member
of the normal human microbiota, inhabits the gastrointestinal and genitourinary tracts, mucous membranes, and skin. It is responsible for various forms of diseases, ranging from super-ficial infections of mucosal surfaces to severe, life-threatening systemic infections that largely depend on a host’s physical and physiological conditions.C. albicansis the fourth leading cause of nosocomial infections and the most common fungal species causing bloodstream infections, with associated mortality rates of 38 to 49% (27, 70, 87). Treatment of such infections is complicated by a limited number of antifungal drugs, many of which have adverse side effects, and by emerging resistance to all clinically useful antifungals.
The success of C. albicans as a pathogen stems from its
ability to deploy a full armada of activities that contribute to its virulence, including the production of proteases, adhesins, and
phospholipases as well as its ability to switch morphologically and phenotypically (11, 48). The most studied morphological switch, the yeast-to-hypha transition, is induced by a variety of environmental cues, including elevated temperature, neutral or alkaline pH, nitrogen and/or carbon starvation, and growth in serum (30). A complex network of signaling pathways reg-ulates hyphal growth (4, 12, 85), among which the Ras1p-cyclic AMP (cAMP)-protein kinase A (PKA) and the mitogen-acti-vated protein (MAP) kinase pathways play major roles. Both cascades are controlled by the small GTPase Ras1p (53). Membrane-bound, Ras1p binds the Ras association domain of the adenylate cyclase Cyr1p, thereby stimulating the cyclization of ATP into cAMP (31). Upon binding cAMP, the regulatory subunit of PKA Bcy1p releases the catalytic subunits Tpk1p and Tpk2p, thereby activating PKA (16). The transcription factor Efg1p is a downstream target of PKA (5, 81). Ras1p also impinges on the MAP kinase pathway, downstream of which lies the transcription factor Cph1p (55). Other transcription factors involved in hyphal growth include Tec1p, Flo8p, Cph2p, Ume6p, Rim101p, and Czf1p (1, 13, 14, 22, 50, 51, 76, 88). Hyphal growth is negatively controlled by the general repressor Tup1p in association with the DNA-binding proteins Nrg1p and Rfg1p (8, 10, 42, 59). Activation of these signal transduction cascades modulates the expression of hypha-spe-cific genes, many of which are involved in virulence (4, 12).
Although it has recently been demonstrated that the yeast-to-hypha transition is not always required for infectivity in systemic candidiasis (65), it is generally accepted that hyphal
* Corresponding author. Mailing address: De´partement de Micro-biologie et Immunologie, Pavillon Roger-Gaudry, Universite´ de Mon-tre´al, C.P. 6128, Succ. Centre-ville, Montre´al, Que´bec H3C 3J7, Can-ada. Phone: (514) 343-6273. Fax: (514) 343-5701. E-mail: pierre [email protected].
† Supplemental material for this article may be found at http://ec .asm.org/.
䌤Published ahead of print on 25 February 2011.
565
on September 8, 2020 by guest
http://ec.asm.org/
growth is critical for virulence in various types ofC. albicans
infections. Several lines of evidence link the yeast-to-hypha transition to pathogenicity, the first being that mutants locked in either yeast (cph1/cph1,efg1/efg1, andhgc1/hgc1) or filamen-tous (tup1/tup1andnrg1/nrg1) forms are avirulent in systemic
candidiasis (7, 56, 59, 89). Filamentation is required for C.
albicansto evade phagocytes and escape from blood vessels
(57, 71). Colonization of medical devices by biofilms depends on hyphal development and the expression of hypha-specific
gene products (64). In parallel, using C. albicans strains in
which hyphal growth can be manipulated externally, several groups have shown that inhibiting filamentation is a means by which virulence may be attenuated during systemic candidiasis (15, 75). Moreover, small molecules that block filamentation have been shown to exert a protective effect in mucosal
can-didiasis (36) and to reduce C. albicans-induced damage to
endothelial cells (83). Not only do these findings demonstrate
an association between filamentation and virulence inC.
albi-cans, but they also suggest that the yeast-to-hypha transition
may constitute a therapeutic target.
We recently isolated fatty acids from bovine whey that had
the ability to inhibit germ tube formation inC. albicans (19).
Given that the inability to switch to a hyphal form reduces the
virulence potential ofC. albicans, we characterized the
inhib-itory effect of conjugated linoleic acid (CLA) on hyphal growth and investigated its mechanism of action. We demonstrate that CLA inhibits hyphal development in a dose-dependent fashion in both liquid- and solid-inducing media. Global gene expres-sion analysis reveals that CLA affects the expresexpres-sion of hypha-specific genes and of several morphogenesis regulators,
includ-ingRAS1,TEC1, andUME6. We show that Ras1p is required
for CLA to downregulateTEC1expression levels. We
demon-strate that in the presence of CLA, Ras1p cellular levels de-crease. In addition, CLA causes the delocalization of Ras1p from the plasma membrane. These findings suggest that CLA
inhibits hyphal growth inC. albicansby affecting Ras1p
signal-ing and downregulatsignal-ing the expression of downstream targets,
includingTEC1andUME6.
MATERIALS AND METHODS
Strains and growth conditions.The yeast strains used in this study are listed in Table 1. Strains were streaked out onto YPD plates (1% yeast extract, 2% peptone, 2% dextrose, 2% Bacto agar) and grown at 30°C for 24 to 48 h. In all of the experiments performed, strains were propagated overnight in YPD at 30°C to an optical density at 600 nm (OD600) of⬃12 to 14. Hyphal inductions were performed at 37°C on solid and in liquid media, using Spider (55), Lee’s (54), and buffered alkaline (pH 8.0) M199 (Wisent) media. Media were solidified with 2% Bacto agar (Oxoid). When necessary, media were supplemented with uridine (50 g ml⫺1
). Conjugated linoleic acid (CLA) (Cayman Chemicals) was diluted in ethanol as a 1,000⫻stock and added to media in concentrations ranging from 0 to 250M. Ethanol was used as drug vehicle (final concentration,ⱕ0.5%).
Hyphal growth assays in liquid and on solid media.To quantify the inhibitory effect of CLA onC. albicanshyphal growth,-galactosidase activity was mea-sured using theC. albicansreporter strain ZK3379, in whichlacZis under the control of the hypha-specificHWP1promoter (38). Briefly, cells from an over-night culture were washed in sterile distilled water and diluted to 1⫻106
cells ml⫺1in prewarmed medium. Twenty-four-well polystyrene microplates (Costar 3526; Corning, NY) were seeded with 1 ml of inoculated medium per well. Working solutions of CLA were freshly prepared and added immediately to seeded wells in volumes of 5l, yielding final concentrations ranging from 0 to 50M. Microplates were incubated statically in a water bath set to 37°C for 4 h. -Galactosidase activity was quantified as described previously (47). Data are represented as the means and standard deviations of results from replicate assays performed on three independent days. To assess the effect of CLA on colony morphology,C. albicanscells from an overnight culture were washed in sterile distilled water and spread (ca. 100 colonies per plate) on plates of solidified medium supplemented with ethanol or CLA (100M). Plates were incubated at 37°C for 3 to 4 days and photographed using a Leica MZ FLIII fluorescence stereomicroscope mounted with a Micropublisher camera. To examine the effect of CLA on hyphal growth ofC. albicanswild-type and mutant strains, cells from an overnight culture were washed in sterile distilled water and diluted to a concentration of 1⫻106
cells ml⫺1
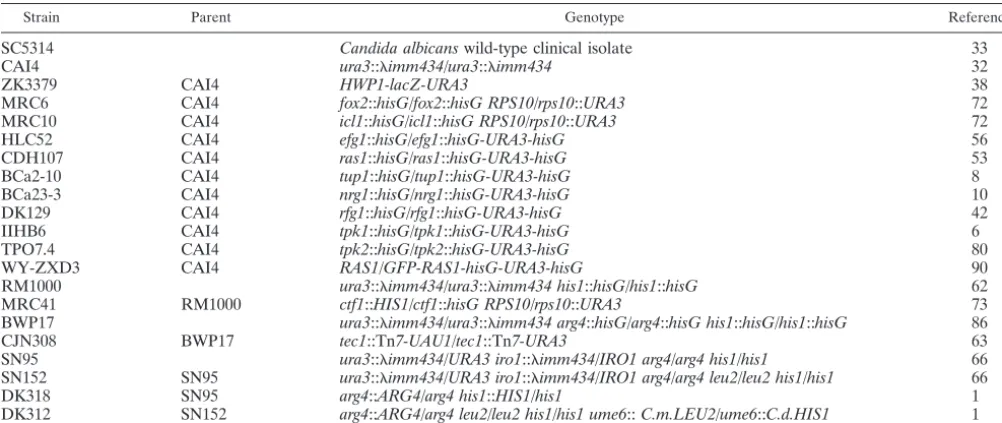
in prewarmed Spider medium supplemented with ethanol or CLA (25M). Flasks were shaken at 150 rpm at 37°C. Aliquots of cells were harvested at various time points, fixed with 3.7% formaldehyde for 30 min at room temperature, washed twice with 1⫻phosphate-buffered saline (PBS), and visualized by differential interference contrast (DIC) microscopy using an upright Nikon microscope with a 100⫻immersion oil objective and a 10⫻projection lens mounted with a Nikon DXM1200F digital camera. To TABLE 1. Candida albicansstrains used in this study
Strain Parent Genotype Reference
SC5314 Candida albicanswild-type clinical isolate 33
CAI4 ura3::imm434/ura3::imm434 32
ZK3379 CAI4 HWP1-lacZ-URA3 38
MRC6 CAI4 fox2::hisG/fox2::hisG RPS10/rps10::URA3 72
MRC10 CAI4 icl1::hisG/icl1::hisG RPS10/rps10::URA3 72
HLC52 CAI4 efg1::hisG/efg1::hisG-URA3-hisG 56
CDH107 CAI4 ras1::hisG/ras1::hisG-URA3-hisG 53
BCa2-10 CAI4 tup1::hisG/tup1::hisG-URA3-hisG 8
BCa23-3 CAI4 nrg1::hisG/nrg1::hisG-URA3-hisG 10
DK129 CAI4 rfg1::hisG/rfg1::hisG-URA3-hisG 42
IIHB6 CAI4 tpk1::hisG/tpk1::hisG-URA3-hisG 6
TPO7.4 CAI4 tpk2::hisG/tpk2::hisG-URA3-hisG 80
WY-ZXD3 CAI4 RAS1/GFP-RAS1-hisG-URA3-hisG 90
RM1000 ura3::imm434/ura3::imm434 his1::hisG/his1::hisG 62
MRC41 RM1000 ctf1::HIS1/ctf1::hisG RPS10/rps10::URA3 73
BWP17 ura3::imm434/ura3::imm434 arg4::hisG/arg4::hisG his1::hisG/his1::hisG 86
CJN308 BWP17 tec1::Tn7-UAU1/tec1::Tn7-URA3 63
SN95 ura3::imm434/URA3 iro1::imm434/IRO1 arg4/arg4 his1/his1 66 SN152 SN95 ura3::imm434/URA3 iro1::imm434/IRO1 arg4/arg4 leu2/leu2 his1/his1 66
DK318 SN95 arg4::ARG4/arg4 his1::HIS1/his1 1
DK312 SN152 arg4::ARG4/arg4 leu2/leu2 his1/his1 ume6::C.m.LEU2/ume6::C.d.HIS1 1
on September 8, 2020 by guest
http://ec.asm.org/
distinguish hyphae from pseudohyphae, fixed cells were washed twice in water, stained for 5 min with 4⬘-6⬘diamidino-2-phenyl-indole (DAPI; 1 mg ml⫺1) di-luted 1:1,000 and calcofluor white (1 mg ml⫺1
) diluted 1:10, examined micro-scopically using epifluorescence, and classified according to the criteria of Sud-bery et al. (82). To ensure that CLA treatment did not compromise cellular growth rates, growth curves were generated. SC5314 cells from an overnight culture were diluted to 1⫻106
cells ml⫺1
in Spider medium supplemented with ethanol or CLA (25M). Flasks were shaken at 150 rpm at 30°C. OD600was measured every hour for 7 h. Data are means and standard deviations of results from duplicate biological samples. The effect of CLA (250M) on cellular growth rates in YPD at 30°C was assessed similarly.
Gene expression profiling.SC5314 cells grown overnight in YPD at 30°C were washed in sterile distilled water and diluted to 5⫻106
cells ml⫺1
(OD600of 0.1) in Spider medium supplemented with ethanol or CLA (100M). Cultures were shaken at 150 rpm at either 30°C or 37°C for 90 min. Cells were collected by vacuum filtration on 0.45-m membrane filters (MF-Millipore membrane filters) and frozen in an ethanol bath at⫺80°C. Total RNA was isolated from quadru-plicate independent biological samples using an RNeasy minikit (Qiagen). Briefly, frozen cells were thawed out in RNeasy buffer RLT at a ratio of 3:1 (vol/vol) buffer/pellet. Resuspended cells were divided into 1-ml aliquots in 2-ml screw-cap microcentrifuge tubes containing 0.6 ml of 0.5-mm-diameter acid-washed glass beads. Samples were homogenized 6 times, for 5 min each, in a BeadBeater set at maximum speed. Lysates were kept on ice between each cycle. Total RNA was extracted from homogenized samples according to the Qiagen RNeasy protocol. For the two-color microarray experiments, RNA from cells grown at 37°C or in the presence of CLA at 30°C or 37°C was compared to RNA from cells grown at 30°C. Four biological replicates were used in each experi-ment, which included two Cy3/Cy5 and two Cy5/Cy3 comparisons. cDNA label-ing, microarray hybridization, washlabel-ing, scannlabel-ing, and statistical analysis methods were essentially performed as described previously (77). In each comparison, genes with statistically significant modulations were identified in volcano plots using a 2.0-fold cutoff point and a Welshttest with a false-discovery rate of less than 5%.
Northern blot analysis.Cells were grown as described above for gene expres-sion profiling. RNA was prepared using the hot-phenol method. Fifteen micro-grams of total RNA was separated on 1.2% agarose-7.5% formaldehyde dena-turing gels and transferred by capillary action to Hybond-N⫹nylon membranes (GE Healthcare Life Sciences). Probes were generated by PCR amplification of genomic DNA and purified using an Illustra GFX PCR DNA and gel band purification kit (GE Healthcare Life Sciences). The sequences of the primers used to generate all probes are listed in Table 2. Fifty nanograms of probe was labeled by random priming using Ready-To-Go DNA labeling beads (GE Healthcare Life Sciences) and [␣-32
P]dCTP. Unincorporated nucleotides were removed using Sephadex G-50 columns. Blots were hybridized overnight and washed at 65°C according to the method of Church and Gilbert (18), scanned using a Molecular Dynamics Typhoon phosphorimager, and quantified with ImageQuant software (version 5.0; Molecular Dynamics). Data are means and standard deviations of results from duplicate biological samples.
qPCR analysis ofC. albicanstranscripts.For quantitative PCR (qPCR) anal-ysis,C. albicanscells from an overnight culture were diluted to 1⫻106cells ml⫺1 in Spider medium supplemented with ethanol or CLA (25M) and grown at 37°C. Cells were collected at various time points (0, 30, 60, and 90 min) by vacuum filtration on 0.45-m membrane filters (MF-Millipore membrane filters)
and frozen in an ethanol bath at⫺80°C. Total RNA was isolated from duplicate independent biological samples for each condition and time point using the hot-phenol method. RNA was resuspended in 50 to 200l diethyl pyrocarbon-ate-treated water, quantified by a spectrophotometer (NanoDrop 2000; Thermo Scientific), and stored at⫺80°C. RNA samples were DNase digested (rDNase I; Ambion) and used as templates in qPCR amplification reactions to certify them as DNA free. The lack of a PCR product indicated that samples were not contaminated with genomic DNA. Five hundred nanograms of total RNA was reverse transcribed using SuperScript II reverse transcriptase (Invitrogen) ac-cording to the manufacturer’s instructions. Two cDNAs were synthesized for each biological replicate. Quantitative PCR was carried out on a Rotor-Gene 6000 (Corbett Life Science). The primers were designed with PrimerQuest (Inte-grated DNA Technologies) and are listed in Table 2. The qPCR mixtures contained 12.5l FastStart SYBR green master mix (Roche Applied Science), 8.5l Milli-Q water, 200 nM each primer, and 1l cDNA product diluted 1:100, and the qPCRs were performed in duplicates. Generally, the difference between two threshold cycle (CT) values for the same sample was⬍0.5. Relative expression levels were calculated
using the delta-deltaCTmethod [2(CTfor target condition⫺CTforACT1condition)⫺
(CTfor target at time zero⫺CTforACT1at time zero)], in which the condition was either ethanol or CLA treatment andACT1was the housekeeping gene.
Protein extraction and immunoblotting.Wild-type and tagged strains were grown in Spider medium and harvested by following the same procedure as that described above for gene expression profiling. Total protein extracts were pre-pared using radioimmunoprecipitation assay (RIPA) buffer (25 mM Tris-HCl [pH 7.5], 150 mM NaCl, 1% NP-40, 1% Na-deoxycholate [DOC], 0.1% SDS) containing 1 mM phenylmethylsulfonyl fluoride and protease inhibitors (Com-plete EDTA-free tablets [Roche Applied Science]). Total extracts (50g) were resolved by SDS-PAGE (7.5%) and transferred to Hybond enhanced chemilu-minescence (ECL) nitrocellulose membranes (GE Healthcare Life Sciences). To detect green fluorescent protein (GFP)-Ras1p, mouse anti-GFP antibodies (Roche Applied Science) (1:1,000 in Tris-buffered saline–Tween [TBS-T]–5% nonfat milk) were used. Gsp1p protein levels, shown as a loading control, were detected using rabbit anti-Gsp1p antibodies (3) (1:10,000 in TBS-T–5% nonfat milk) overnight at 4°C. Signals were detected using Lumi-Light Western blotting substrate (Roche Applied Science).
Microarray data accession number.Microarray data sets can be found at the Gene Expression Omnibus website (http://www.ncbi.nlm.nih.gov/geo/) under ac-cession number GSE25822.
RESULTS
CLA inhibits hyphal growth in C. albicans in response to various hypha-inducing conditions.Several fatty acids, includ-ing conjugated linoleic acid (CLA), were recently shown to
inhibit Candida albicansgerm tube formation in various
hy-pha-inducing liquid media (19). We first assessed the inhibitory effect of CLA on hypha formation induced in different
condi-tions using the C. albicans reporter strain HWP1p-lacZ, in
which-galactosidase activity reflects the amount of hyphal
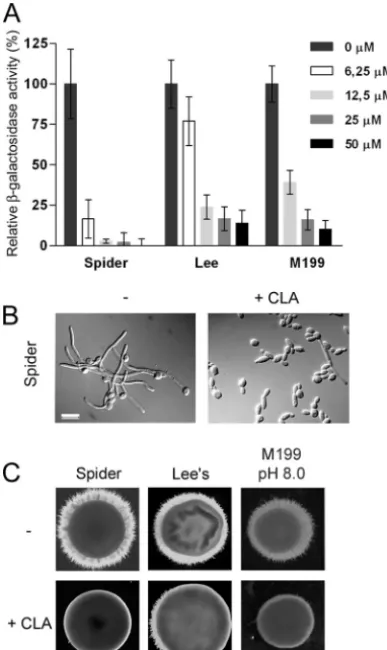
growth in cultures (38). In Spider, Lee’s, and M199 (pH 8.0) media, CLA inhibited hyphal growth in a dose-dependent fash-ion, albeit to various extents (Fig. 1A). In all media, 50M of
the fatty acid reduced -galactosidase activity by more than
80% compared to the level for ethanol-containing cultures, confirming that the presence of CLA impeded filamentation.
In Spider medium supplemented with 25M CLA, cells grew
as yeasts and short pseudohyphae, reflecting reduced
-galac-tosidase activity levels (Fig. 1A and B). CLA also disrupted filamentation on solid media, being more effective in Spider medium (Fig. 1C). However, hyphal growth inhibition by CLA was medium dependent. For instance, in RPMI 1640 and YPD-10% fetal bovine serum (FBS) liquid media, CLA inhib-ited filamentation, but effective concentrations tended to be higher (19; data not shown). In addition, CLA had no effect on hyphal growth induced on solid YPD-10% FBS, synthetic low-ammonia dextrase (SLAD), or yeast nitrogen base (YNB)
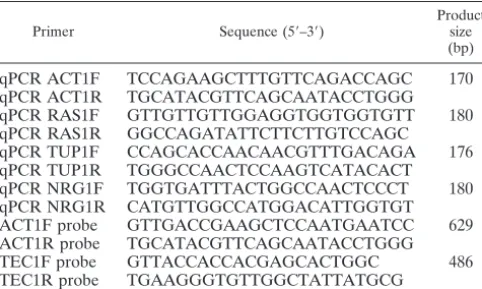
sup-TABLE 2. Primers used in this study
Primer Sequence (5⬘–3⬘)
Product size (bp)
qPCR ACT1F TCCAGAAGCTTTGTTCAGACCAGC 170 qPCR ACT1R TGCATACGTTCAGCAATACCTGGG qPCR RAS1F GTTGTTGTTGGAGGTGGTGGTGTT 180 qPCR RAS1R GGCCAGATATTCTTCTTGTCCAGC qPCR TUP1F CCAGCACCAACAACGTTTGACAGA 176 qPCR TUP1R TGGGCCAACTCCAAGTCATACACT qPCR NRG1F TGGTGATTTACTGGCCAACTCCCT 180 qPCR NRG1R CATGTTGGCCATGGACATTGGTGT ACT1F probe GTTGACCGAAGCTCCAATGAATCC 629 ACT1R probe TGCATACGTTCAGCAATACCTGGG
TEC1F probe GTTACCACCACGAGCACTGGC 486
TEC1R probe TGAAGGGTGTTGGCTATTATGCG
on September 8, 2020 by guest
http://ec.asm.org/
plemented with N-acetylglucosamine or upon embedding of cells in yeast extract-peptone (YP) medium (data not shown). Other fatty acids, such as oleic, linoleic, and ␣- and ␥
-lin-olenic acids also modulated hyphal growth inC. albicans.
Lev-els of-galactosidase activity, as well as cellular and colony
morphology, indicated that all fatty acids, like CLA, interfered
to different extents with C. albicans hyphal growth induced
under various conditions (data not shown). In addition, fatty
acids, including CLA, inhibited filamentation inCandida
tropi-calis and C. dubliniensis (data not shown), in Aspergillus
fu-migatus, and inFusarium graminearum (20; data not shown),
suggesting the response to fatty acids and to CLA may be conserved among other fungi.
CLA impedes germ tube formation without affecting cellular growth.With the use of theHWP1p-lacZ strain and -galac-tosidase quantification, CLA and other fatty acids were shown
to abrogate, delay, or decrease the induction of HWP1
pro-moter activity, indirectly suggesting that hyphal growth was impaired (Fig. 1A) (19). To assess which step of the yeast-to-hypha transition was affected by CLA, we examined the mor-phology of cells induced to filament in Spider medium in the absence or presence of CLA. Untreated cells showed long germ tubes and/or very short filaments and long hyphae at the 1- and 3-h time points, respectively. At the same time points, most CLA-treated cells appeared as elongated yeasts or showed elongating buds that resembled germ tubes (Fig. 2A). With the use of the criteria established by Sudbery et al. (82), cells were stained with DAPI and calcofluor white and classi-fied as yeast, pseudohyphae, or germ tubes/hyphae. As seen in Fig. 2B, 80 to 90% of untreated cells formed hyphae and pseudohyphae over the 3-h time course. In contrast, the ma-jority (70 to 80%) of cells grown in the presence of CLA remained in the yeast form. While some CLA-treated cells did initiate germ tube formation, elongating filaments were not detected by the 3-h time point, indicating that these cells had resumed pseudohyphal and yeast growth modes. These find-ings suggest that CLA prevents germ tube formation and hy-phal elongation from occurring. CLA also blocked hyhy-phal elongation in cells that were already engaged in the hyphal growth program (data not shown).
C. albicans filamentation can be inhibited by cytotoxic or
cytostatic molecules (83). Since CLA interfered with hyphal growth, we assessed whether cellular growth rates at 30°C in Spider medium were affected by ethanol or CLA. Under these conditions, germ tube formation is slightly induced at early time points (Fig. 3A), but hyphal growth is not maintained and cells eventually resume budding growth (data not shown). The growth rates of untreated and CLA-treated cells were identi-cal, suggesting that CLA does not inhibit hyphal growth by exerting cytotoxic or cytostatic effects (Fig. 2C). Similar results were obtained for yeast cells grown in the absence or presence of CLA in YPD medium (data not shown).
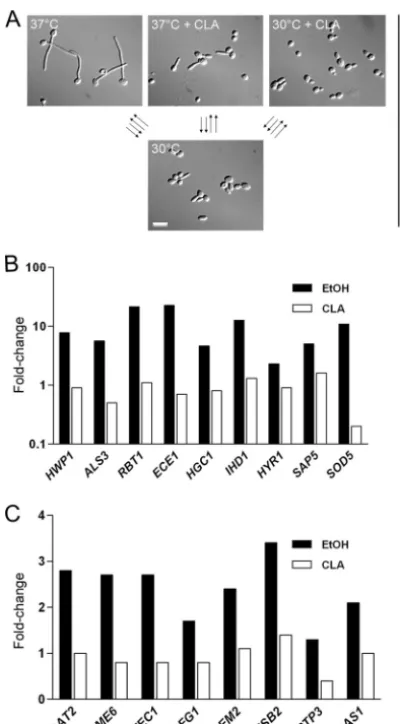
Gene expression analysis. To gain further insight into the inhibitory effect of CLA on hyphal growth, we performed global gene expression profiling of cells grown in Spider me-dium in the absence or presence of CLA for 90 min. Tran-scriptional profiles of untreated cells at 37°C and CLA-treated cells at 37°C and 30°C were obtained by independently com-paring the levels for each experimental condition, i.e., 37°C, 37°C with CLA, and 30°C with CLA, to those for the control condition, growth at 30°C. Each experiment was performed in quadruplicate: RNA was prepared from four independent bi-ological replicates and used to perform four independent hy-bridizations (Fig. 3A). Only genes that were modulated 2-fold
up or down with aPvalue of⬍0.05 were deemed significantly
differentially expressed. Data presented in Tables S1, S2, and S3 in the supplemental material show the transcriptional pro-files of each experimental condition compared to the control condition. The transcriptional profiles of the experimental con-ditions were then compared to one another, i.e., 37°C versus 37°C with CLA and 30°C with CLA versus 37°C with CLA, resulting in two other transcriptional profiles (Tables S4 and S5) and the scatter plots in Fig. S1A. All significantly differ-entially expressed genes originating from the five transcrip-tional profiles generated were organized by hierarchical cluster-ing, yielding a global transcriptional profile of 714 modulated
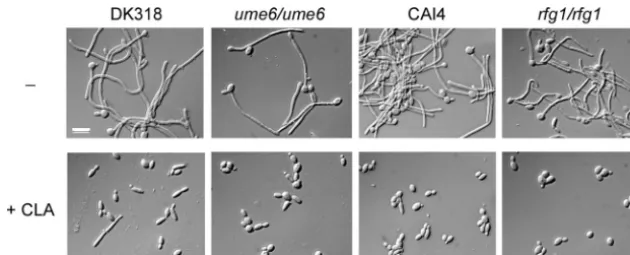
FIG. 1. Conjugated linoleic acid (CLA) inhibits hyphal growth in
Candida albicans. (A) The effect of CLA onC. albicanshyphal growth was measured by using theC. albicansreporter strain ZK3379. Cells were induced to filament in Spider, Lee’s, and M199 (pH 8.0) media supplemented with CLA (0 to 50M) for 4 h at 37°C.-Galactosidase activity in CLA-treated cultures was measured and normalized to that of untreated cultures, in which -galactosidase activity was set as 100%. Data are means and standard deviations of results from dupli-cate assays performed on three independent days. (B) Aliquots of cells grown in Spider medium in the absence or presence of 25M CLA for 4 h at 37°C were harvested and visualized at⫻100 magnification using DIC optics. Bar⫽ 10 m. (C) Filamentous growth of C. albicans
SC5314 was induced on solid media supplemented with ethanol or 100
M CLA. Plates were incubated at 37°C for 3 to 4 days.
on September 8, 2020 by guest
http://ec.asm.org/
transcripts (Table S6 and Fig. S1B). The hierarchical clustering revealed that 61 genes were downregulated under all three ex-perimental conditions (Fig. S1B). Gene Ontology (GO) term analysis revealed these genes were involved in RNA metabolic processes, ribosome biogenesis, translation, and transcription, re-flecting a repression of the translational machinery. These find-ings suggest that experimental growth conditions, i.e., 37°C and CLA treatment, are less favorable than control growth conditions, i.e., 30°C, and result in a metabolic decrease (61).
We first chose to investigate the transcriptional profile of cells grown in Spider medium at 37°C. Gene expression anal-ysis showed that 520 genes were modulated upon growth at 37°C (see Table S1 in the supplemental material). Of those genes, 198 were upregulated while 322 were downregulated.
Interestingly,⬃30% of the upregulated genes have been
de-scribed as being induced during the yeast-to-hypha transition in Lee’s medium (34) (Table S1). Hypha-specific genes such as
ECE1, RBT1, IHD1, SOD5, HWP1, ALS3, and HGC1 were
highly induced (34, 61, 89). Genes involved in signal
transduc-tion, including the GTPase geneRAS1, the adenylate cyclase
geneCYR1, the mucin-like signaling protein geneMSB2, and
the Rho1p GTPase-activating protein (GAP) gene BEM2,
were also upregulated (Tables 3 and S1). In addition, several transcription factors known to be involved in hyphal growth
were among the 198 upregulated genes and included CPH1,
CPH2,TEC1,BCR1, andUME6(Table 3). These transcription
factors are components of the MAP kinase, the Ras1p-cAMP-PKA, and the Tup1p-Nrg1p signaling pathways (1, 43, 50, 51,
55, 63, 88), exceptCPH2, which appears to function
indepen-dently of known signaling cascades (51). Other upregulated genes encoded transcription factors Gat2p and Cas4p (34), while orf19.6705 encodes a nucleotide exchange factor. Taken
together, the transcriptional profile of cells grown at 37°C suggests that several signaling pathways participate in orches-trating the hyphal growth program in Spider medium.
Next, we examined the responses of cells to CLA at 30°C and 37°C. We had designed the microarray experiments to be able to distinguish between the transcriptional changes associated with morphological differences induced by growth at 37°C and those elicited specifically by the fatty acid. However, cultures of
C. albicansgrown in Spider medium at 30°C still contained a
significant number of pseudohyphal cells (Fig. 3A), making it impossible to fully eliminate morphogenesis as a variable. Thus, transcriptional profiles of CLA’s effects at both temper-atures turned out to be highly similar, as seen in the scatter plot (see Fig. S1A in the supplemental material). Indeed, when the transcriptional profiles of CLA-treated cells at 37°C and those at 30°C were directly compared, only 33 genes were found to be differentially modulated (see Table S5 in the supplemental material), and many of these have previously been shown to be temperature regulated (28). We thus focused our functional analysis on the transcriptional profile of cells exposed to CLA at 37°C compared to that of cells grown at 30°C. CLA treat-ment resulted in the modulation of 296 transcripts (Table S2). One hundred fifty-five genes were upregulated while 141 were downregulated. GO-term analysis showed that upregulated genes belong to the categories “unknown biological function” (31%), “response to chemical stimulus” (17.4%), “carbohy-drate metabolic processes” (16.8%), and “lipid metabolic pro-cesses” (16.1%). Fatty acids are nonfermentable carbon sources which are converted to acetyl-coenzyme A
(acetyl-CoA) by-oxidation. Acetyl-CoA drives the glyoxylate cycle,
yielding oxaloacetate, which is converted to glucose via
gluco-neogenesis. Transcript levels of hallmark genes of the
-oxi-FIG. 2. CLA impedes germ tube formation ofCandida albicanswithout affecting cellular growth. (A)C. albicansSC5314 cells were induced to filament in Spider medium at 37°C in the absence or presence of 25M CLA. Aliquots of cells were visualized as described for Fig. 1B. Bar⫽ 10m. (B) Quantification of yeast, pseudohyphae, germ tubes (GT) and hyphae inC. albicanscultures shown in panel A.nwas⬎150 for each condition and time point. (C) Yeast cells were grown as described for panel A at 30°C. OD600was measured at various time points. Data are means and standard deviations of results from duplicate biological samples.
on September 8, 2020 by guest
http://ec.asm.org/
dation (FAA21, POX1, PXP2, POX1-3, ECI1, POT1, FOX2,
FOX3,PEX5,CAT2, andANT1), glyoxylate (ICL1,MLS1, and
MDH1-3), and gluconeogenesis (FBP1) pathways increased in
the presence of CLA, which may reflect a flow of carbon from fatty acids to acetyl-CoA to glucose. Most of these genes have
been described as being induced upon internalization of C.
albicans by macrophages (57) or by oleic acid (73). Genes
encoding glycolytic enzymes, including PGK1, PGI1, and
FBA1, were also upregulated in the presence of CLA, which
may suggest that both glycolysis and gluconeogenesis are oc-curring simultaneously. In addition, a group of genes involved
in transport (15.5%), includingTPO4,PDR16,CDR11,CDR4,
RTA3, andFLU1, were upregulated in the presence of CLA.
These genes encode transmembrane transporters which play roles in phospholipid, fatty acid, or drug transmembrane trans-port.
To address the mechanism of action of CLA, we compared the transcriptional profiles of cells grown in the absence or presence of CLA at 37°C. Gene expression analysis revealed that 150 genes were significantly differentially expressed (see Table S4 in the supplemental material). To facilitate data min-ing, fold change ratios were generated by normalizing data obtained for CLA-treated cells to that obtained for untreated
cells, resulting in 72 and 78 genes with upregulated (⬎2-fold)
and downregulated (⬍0.5-fold) fold change ratios, respectively
(Table S4). GO-term analysis revealed that the subset of 72 CLA-upregulated genes was enriched in genes implicated in “lipid metabolic processes” (27.4%) and “transport” (15.1%). Most of the genes involved in transmembrane transport, fatty
acid-oxidation and peroxisome biogenesis, the glyoxylate
cy-cle, and gluconeogenesis were among the genes induced in CLA-treated cells (Table S2) discussed in the previous section. Because cells may be metabolizing CLA and converting it to glucose, we examined whether the CLA-mediated inhibition of hyphal growth was linked to fatty acid metabolism. To do so,
we analyzed the effect of CLA on filamentation of thefox2/
fox2,icl1/icl1, andctf1/ctf1mutant strains, which filament
nor-mally but cannot assimilate fatty acids (72, 73). CLA inhibited hyphal growth in all three strains, suggesting that fatty acid metabolism is not involved in the inhibition of filamentation (data not shown).
Given that lipid metabolism was not impeding hyphal growth, we focused on the subset of 78 CLA-downregulated genes (see Table S4 in the supplemental material). GO-term
FIG. 3. Expression levels of selected differentially expressed genes. (A) Transcriptional profiles of untreated cells at 37°C and CLA-treated cells at 37°C and 30°C were obtained by independently comparing the levels for each experimental condition, i.e., 37°C, 37°C with CLA, and 30°C with CLA, to those for the control condition, growth at 30°C. Four biological replicates were used in each experiment, which included two Cy3/Cy5 and two Cy5/Cy3 comparisons. Representative micrographs of cells used in the microarray experiments are shown. Bar⫽10m. Fold change values are shown for hypha-specific genes (B) and genes involved in signal transduction (C) in untreated and CLA-treated cells at 37°C. The significantly differentially expressed genes were obtained by comparing the transcriptional profile of cells at 37°C with that of CLA-treated cells at 37°C and are listed in Table S4 in the supplemental material. Data are fold change values. EtOH, ethanol.
TABLE 3. Selected genes upregulated during the yeast-to-hypha transition in Spider medium
Systematic name Gene name Function Fold change
orf19.1187 CPH2 Transcriptional activator of hyphal growth 3.0
orf19.6705 Putative guanyl nucleotide exchange factor with Sec7p domain 2.9
orf19.4056 GAT2 Putative DNA-binding transcription factor 2.8
orf19.5908 TEC1 TEA/ATTS transcription factor involved in regulation of hypha-specific genes 2.7 orf19.1822 UME6 Transcription factor; required for wild-type hyphal extension 2.7 orf19.1693 CAS4 Protein of RAM cell wall integrity signaling network; role in cell separation;
required for hyphal growth
2.5
orf19.723 BCR1 Transcription factor required for wild-type biofilm formation 2.3 orf19.4433 CPH1 Transcription factor required for mating and hyphal growth on solid media 2.1
orf19.5148 CYR1 Adenylate cyclase 2.0
orf19.1760 RAS1 RAS signal transduction GTPase; regulates cAMP and MAP kinase pathways 2.1
orf19.1490 MSB2 Mucin family member, possible sensor of cell wall damage 3.4
orf19.6573 BEM2 Putative Rho1p GTPase-activating protein (GAP) 2.4
on September 8, 2020 by guest
http://ec.asm.org/
analysis showed that genes involved in “filamentous growth” (20.8%) and “pathogenesis” (16.9%) were among the subset of CLA-downregulated genes. Indeed, the expression levels of
hypha-specific genes, including HWP1, ALS3, RBT1, ECE1,
HGC1,IHD1,HYR1,SAP5, andSOD5, were greatly reduced
in CLA-treated cells compared to the levels for untreated cells (Fig. 3B and Table S4). CLA also blocked the induction of
transcription factors involved in hyphal growth, such asGAT2,
UME6,TEC1, andRFG1(Fig. 3C). A smaller (5.2%) yet more
interesting category of CLA-downregulated transcripts was
en-riched in genes involved in signal transduction, such asRAS1,
BEM2, MSB2, andPTP3(Fig. 3C). As seen in Table 3,
tran-script levels of these genes increased during the yeast-to-hypha
transition, except forPTP3(Table S4). CLA either prevented
the induction or lowered the induction levels ofRAS1,BEM2,
and MSB2. As for PTP3, which encodes a protein tyrosine
phosphatase, its transcript levels were repressed in CLA-treated cells (Fig. 3C and Table S4). Taken together, the tran-scriptional data suggest that CLA negatively affects the expres-sion of hypha-specific genes as well as genes known to regulate the yeast-to-hypha transition.
UME6andRFG1are not required for CLA-mediated inhi-bition of hyphal growth. Gene expression analysis revealed that CLA reduced the expression levels of genes encoding
regulators of hyphal growth, includingTEC1, UME6, RFG1,
and RAS1(Fig. 3C). To determine whether these regulators
were required for CLA’s effect on hypha formation, we
exam-ined the responses of the ume6/ume6 and rfg1/rfg1 mutant
strains to CLA when these strains were induced to filament in Spider medium at 37°C. As seen in Fig. 4, CLA inhibited hyphal growth in all parental strains. Interestingly, CLA
inhib-ited filamentation independently ofUME6andRFG1,
indicat-ing that neither gene is required for CLA’s inhibitory effect on
hyphal growth (Fig. 4). The ras1/ras1 and tec1/tec1 mutants
could not be analyzed in a similar fashion, since these strains failed to filament in Spider medium as previously reported (our observations and references 39, 53, and 90).
CLA downregulatesTEC1expression in a Ras1p-dependent manner.Based on the previous screen, morphogenesis regu-lators potentially mediating CLA’s effect on hyphal growth were narrowed down to Ras1p and Tec1p, since both were required for filamentation in Spider medium (data not shown). In its active GTP-bound form, Ras1p activates the adenylate
cyclase Cyr1p, stimulating the cyclization of ATP to cAMP (31). Upon binding cAMP, Bcy1p, the regulatory subunit of PKA, releases the functionally redundant catalytic subunits Tpk1p and Tpk2p, thereby enabling their activity (16). The transcription factor Efg1p, an important regulator of hyphal growth, is a downstream target of PKA (5). In addition, Efg1p
also regulatesTEC1expression (50). Thus, Tec1p constitutes a
downstream target of the Ras1p-cAMP-PKA pathway.
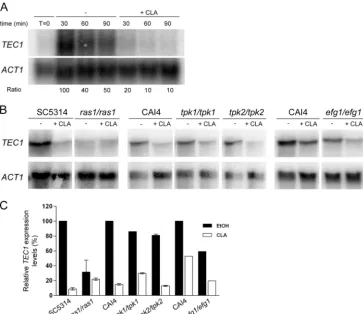
Gene expression analysis showed that CLA reducedTEC1
expression levels (Fig. 3C). Given thatTEC1is induced upon
the yeast-to-hypha transition, we examined how CLA affected
the kinetics of expression of TEC1. We performed a time
course analysis of TEC1 transcript levels in cells grown in
Spider medium in the absence or presence of CLA. As
ex-pected,TEC1expression was induced in untreated cells during
the yeast-to-hypha transition (Fig. 5A). In contrast, TEC1
mRNA levels were downregulated by an average of 5-fold in CLA-treated cells compared to the level for untreated cells, thus confirming transcriptional profiling results. Similar trends were also observed with the use of quantitative PCR analysis (data not shown). Furthermore, Tec1p protein levels were reduced in the presence of CLA, thus following the same
expression pattern as theTEC1transcript (data not shown).
A possible role for the Ras1p-cAMP-PKA signaling pathway
in mediating CLA’s effect onTEC1expression was then
inves-tigated. Northern blot analysis revealed that in Spider medium,
TEC1induction was mostly Ras1p dependent (Fig. 5B and C).
Interestingly, the effect of CLA onTEC1expression was
re-duced in the absence ofRAS1. In the parental strain,TEC1
transcript levels decreased⬃10-fold in CLA-treated cells
com-pared to the level for untreated cells, while in the ras1/ras1
mutant strain, the downregulation reached only 1.5-fold (Fig.
5C). On the other hand, TEC1induction in Spider medium
and its downregulation by CLA did not depend on the
pres-ence of eitherTPK1 orTPK2 (Fig. 5B and C). These results
may be explained by the functional redundancy of the two PKA
isoforms (6). Since Efg1p is a regulator ofTEC1expression, we
examined its role in mediating CLA’s effect onTEC1mRNA
levels. Northern analysis revealed thatTEC1induction in
Spi-der medium depended partially onEFG1, asTEC1transcript
levels were 1.7-fold lower in theefg1/efg1mutant strain than in
the parental strain (Fig. 5B and C). However,EFG1was not
required for CLA’s repressive effect onTEC1, as the
magni-FIG. 4.UME6andRFG1are not required for CLA-mediated hyphal growth inhibition. The DK318, CAI4,ume6/ume6(DK312), andrfg1/rfg1
(DK129) strains were grown in Spider medium at 37°C in the absence or presence of 25M CLA for 4 h. Cells were visualized as described for Fig. 1B. Bar⫽10m.
on September 8, 2020 by guest
http://ec.asm.org/
tudes ofTEC1downregulation by CLA (⬃2-fold) were similar in parental and mutant strains (Fig. 5C). Additionally, it should
be noted that CLA did not modulateEFG1mRNA and
pro-tein levels (data not shown). Taken together, these results
implicateRAS1, but notTPK1,TPK2, orEFG1, in mediating
CLA’s repressive effect onTEC1expression.
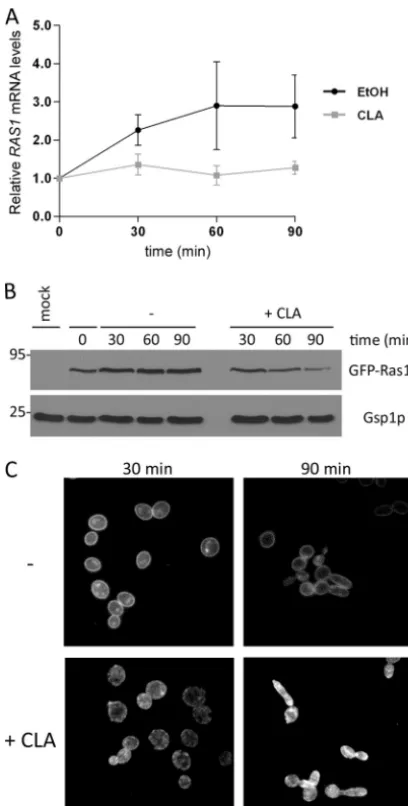
CLA reduces GFP-Ras1p protein levels and affects its local-ization.Transcriptional profiling showed thatRAS1expression was upregulated 2.1-fold during the yeast-to-hypha transition but that it was not induced in CLA-treated cells (Fig. 3C). We
examined CLA’s effect onRAS1transcription at earlier time
points by performing a time course analysis ofRAS1mRNA
levels in cells grown in Spider medium in the absence or
pres-ence of CLA. Quantitative PCR analysis revealed thatRAS1
transcript levels increased in untreated cells by an average of 2.7-fold, confirming results obtained by gene expression anal-ysis (Fig. 6A). On the other hand, CLA completely abrogated
RAS1induction, as its mRNA levels remained relatively
un-changed compared to levels at the zero time point (Fig. 6A). We next investigated CLA’s effect on Ras1p protein levels and localization using the WY-ZXD3 strain expressing a
GFP-Ras1 fusion protein previously developed for similar analyses (90). We monitored GFP-Ras1p cellular levels in cells induced to filament in Spider medium in the absence or presence of CLA. In untreated cells, GFP-Ras1p levels increased gradu-ally, as did its mRNA levels (Fig. 6B). Unexpectedly, in CLA-treated cells, GFP-Ras1p levels declined with time, as seen at the 90-min time point (Fig. 6B). Thus, GFP-Ras1p did not follow the same pattern as its transcript, which remained con-stant (Fig. 6A). Taken together, these results suggest that CLA treatment reduces the steady-state levels of GFP-Ras1p.
We then examined GFP-Ras1p localization in untreated and CLA-treated cells. To facilitate comparisons, we examined GFP-Ras1p in yeast cells grown in Spider medium in the ab-sence or preab-sence of CLA at 30°C. Under such conditions, the GFP-Ras1p expression patterns were identical to those at 37°C, arguing that CLA’s effect on GFP-Ras1p levels was not temperature dependent (data not shown). As seen in Fig. 6C (top panel), untreated cells demonstrated a strong fluorescent signal at the plasma membrane, confirming previous observa-tions (90). Additionally, GFP-Ras1p could be seen in punctate patches within cells, especially at the 30-min time point. In
FIG. 5.TEC1 downregulation by CLA is Ras1p dependent. (A) Quantitative Northern blot analysis was used to examine the kinetics of expression ofTEC1in SC5314 cells grown in Spider medium at 37°C in the absence or presence of 100M CLA.TEC1transcript levels were quantified and normalized to those for theACT1loading control. Ratios were obtained by normalizingTEC1transcript levels to those for untreated cells obtained at the 30-min time point, which were set as 100%. (B)TEC1expression levels in the parental,ras1/ras1(CDH107),
tpk1/tpk1(IIHB6),tpk2/tpk2(TPO7.4), andefg1/efg1(HLC52) strains grown as described for panel A for 90 min.TEC1transcript levels were quantified and normalized to those for the ACT1loading control. (C) Data presented are the relativeTEC1 expression levels obtained by normalizingTEC1transcript levels to those for parental untreated cells, which were set as 100%. Data are means and standard deviations of results from two independent hybridizations performed on duplicate biological samples. A single hybridization was performed using RNA isolated from the CAI4 andefg1/efg1strains.
on September 8, 2020 by guest
http://ec.asm.org/
contrast, GFP-Ras1p could barely be detected at the plasma membrane in CLA-treated cells. Instead, the fluorescent signal appeared diffuse throughout the cytoplasm or concentrated in patches within cells (Fig. 6C). Moreover, the “patch” pheno-type was maintained, becoming more obvious at later time points (data not shown). These findings indicate that CLA
causes the delocalization of GFP-Ras1p from the plasma mem-brane.
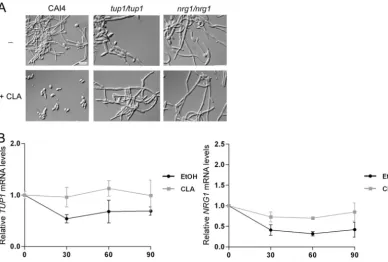
CLA affects the Tup1p-Nrg1p signaling pathway.It has been established that the MAP kinase, Ras1p-cAMP-PKA, and Tup1p-Nrg1p signaling pathways make independent contribu-tions to filamentation (9). The hyphal growth repressor Tup1p functions with the DNA-binding proteins Nrg1p and Rfg1p to negatively regulate hyphal growth and hyphal gene expression (8, 10, 42, 46, 59). Given that Tup1p and Nrg1p are involved in mediating the inhibitory effect of farnesol on filamentation (45), their role in the CLA-mediated hyphal growth inhibition
was then investigated. We examined the responses of thetup1/
tup1and nrg1/nrg1mutant strains to CLA when these strains
were induced to filament in Spider medium at 37°C. While CLA inhibited hyphal growth in the parental strain CAI4, the
tup1/tup1andnrg1/nrg1mutant strains remained filamentous,
even when higher CLA concentrations were used (Fig. 7A). This indicates that CLA, like farnesol, inhibits filamentation by affecting a pathway requiring Tup1p and Nrg1p.
TUP1andNRG1are modulated at the transcriptional level
upon the yeast-to-hypha transition (10, 45). According to
tran-scriptional profiling,TUP1 and NRG1were not significantly
differentially expressed in response to CLA, but this could be due to their low expression levels. Thus, we assessed how CLA
affected the kinetics of expression ofTUP1andNRG1.
Quan-titative PCR revealed thatTUP1 andNRG1transcript levels
decreased⬃2-fold during the 90-min time course in untreated
cells (Fig. 7B). In contrast, CLA prevented the downregulation
of both repressors, asTUP1andNRG1mRNA levels remained
unchanged compared to initial levels. These findings suggest that CLA may inhibit hyphal growth by preventing the relief of repression exerted by the Tup1p-Nrg1p pathway.
DISCUSSION
While efforts have been put forth to elucidate the molecular
mechanisms underlying the yeast-to-hypha transition in
Can-dida albicans, small molecules affecting the morphogenetic
switch have been identified in concurrent studies. Our findings have enabled us to add CLA to the growing list of molecules that modulate hyphal growth, which includes farnesol, dode-canol, fatty acids and lipid metabolites, rapamycin, and geldanamycin as well as histone deacetylase inhibitors (2, 19, 23, 37, 40, 45, 60, 68, 79). CLA was effective at inhibiting hyphal growth in most hypha-inducing media (Fig. 1). How-ever, its inhibitory activity was significantly reduced in media
containing FBS or N-acetylglucosamine, in RPMI 1640, or
upon embedding of cells in YP medium (data not shown). The medium-dependent inhibitory effect of CLA on hyphal growth may be due to the nature or robustness of hypha-inducing signals, to the enhanced growth capacity of nutritionally rich media (61, 83), to the nonspecific lipid-binding capacity of serum albumin in FBS (52), or to the poor solubility of CLA in aqueous media (73).
Is CLA directly inhibiting filamentation or is this effect me-diated by one of its metabolites? Fatty acids are
nonferment-able carbon sources metabolized byC. albicansto acetyl-CoA
and to glucose via-oxidation, the glyoxylate cycle, and
glu-coneogenesis (57). Hallmark genes of these three biochemical pathways were upregulated in CLA-treated cells (see Tables
FIG. 6. CLA reduces GFP-Ras1p protein levels and affects its lo-calization. (A) SC5314 cells were grown in Spider medium at 37°C in the absence or presence of 25M CLA and harvested at the indicated time points. Transcript levels ofRAS1were measured by quantitative PCR and normalized to those forACT1. Relative expression levels were obtained by normalizing data for each time point to data obtained at time zero. Data are means and standard deviations for duplicate biological samples. (B) Ras1p protein levels were analyzed using a strain expressing GFP-Ras1p. Total protein extracts were prepared from SC5314 (mock) and GFP-Ras1p (WY-ZXD3) strains grown as described for panel A in the absence or presence of 100M CLA. Western blotting was performed using anti-GFP antibodies. Gsp1p, shown as a loading control, was detected using antibodies raised againstS. cerevisiaeGsp1p. Molecular masses (kDa) are indicated on the left. (C) GFP-Ras1p-expressing cells were grown in Spider medium at 30°C in the absence or presence of 100M CLA. Aliquots of cells were removed and examined directly at ⫻100 magnification using epifluorescence.
on September 8, 2020 by guest
http://ec.asm.org/
S2 to S4 in the supplemental material), suggesting that CLA was possibly being converted to glucose. We ruled out that fatty acid metabolism was involved in the CLA-mediated hy-phal growth inhibition by confirming that CLA blocked
fila-mentation of the fox2/fox2, icl1/icl1, and ctf1/ctf1 mutant
strains, which are unable to metabolize fatty acids (72, 73; data not shown). However, fatty acids are not only metabolized via
-oxidation, they can also be derived into oxygenated lipid
metabolites. InC. albicans, arachidonic acid was shown to be a
precursor for the production of 3,18-dihydroxy-5,8,11,14-eico-satetraenoic acid (3,18-di-HETE), an eicosanoid found exclu-sively in hyphae which was suggested to play a role in morpho-genesis (25). Fatty acids such as linoleic and arachidonic acids are also derived into prostaglandins and leukotrienes, which reportedly affect hyphal development (29, 67). Indeed, prosta-glandin E2 and thromboxane B2 were shown to enhance the yeast-to-hypha transition (44, 68, 69). Thus, while our results demonstrate that molecules derived from CLA’s metabolism played no role in the CLA-mediated hyphal growth inhibition, we cannot exclude the possibility that oxygenated CLA deriv-atives may be involved in the effect.
We used global gene expression profiling as a means to investigate the transcriptional profile of cells induced to fila-ment in the presence of CLA. Temperature shift in Spider medium promotes a hyphal growth program similar to the one induced upon filamentation in Lee’s medium (see Table S1 in the supplemental material) (34). Spider and Lee’s media have similar compositions, containing a source of fermentable car-bon (mannitol or glucose), various amino acids, and salts, which may explain why the two transcriptional profiles were
similar. Transcript levels of hypha-specific genes, such as
ECE1, ALS3, and HYR1, and of several key regulators of
hyphal growth, includingCPH1,CPH2,TEC1,BCR1,UME6,
GAT2, RAS1, and CYR1, increased during filamentation in
Spider medium (Tables 3 and S1). However, the induction levels of several of these genes were lower than in other studies (34, 61). This discrepancy may have been due to hypha-induc-ing signals behypha-induc-ing weaker in Spider medium or to filamentation being somewhat induced under our control condition (Fig. 3A). Nonetheless, the transcriptional data indicated roles for
the Ras1p-cAMP-PKA, the MAP kinase, theCPH2-TEC1, and
the Tup1p-Nrg1p signaling pathways. These results confirmed that hyphal growth in Spider medium is regulated by a network of known signaling pathways which are activated simultane-ously and converge (or do not converge) onto many of the same target transcription factors (4, 9, 12).
Comparing the transcriptional profiles of untreated and CLA-treated cells revealed that CLA affected the expression of genes encoding signal transducers and transcription factors,
includingRAS1,TEC1, UME6, and RFG1(Fig. 3C). We
ex-amined CLA’s effect on hyphal growth in strains deleted for
each of these genes and showed thatUME6andRFG1were
dispensable for CLA-mediated inhibition of filamentation
(Fig. 4). Similar conclusions forRAS1andTEC1could not be
drawn, as both genes are required for hyphal growth in Spider medium (our observations and references 39, 53, and 90).
Given thatTEC1lies downstream of the Ras1p-cAMP-PKA
signaling pathway, we showed that CLA decreasedTEC1
ex-pression levels in a mostly Ras1p-dependent manner (Fig. 5B
and C). Unexpectedly, while TEC1 induction was partially
FIG. 7. CLA affects the Tup1p-Nrg1p signaling pathway. (A) The CAI4,tup1/tup1(BCa2-10), andnrg1/nrg1(BCa23-3) strains were grown in Spider medium at 37°C in the absence or presence of 25M CLA for 4 h. Aliquots of cells were harvested and visualized at⫻100 magnification by DIC optics. Bar⫽10m. (B)C. albicansSC5314 cells were grown as described for panel A and harvested at the indicated time points. Transcript levels ofTUP1andNRG1were measured as described for Fig. 6A.
on September 8, 2020 by guest
http://ec.asm.org/
Efg1p dependent, CLA downregulated TEC1 mRNA levels
independently ofEFG1(Fig. 5B). These results demonstrated
that CLA inhibited filamentation by affecting the Efg1p-inde-pendent branch of the Ras1p signaling pathway. Likewise, the Hsp90p inhibitor geldanamycin was shown to modulate hyphal growth by affecting the Ras1p-cAMP-PKA signaling pathway independently of Efg1p (79).
Transcriptional profiling further revealed that CLA affected
RAS1expression (Fig. 3C). Indeed, CLA blocked the increase
inRAS1transcript levels, which occurred upon the
yeast-to-hypha transition (Fig. 6A). Quite unexpectedly, whileRAS1
mRNA levels remained constant in CLA-treated cells, GFP-Ras1p levels declined gradually (Fig. 6B). CLA also affected localization of GFP-Ras1p to the plasma membrane (Fig. 6C). Decreased GFP-Ras1p levels could be due to a decrease in its mRNA translation or to its degradation. However, several lines of evidence indicate that Ras delocalization results in its degradation and ultimately reduces its cellular levels. For
in-stance, inSaccharomyces cerevisiae, a mutant Ras2p protein
that could not be targeted to the membrane had lower cellular levels than the wild-type protein (24). Furthermore, farnesyl-thiosalicylic acid treatment was shown to dislodge Ras from the membrane and induce its degradation, resulting in lower Ras levels (35). In light of our findings, we can only speculate that the reduced GFP-Ras1p steady-state levels seen in CLA-treated cells stem from the protein being delocalized from the plasma membrane.
Several reasons may account for CLA’s effect on GFP-Ras1p localization. First, the fatty acid may interfere with the posttranslational modifications of GFP-Ras1p. Ras proteins are modified by the addition of C-terminal lipids, such as farnesyl and palmitoyl moieties (84). Such modifications are involved in membrane association and subcellular localization, which are critical for Ras biological activities. Posttranslational
modifications of Ras also play a role in filamentation in C.
albicans, as compounds that prevent Ras prenylation were
shown to inhibit hyphal growth (58). Second, CLA may also affect GFP-Ras1p localization by modifying the lipid compo-sition of membranes. By being incorporated into membrane phospholipids, unsaturated fatty acids such as CLA may alter membrane structure and function, influencing the interaction of resident proteins with the plasma membrane (17). For in-stance, the polyunsaturated fatty acid docosahexaenoic acid (DHA) was shown to decrease membrane association of Ras by weakening its interactions with phospholipid acyl chains (21, 78). Interestingly, DHA also affected GFP-Ras1p localization
to the plasma membrane inC. albicans(data not shown). The
upregulation of RTA3transcript levels in CLA-treated cells
may be genetic evidence that the fatty acid is modifying mem-brane lipid composition (see Tables S2 to S4 in the
supple-mental material). Indeed, theS. cerevisiae RTA3 homologue
(RSB1) was shown to be induced when plasma membrane
glycerophospholipid asymmetry was altered (41). Nonetheless, further studies are warranted to address the underlying mech-anism by which CLA exerts its effect on GFP-Ras1p membrane localization.
The biological activity of Ras is dictated by its subcellular
localization. In S. cerevisiae, the farnesylated,
membrane-bound form of Ras2p is approximately 100 times more effective in activating adenylate cyclase than its cytoplasmic form (49).
Thus, it is tempting to suggest that CLA modulates the Ras1p signaling pathway by affecting the localization of Ras1p to the plasma membrane (Fig. 6C) and by abrogating the increases in
RAS1mRNA and protein levels (Fig. 6A and B). CLA would
prevent the activation of the Ras1p pathway, resulting in the
downregulation ofTEC1 expression levels and inhibiting
hy-phal growth inC. albicans(Fig. 8). Additionally, CLA may also
inhibit hyphal growth by preventing the relief of repression exerted by the Tup1p-Nrg1p pathway (Fig. 7B). Because the hyphal growth program is controlled by a network of signaling pathways, we expect the effect of CLA, like that of farnesol, to be multifactorial, in that the fatty acid could affect more than one signaling pathway (52). Nonetheless, our findings that
CLA modulatesRAS1mRNA and protein levels inC. albicans
demonstrate the broad-spectrum therapeutic properties of CLA, as the Ras pathway regulates filamentous growth and virulence in other fungi (26).
ACKNOWLEDGMENTS
We thank R. Kolter (Harvard Medical School), M. Whiteway and D. Harcus (Biotechnology Research Institute, National Research Council of Canada), A. P. Mitchell (Carnegie Mellon University), D. Kadosh (University of Texas, San Antonio), H. Liu (University of California, Irvine), J. Ernst (Du¨sseldorf Universita¨t, Germany), M. C. Lorenz (University of Texas Medical School, Houston), and M. Raymond and L. de Repentigny (Universite´ de Montre´al) for strains and plasmids, C. Beaurepaire (Biotechnology Research Institute, National Research FIG. 8. Proposed model underlying the mechanism by which CLA inhibits hyphal growth inCandida albicans. CLA inhibits the increase inRAS1mRNA and protein levels and affects Ras1p membrane lo-calization. Combined, these CLA-mediated effects impede the activa-tion of the Ras1 signaling pathway and ultimately downregulateTEC1
expression and inhibit hyphal growth. In addition, CLA inhibits hyphal growth by preventing the relief of repression exerted by the Tup1p-Nrg1p complex.
on September 8, 2020 by guest
http://ec.asm.org/
Council of Canada) for RNA labeling and microarray hybridizations, M. Cle´ment for insightful discussions, and P. C. Hallenbeck for critical reading of the manuscript.
J.S. is supported by studentships from the Natural Sciences and Engineering Research Council of Canada (NSERC), the Fonds Que´be´cois de la Recherche Sur la Nature et les Technologies (FQRNT), and the Faculty of Graduate Studies of the Universite´ de Montre´al. P.B. is the recipient of the Saputo Research Chair in Bio-medical Dairy Products Optimization of the Universite´ de Montre´al.
REFERENCES
1.Banerjee, M., et al. 2008. UME6, a novel filament-specific regulator of Candida albicans hyphal extension and virulence. Mol. Biol. Cell19:1354– 1365.
2.Bastidas, R. J., J. Heitman, and M. E. Cardenas.2009. The protein kinase Tor1 regulates adhesin gene expression in Candida albicans. PLoS Pathog. 5:e1000294.
3.Belhumeur, P., et al.1993. GSP1 and GSP2, genetic suppressors of the prp20-1 mutant in Saccharomyces cerevisiae: GTP-binding proteins involved in the maintenance of nuclear organization. Mol. Cell. Biol.13:2152–2161. 4.Biswas, S., P. Van Dijck, and A. Datta.2007. Environmental sensing and signal transduction pathways regulating morphopathogenic determinants of Candida albicans. Microbiol. Mol. Biol. Rev.71:348–376.
5.Bockmuhl, D. P., and J. F. Ernst.2001. A potential phosphorylation site for an A-type kinase in the Efg1 regulator protein contributes to hyphal mor-phogenesis of Candida albicans. Genetics157:1523–1530.
6.Bockmuhl, D. P., S. Krishnamurthy, M. Gerads, A. Sonneborn, and J. F. Ernst. 2001. Distinct and redundant roles of the two protein kinase A isoforms Tpk1p and Tpk2p in morphogenesis and growth of Candida albi-cans. Mol. Microbiol.42:1243–1257.
7.Braun, B. R., W. S. Head, M. X. Wang, and A. D. Johnson.2000. Identifi-cation and characterization of TUP1-regulated genes in Candida albicans. Genetics156:31–44.
8.Braun, B. R., and A. D. Johnson.1997. Control of filament formation in Candida albicans by the transcriptional repressor TUP1. Science277:105– 109.
9.Braun, B. R., and A. D. Johnson.2000. TUP1, CPH1 and EFG1 make independent contributions to filamentation in candida albicans. Genetics 155:57–67.
10.Braun, B. R., D. Kadosh, and A. D. Johnson.2001. NRG1, a repressor of filamentous growth in C.albicans, is down-regulated during filament induc-tion. EMBO J.20:4753–4761.
11.Brown, A. J., F. C. Odds, and N. A. Gow. 2007. Infection-related gene expression in Candida albicans. Curr. Opin. Microbiol.10:307–313. 12.Brown, A. J. P., S. Argimon, and N. A. R. Gow.2007. Signal transduction and
morphogenesis in Candida albicans, p. 167–194. In R. J. Howard and N. A. R. Gow (ed.), Biology of the fungal cell, 2nd ed. The Mycota VIII, 2nd ed. Springer-Verlag, Berlin, Germany.
13.Brown, D. H., Jr., A. D. Giusani, X. Chen, and C. A. Kumamoto.1999. Filamentous growth of Candida albicans in response to physical environ-mental cues and its regulation by the unique CZF1 gene. Mol. Microbiol. 34:651–662.
14.Cao, F., et al.2006. The Flo8 transcription factor is essential for hyphal development and virulence in Candida albicans. Mol. Biol. Cell17:295–307. 15.Carlisle, P. L., et al.2009. Expression levels of a filament-specific transcrip-tional regulator are sufficient to determine Candida albicans morphology and virulence. Proc. Natl. Acad. Sci. U. S. A.106:599–604.
16.Cassola, A., et al.2004. Candida albicans lacking the gene encoding the regulatory subunit of protein kinase A displays a defect in hyphal formation and an altered localization of the catalytic subunit. Eukaryot. Cell3:190–199. 17.Chapkin, R. S., et al.2008. Bioactive dietary long-chain fatty acids: emerging
mechanisms of action. Br. J. Nutr.100:1152–1157.
18.Church, G. M., and W. Gilbert.1984. Genomic sequencing. Proc. Natl. Acad. Sci. U. S. A.81:1991–1995.
19.Clement, M., J. Tremblay, M. Lange, J. Thibodeau, and P. Belhumeur.2007. Whey-derived free fatty acids suppress the germination of Candida albicans in vitro. FEMS Yeast Res.7:276–285.
20.Clement, M., J. Tremblay, M. Lange, J. Thibodeau, and P. Belhumeur.2008. Purification and identification of bovine cheese whey fatty acids exhibiting in vitro antifungal activity. J. Dairy Sci.91:2535–2544.
21.Collett, E. D., L. A. Davidson, Y. Y. Fan, J. R. Lupton, and R. S. Chapkin. 2001. n-6 and n-3 polyunsaturated fatty acids differentially modulate onco-genic Ras activation in colonocytes. Am. J. Physiol. Cell Physiol.280:C1066– C1075.
22.Davis, D., R. B. Wilson, and A. P. Mitchell.2000. RIM101-dependent and -independent pathways govern pH responses in Candida albicans. Mol. Cell. Biol.20:971–978.
23.Davis-Hanna, A., A. E. Piispanen, L. I. Stateva, and D. A. Hogan.2008. Farnesol and dodecanol effects on the Candida albicans Ras1-cAMP signal-ling pathway and the regulation of morphogenesis. Mol. Microbiol.67:47–62. 24.Deschenes, R. J., and J. R. Broach.1987. Fatty acylation is important but not
essential for Saccharomyces cerevisiae RAS function. Mol. Cell. Biol. 7:2344–2351.
25.Deva, R., R. Ciccoli, T. Schewe, J. L. Kock, and S. Nigam.2000. Arachidonic acid stimulates cell growth and forms a novel oxygenated metabolite in Candida albicans. Biochim. Biophys. Acta1486:299–311.
26.D’Souza, C. A., and J. Heitman.2001. Conserved cAMP signaling cascades regulate fungal development and virulence. FEMS Microbiol. Rev.25:349– 364.
27.Edmond, M. B., et al.1999. Nosocomial bloodstream infections in United States hospitals: a three-year analysis. Clin. Infect. Dis.29:239–244. 28.Enjalbert, B., A. Nantel, and M. Whiteway.2003. Stress-induced gene
ex-pression in Candida albicans: absence of a general stress response. Mol. Biol. Cell14:1460–1467.
29.Erb-Downward, J. R., and M. C. Noverr.2007. Characterization of prosta-glandin E2 production by Candida albicans. Infect. Immun.75:3498–3505. 30.Ernst, J. F.2000. Transcription factors in Candida albicans—environmental
control of morphogenesis. Microbiology146(8):1763–1774.
31.Fang, H. M., and Y. Wang.2006. RA domain-mediated interaction of Cdc35 with Ras1 is essential for increasing cellular cAMP level for Candida albicans hyphal development. Mol. Microbiol.61:484–496.
32.Fonzi, W. A., and M. Y. Irwin.1993. Isogenic strain construction and gene mapping in Candida albicans. Genetics134:717–728.
33.Gillum, A. M., E. Y. Tsay, and D. R. Kirsch.1984. Isolation of the Candida albicans gene for orotidine-5⬘-phosphate decarboxylase by complementation of S. cerevisiae ura3 and E. coli pyrF mutations. Mol. Gen. Genet.198:179– 182.
34.Goyard, S., et al.2008. The Yak1 kinase is involved in the initiation and maintenance of hyphal growth in Candida albicans. Mol. Biol. Cell19:2251– 2266.
35.Haklai, R., et al.1998. Dislodgment and accelerated degradation of Ras. Biochemistry37:1306–1314.
36.Hisajima, T., et al.2008. Protective effects of farnesol against oral candidi-asis in mice. Microbiol. Immunol.52:327–333.
37.Hnisz, D., O. Majer, I. E. Frohner, V. Komnenovic, and K. Kuchler.2010. The Set3/Hos2 histone deacetylase complex attenuates cAMP/PKA signaling to regulate morphogenesis and virulence of Candida albicans. PLoS Pathog. 6:e1000889.
38.Hogan, D. A., A. Vik, and R. Kolter.2004. A Pseudomonas aeruginosa quorum-sensing molecule influences Candida albicans morphology. Mol. Microbiol.54:1212–1223.
39.Homann, O. R., J. Dea, S. M. Noble, and A. D. Johnson.2009. A phenotypic profile of the Candida albicans regulatory network. PLoS Genet.5:e1000783. 40.Hornby, J. M., et al.2001. Quorum sensing in the dimorphic fungus Candida albicans is mediated by farnesol. Appl. Environ. Microbiol.67:2982–2992. 41.Ikeda, M., A. Kihara, A. Denpoh, and Y. Igarashi.2008. The Rim101
path-way is involved in Rsb1 expression induced by altered lipid asymmetry. Mol. Biol. Cell19:1922–1931.
42.Kadosh, D., and A. D. Johnson.2001. Rfg1, a protein related to the Saccha-romyces cerevisiae hypoxic regulator Rox1, controls filamentous growth and virulence in Candida albicans. Mol. Cell. Biol.21:2496–2505.
43.Kadosh, D., and A. D. Johnson.2005. Induction of the Candida albicans filamentous growth program by relief of transcriptional repression: a ge-nome-wide analysis. Mol. Biol. Cell16:2903–2912.
44.Kalo-Klein, A., and S. S. Witkin.1990. Prostaglandin E2 enhances and gamma interferon inhibits germ tube formation in Candida albicans. Infect. Immun.58:260–262.
45.Kebaara, B. W., et al.2008. Candida albicans Tup1 is involved in farnesol-mediated inhibition of filamentous-growth induction. Eukaryot. Cell7:980– 987.
46.Khalaf, R. A., and R. S. Zitomer.2001. The DNA binding protein Rfg1 is a repressor of filamentation in Candida albicans. Genetics157:1503–1512. 47.Kippert, F.1995. A rapid permeabilization procedure for accurate
quanti-tative determination of beta-galactosidase activity in yeast cells. FEMS Mi-crobiol. Lett.128:201–206.
48.Kumamoto, C. A., and M. D. Vinces.2005. Contributions of hyphae and hypha-co-regulated genes to Candida albicans virulence. Cell. Microbiol. 7:1546–1554.
49.Kuroda, Y., N. Suzuki, and T. Kataoka.1993. The effect of posttranslational modifications on the interaction of Ras2 with adenylyl cyclase. Science259: 683–686.
50.Lane, S., C. Birse, S. Zhou, R. Matson, and H. Liu.2001. DNA array studies demonstrate convergent regulation of virulence factors by Cph1, Cph2, and Efg1 in Candida albicans. J. Biol. Chem.276:48988–48996.
51.Lane, S., S. Zhou, T. Pan, Q. Dai, and H. Liu.2001. The basic helix-loop-helix transcription factor Cph2 regulates hyphal development in Candida albicans partly via TEC1. Mol. Cell. Biol.21:6418–6428.
52.Langford, M. L., A. L. Atkin, and K. W. Nickerson.2009. Cellular interac-tions of farnesol, a quorum-sensing molecule produced by Candida albicans. Future Microbiol.4:1353–1362.
53.Leberer, E., et al.2001. Ras links cellular morphogenesis to virulence by regulation of the MAP kinase and cAMP signalling pathways in the patho-genic fungus Candida albicans. Mol. Microbiol.42:673–687.