INTRODUCTION
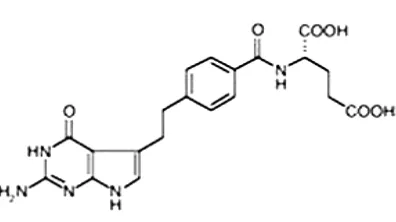
Pemetrexed is an anticancer drug indicated in the treatment of pleural mesothelioma as well as non small cell lung cancer. Its chemical name is 2-[4-[2-(4-amino-2-oxo-3, 5, 7-triazabicyclo [4.3.0] nona-3, 8, 10-trien-9-yl) ethyl] benzoyl] aminopentanedioic acid. Its chemical structure is shown in figure 1. It is a folate analog metabolic inhibitor that exerts its action by disrupting folate-dependent metabolic processes essential for cell replication. In vitro studies have shown that pemetrexed inhibits thymidylate synthase (TS), dihydrofolate reductase (DHFR), and glycinamide
Validated reverse phase HPLC method for the determination
of pemetrexed disodium in pharmaceutical dosage forms
THAHERA BANU
1, MURALI BALARAM VARANASI*, M.MUSHRAFF ALI KHAN,
JVC SHARMA, B. BHANU TEJA
2, V. SWAROOP KUMAR
3and M. HABIBUDDIN
41Department Of Pharmaceutical Analysis, Sultan-Ul-Uloom College Of Pharmacy,
Mount Pleasant, Road No.3,Banjara Hills, Hyderabad - 34 (India).
2M/s.TherDose Pharma Pvt. Ltd, Pragathi Nagar, IE, Kukatpally,Hyderabad - 500 072 (India). 3M/s. Incogen Therapeutics Ltd, ICICI Knowledge Park, Shamirpet, Hyderabad (India).
4Alliance Institute of Advanced Pharmaceutical and Health Sciences,
Aditya Trade Center-604A, Ameerpet ,Hyderabad - 500 038 (India). (Received: June 18, 2010; Accepted: July 21, 2010)
ABSTRACT
A simple and isocratic reverse phase high performance liquid chromatography (RP-HPLC) method was developed and validated for quantitative determination of Pemetrexed Disodium in bulk drug samples and formulations. The method was validated for system suitability, accuracy, precision, linearity, specificity, solution stability, limit of detection and limit of quantitation. Pemetrxed Disodium was analyzed by using Zorbax SB – C18 (250 mm x 4.6 mm, 5 µm) at ambient temperature, with isocratic elution of Buffer:Acetonitrile (90:10). The flow rate was set at 0.9 ml/min and the analysis was performed at a wavelength of 265 nm using Photo Diode Array (PDA) detector. Efficient UV detection at 265 nm enabled determination of Pemetrexed disodium without any interference from injectable solution excipients or solvents. The retention time (RT) for Pemetrexed disodium was around 6 min. The calibration curves were linear over a concentration range from 0.06248 mg to 0.49984 mg/ml. Limit of detection (LOD) for Pemetrexed disodium was 0.00002522 mg/ml and Limit of quantitation (LOQ) was 0.0001261 mg/ml. The developed method was successfully applied to estimate the amount of Pemetrexed disodium in formulations.
Key words: Pemetrexed disodium, high performance liquid chromatography, reverse phase liquid chromatography, validation.
ribonucleotide formyltransferase (GARFT), which are folate-dependent enzymes involved in the de novo biosynthesis of thymidine and purine nucleotides.
Few HPLC methods for quantitative deter mination of Pemetrexed disodium in formulations were reported in the literature and these reports mainly included the determination of Pemetrexed disodium and its metabolites in biological fluids1-5. The aim of the work is to develop
injectable preparations. In order to minimize batch-to-batch variation there is an immense need for developing a rapid, sensitive and validated analytical method for day-to-day analysis of the drug in pharmaceutical dosage forms.
MATERIAL AND METHODS Chemicals and reagents
Pemetrexed disodium bulk drug (99.80 % purity) and formulations were kind gifts from TherDose Pharma Pvt. Ltd.,Hyderabd, India. Acetonitrile (HPLC grade) was obtained from Rankem, India.
Instrumentation
The HPLC system consisted of a Shimadzu LC–2010 AHT module with PDA Detector. Data acquisition was performed by LC solutions software operated on a Pentium® IV microprocessor. Zorbax SB – C18 (250 mm x 4.6 mm 5 µm) at ambient temperature, with isocratic elution of Buffer: Acetonitrile (90:10). The flow rate was set 0.9 ml/min and the analysis was performed at a wavelength of 265 nm using Photo Diode Array (PDA) detector. The mobile phase was degassed and filtered through 0.2 µm membrane filter before pumping into HPLC system.
Preparation of solutions Buffer
About 13.8 gms of disodium hydrogen phosphate dihydrate in 1000 ml of milli Q water and adjust the pH to 6.5 with orthophosphoricacid. Preparation of drug stock solution
The stock solution of Pemetrexed disodium was prepared by dissolving accurately weighed quantity of 62.48 mg of the drug in 50 ml of milli Q water ( concentration 1.2496mg/ml).
Method validation System suitability
The system suitability was assessed by replicate analysis of six injections of the drug at a concentration of 0.251 mg/ml. The acceptance criteria were not more than 2% for the percentage relative standard deviation (% RSD) for the+- peak area and 1.5% for retention time of Pemetrexed disodium peaks. The number of theoretical plates
should not be less than 2500.
Determination of Limit of Detection and Limit of Quantitation (Sensitivity)
The limit of detection is determined by calculating the signal to noise ratio and by comparing test results from samples with known concentrations of analyte with those of blank samples and establishing the minimum level at which the analyte can be reliably detected6-10 . The LOD and LOQ of
the method were demonstrated by preparing 4 level concentrations of 0.01%, 0.03%, 0.05% and 0.07% of the target concentration of -0.25 mg/ml. About 20 µl of Pemetrexed disodium level solutions were injected into the chromatographic system and observed S/N ratio.
Calculation
Height / baseline noise x 1000 Linearity (Calibration curve)
Standard Stock solution
Accurately weighed 62.48 mg of Pemetrexed disodium drug substance and transferred to a 50 ml volumetric flask. Dissolved and brought to volume with the milliQ water and mixed. (Concentration 1.2496 mg/ml)
Level solutions
A series of solutions in 7 concentrations of 25%, 50%, 75%, 100%, 125%, 150% and 200% were prepared using the standard stock solution.
The linear ity of the method was demonstrated by above prepared level concentration 50%, 75%, 100%, 125%, 150%, 150%, 200% of the target concentration of 1.2496 mg/ml. About 20 µl of each of the above prepared solutions was injected onto the chromatographic system connected to ZORBAX SB-C18 column (in duplicate) and calculated the average area in each case.
Accuracy and precision
actual concentration employed in the usual procedure. The actual concentration employed in the determination was 0.25 mg/ml of Pemetrexed disodium containing the excipients used in the inventor formulation and the recovery was calculated in each of the case using the regression line equation.
Demonstration of precision was done under two categories. The injection reproducibility was assessed by injecting six replicate injections of the standard solution of Pemetrexed disodium and the relative standard deviation of the replicate injections was calculated.
Injection Reproducibility
Relative standard deviation of RT and Area of the above system suitability solution were calculated for injection reproducibility.
Method Precision
Six individual preparations of Pemetrexed disodium drug substance were prepared with target concentration of about 0.25 mg/ml for Method Precision.
Procedure
Injected 50 µL of above preparations onto the chromatographic system connected to a Zorbax SB-C18 column in duplicate and recorded the chromatograms. Calculated the peak areas due to pemetrexed peak.
Application of the Method to Dosage Forms Statistical Analysis
Calculated the Mean, Standard Deviation and the Relative Standard Deviation for the assay of 6 preparations.
Calculations
Calculated the content of the Pemetrexed disodium in the sample solution using the following formula: S T S t
W
A
X
X P
A
W
Where,
AT = Average area of the sample preparation AS = Average area of the standard preparation
P = Potency of the standard
WT = Concentration (mg/ml) of the sample solution WS = Concentration (mg/ml) of the standard solution Solution stability
The validity of the assay solutions was demonstrated for a period of 48 hours by chromatographing the same solution at periodic intervals.
Procedure
About 20 ml of the standard solution was injected at 0, 24 and 48 hrs onto the column of the chromatographic system and recorded the peak areas in the chromatograms.
Calculations
Observed the areas of the peaks of Pemetrexed disodium injected at the mentioned time intervals and calculated their corresponding concentrations.
Specificity
The specificity of the method was demonstrated by interference check by injecting the diluent blank and placebo solution to determine whether any peaks in the diluent and placebo solution are co-eluting with Pemetrexed disodium peaks.
RESULTS AND DISCUSSION Method development and optimization
Pemetrexed is freely soluble in water. The drug can be separated on a Zorbax SB – C18 column in reverse phase mode. The optimization of the method development was done by isocratic elution. The following isocratic program was used for method development.
Mobile Phase: Buffer: Acetonitrile (90:10) The peak shape and symmetry were good with above isocratic elution and Pemetrexed disodium peaks were resolved with greater than 1.0 resolution at a flow rate of 0.9 ml/min.
Method Validation System Suitability
Table 1: System suitability study of pemetrexed disodium
Injection Retention Peak Theoretical Tailing
Number Time Area plates factor
Injection – 1 6.39 8800832 3909 1.2
Injection – 2 6.38 8800684 3969 1.2
Injection – 3 6.36 8795368 4027 1.2
Injection – 4 6.36 8797957 4084 1.2
Injection – 5 6.36 8795009 4113 1.3
Injection – 6 6.35 8797044 4124 1.3
Mean 6.37 8797816 4038 1.2
RSD 0.23 0.03 2.12 0.85
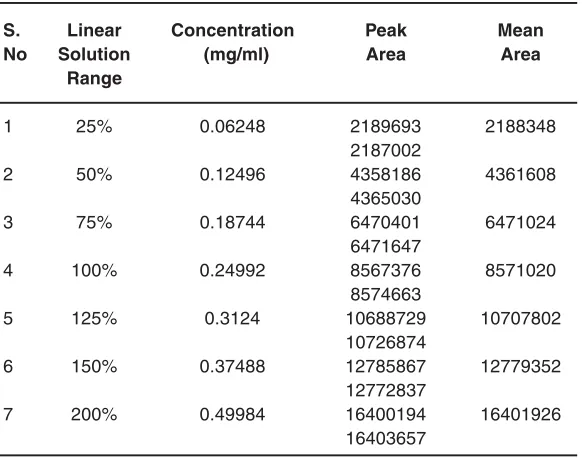
Table 2: Linearity of pemetrexed disodium
S. Linear Concentration Peak Mean
No Solution (mg/ml) Area Area
Range
1 25% 0.06248 2189693 2188348
2187002
2 50% 0.12496 4358186 4361608
4365030
3 75% 0.18744 6470401 6471024
6471647
4 100% 0.24992 8567376 8571020
8574663
5 125% 0.3124 10688729 10707802
10726874
6 150% 0.37488 12785867 12779352
12772837
7 200% 0.49984 16400194 16401926
16403657 percentage relative standard deviation (%RSD) for
Peak Area was not more than 2.0 % for Pemetrexed disodium peaks.
The %RSD of peak area for the drug is within 2% indicating the suitability of the system (Table 1). The efficiency of the column as expressed by number of theoretical plates for the 6 replicate injections was 4038 and the tailing factor was 1.2. Determination of Limit of Detection and Limit of Quantitation (Sensitivity)
Limit of detection (LOD) for Pemetrexed disodium was found to be 0.00002522mg/ml and
Limit of quantitation (LOQ) Pemetrexed disodium was 0.0001261mg/ml.
Linearity
The calibration curve constructed was evaluated by its correlation coefficient. The peak area of the drug was linear in the range of 0.06248 to 0.49984 mg/ml.
Statistical Evaluation
Table 3: % Recovery of pemetrexed disodium
Level Amount added Mean Area Amount found % of
Pemetrexed disodium response (Pemetrexed disodium recovery
(conc. mg/ml) (conc. mg/ml)
75% 0.18744 6474303 0.18766 100.1
0.18744 6470401 0.18754 100.1
0.18744 6471647 0.18758 100.1
100% 0.24992 8565240 0.24950 99.8
0.24992 8567376 0.24956 99.9
0.24992 8574663 0.24978 99.9
125% 0.3124 10675880 0.31192 99.8
0.3124 10688729 0.31230 100.0
0.3124 10726874 0.31343 100.3
Mean 100.0
SD 0.16
% of RSD 0.16
Calibration curve equation values: Slope : 33811172 Intercept : 129369 R2 value : 0.999
Table 4: Method precision of pemetrexed disodium
S.No Solution ID Conc. (mg/ml) Peak Area Mean Area Assay
1 Standard solution 0.2532 8645995 8638178 89.0
8641508 8634963 8634646 8635867 8636089
2 Preparation – 1 0.2450 8379781 8309856 88.5
8239931
3 Preparation – 2 0.2554 8715431 8716292 89.0
8717153
4 Preparation – 3 0.2556 8695489 8692563 88.7
8689637
5 Preparation – 4 0.2554 8713372 8715005 89.0
8716637
6 Preparation – 5 0.2426 8228981 8226842 88.5
8224703
7 Preparation – 6 0.2560 8693832 8691851 88.6
8689870
Coefficient, Slope, and Y-intercept. Average areas were shown in table 2 and the plot was shown in figure 2.
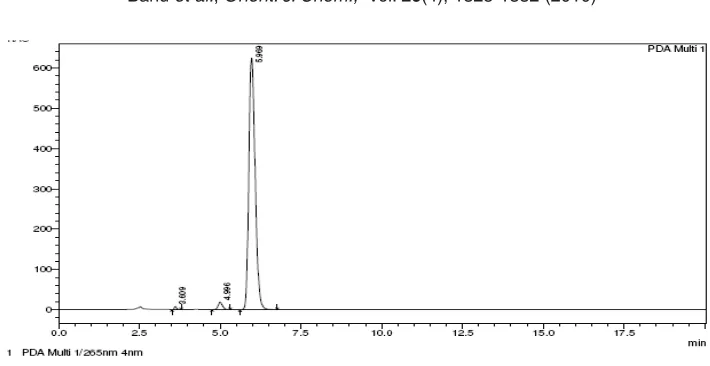
These experiments indicated that there was a linear relationship between the amounts of analyte and the areas within the range studied. The chromatograms of Pemetrexed disodium extracted from the formulation and pure Pemetrexed disodium can be observed in Figures 3 and 4.
Accuracy
Accuracy of the method was determined by recovery experiments. Accuracy was calculated with respect to above prepared solution at the levels of 75%, 100% and 125% of the normal or target concentration. The accuracy of the method was demonstrated through recovery experiment on 3 samples at concentration 75.08%, 99.83% and 124.95% of the actual concentration employed in the usual procedure. The actual concentration employed in the determination was 0.25 mg/ml of Pemetrexed disodium. The amount of Pemetrexed disodium found in each of these test solutions was calculated using the calibration curve. The table 3 summarizes the amount added vs. amount found and calculated using the calibration curve and percentage recovery. The results revealed that there was a strong correlation between the amount added and amount found for Pemetrexed disodium. Precision
The precision of the method was demonstrated through two parameters which are
injection reproducibility and the method precision. For method precision, 6 individual samples were prepared from the same batch of the drug substance and measured the individual peak retention time and peak area. The relative standard deviation was calculated for these six samples. For injection reproducibility, six injections from the same standard preparations were made and the relative standard deviation for the duplicate injections was calculated. The results for method precision were given in table 4.
Application of the method to dosage forms The HPLC method developed is sensitive and specific for the quantitative determination of Pemetrexed disodium. The method is validated for different parameters and hence has been applied for the estimation of drug in pharmaceutical dosage for ms. Injections of inventor formulation from TherDose Pharma Pvt. Ltd, India, were evaluated for the amount of Pemetrexed disodium present in the formulation. Each sample was analyzed in triplicate and the amount of Pemetrexed disodium in the formulation was 99.86% (Table 5). None of the injection excipients interfered with the analyte peak as seen in the figures 3 and 4.
Solution stability
The validity of the assay solutions was demonstrated for a period of 48 hours by chromatographing the same solution at periodic intervals.
Table 5: Assay content of pemetrexed disodium
S.No Solution ID Conc. (mg/ml) Mean Area Assay
1. Standard solution 0.2532 8638178 89.0
2. Sample solution 0.2510 8558735 88.88
Table 6: Solution stability data
Time period Peak Area Assay Percent % of initial
Initial 8688061 89.5 100.0
24 hrs 8635998 89.5 100.0
Fig 3: QC sample chromatogram of Pemetrexed Disodium extracted from formulation Fig. 2: Linearity for pemetrexed disodium
Fig. 1: Chemical structure of pemetrexed Procedure
About 20 µl of the standard solution was injected at 0, 24 and 48 hrs onto the column of the chromatographic system and recorded the peak areas in the chromatograms.
Calculations
Observed the areas of the peaks of Pemetrexed disodium injected at the mentioned time intervals and calculated their corresponding concentrations (Table 6).
Specificity
CONCLUSION
A simple and isocratic reverse phase high performance liquid chromatography (RP-HPLC) method was developed and validated for quantitative determination of Pemetrexed disodium in bulk drug samples and for mulations. The method was validated for accuracy, precision, linearity, specificity limit of detection and limit of quantitation. Pemetrexed disodium was analyzed by using Zorbax SB – C18 (250 mm x 4.6 mm, 5 ìm) at ambient temperature, with isocratic elution of Buffer:Acetonitrile as a mobile phase (90:10). The flow rate was set 0.9 ml/min and the analysis was performed at a wavelength of 265 nm using Photo Diode Array (PDA) detector. Efficient UV detection at 265 nm enabled determination of Pemetrexed disodium without any interference from injectable solution excipients or solvents. The retention time (RT) for Pemetrexed disodium was around 6.00 min.
Fig. 4: Chromatogram of Pemetrexed Disodium extracted from standard solution
The calibration curves were linear over a concentration range from 0.06248 mg to 0.4998 mg/ ml. Limit of detection (LOD) for Pemetrexed disodium was 0.00002522 mg/ml and Limit of quantitation (LOQ) Pemetrexed disodium was 0.0001261 mg/ ml. The developed method was successfully applied to estimate the amount of Pemetrexed disodium in formulations. The proposed HPLC method is precise, sensitive, accurate, specific and efficient and can be used in routine analysis in quality control laboratories.
ACKNOWLEDGEMENTS
Authors are thankful to the management of the college and also to Dr.B. Teja, Therdose Pharma Pvt Ltd, kukatpaly Hyderabad for his support and cooperation in completion of this research work.
1. Landis, SH, Murray, T, Bolden, S & Wingo, PA, Cancer J Clin, 49: 8(1999).
2. Mendelsohn, LG, Gates, SB, Habeck, LL, Shackelford, KA, Worzalla, J, Shih, C & Grindey, GB. Adv Enzyme Regul, 36: 365 (1996).
3. Rinaldi, DA, Kuhn, JG, Burris, HA, Dorr, FA, Rodriguez, G, Eckhardt, SG, Jones, S, Woodwor th, JR, Baker, S, Langley, C,
REFERENCES
Mascorro, D, Abrahams, T & Von Hoff, DD, Cancer Chemother Pharmacol, 44: 372(1999).
4. Rivory LP, Clarke SJ, Boyer M, Bishop JF,J Chromatogr B Biomed Sci Appl. 25:135 (2001).