The Peculiar Binary System AE Aquarii from its Characteristic
Multi-wavelength Emission
B. Oruru1,aand P. J. Meintjes2,b
1Department of Physics, Busitema University, P. O. Box 236, Tororo, Uganda
2Department of Physics, University of the Free State, Bloemfontein 9300, South Africa
Abstract.The multi-wavelength properties of the novalike variable system AE Aquarii are discussed in terms of the interaction between the accretion inflow from a late-type main sequence star and the magnetosphere of a fast rotating white dwarf. This results in
an efficient magnetospheric propeller process and particle acceleration. The spin-down of
the white dwarf at a period rate of 5.64×10⁻¹⁴s s−1results in a huge spin-down luminosity
ofLs−d'6×1033erg s−1. Hence, the observed non-thermal hard X-ray emission and VHE
and TeV gamma-ray emission may suggest that AE Aquarii can be placed in the category
of spin-powered pulsars. Besides, observed hard X-ray luminosity ofLX,hard≤5×1030
erg s−1constitutes 0.1 % of the total spin-down luminosity of the white dwarf. This paper
will discuss some recent theoretical studies and data analysis of the system.
1 Introduction
The novalike variable AE Aquarii (AE Aqr) is a low mass, non-eclipsing close binary system. It
con-sists of a fast rotating magnetized white dwarf (P∗=33 s,B∗∼106G) orbiting a late-type secondary
star [8, 16] with orbital period of 9.88 h [32, 33]. The secondary star is a spectral type K3-5 red dwarf star filling its Roche lobe and hence transfers matter to the primary companion [14, 16, 34]. Most cat-aclysmic variables (CVs) have M-type dwarf secondaries, indicating that the K-type secondary star in
AE Aqr suggests a different evolutionary path, perhaps just evolved from the common envelope phase
[28].
AE Aqr has been observed and studied across the electromagnetic spectrum, from radio (through optical) to TeV gamma-rays [20]. It was first observed in the optical [37] and later in other wave-lengths [4, 5, 22, 26]. The most unique characteristic of AE Aqr is perhaps its rapid flaring in almost
all wavelengths [15]. Large optical flares and flickering [25], large radio flares [3] and TeVγ-ray
emission [21] make the system enigmatic [16]. The characteristics of the observed radio flares, which are reportedly distinct from optical, UV, and X-ray flares [1] are associated with transient non-thermal emission processes resembling Cyg X-3 in a high state [4].
AE Aqr reveals itself as a powerful non-thermal variable source in radio and possibly TeVγ-rays,
Figure 1 [2, 3, 9, 21], resembling the microquasar Cyg X-3 rather than any of the presently known CVs [14]. A similar radio brightness has never been observed in any of the other CVs. The observed
ae-mail: [email protected] be-mail: [email protected]
DOI: 10.1051/
C
Owned by the authors, published by EDP Sciences, 2014
/201
epjconf 46407003
Figure 1.Left: Radio light curve of AE Aqr from VLA data [3].Right: Optical and TeVγ-ray light curves from data observed with the SAAO 30 inch Cassegrain telescope and the Nooitgedacht Mk I Cherenkov telescope [21].
luminosity of the strongest TeV flare is∼1034 erg s−1corresponds to the inferred spin-down power
of the white dwarf [21, 22]. In the remaining parts of the spectrum, the emission is predominantly thermal. The UV spectrum of AE Aqr shows strong emission lines, which is characteristic of emission from hot optically thin plasma [10]. A recent Suzaku detection has, however, reported non-thermal hard X-ray emission from AE Aqr above 10 keV [29], a component of this paper.
2 Propeller Spin-down of the White Dwarf
Using data set spanning∼14 years, it has been shown that the white dwarf is spinning down at a
rate of ˙P∼5.64×10⁻¹⁴ s s−1[9], which translates to a luminosity ofL
s-d'6×1033 erg s−1[24]. A
follow-up study revealed a spin-down rate which is∼3.5 % higher [18]. The spin-down luminosity
exceeds the UV & X-ray luminosities,LUV=LX∼1031erg s−1[10, 27], by more that two orders.
Although AE Aqr is classified as a DQ Her system [20], its relatively low X-ray luminosity [8],
and the structure of the Hα Doppler tomogram [36] argue against the possibility of mass accretion
onto the surface of the white dwarf. A proposed model has suggested that most of the accretion out-flow is ejected from the system by the fast rotating magnetosphere of the WD, the so-called propeller process [35, 36]. In this model, the mass ejection takes place before the gas can penetrate into the magnetosphere deeper than the magnetospheric (Alfvén) radius, i.e. where the magnetospheric pres-sure starts to dominate the gas ram prespres-sure. The flow pattern is depicted in Figure 2. At the radius of
closest approach, most of the material of the stream is ejected, with escape velocity ofvesc∼1500 km
s−1[23, 30]. As the blobs gain orbital angular momentum, the WD spins down.
3 Observations of AE Aquarii with Chandra and Swift
The Chandra X-ray Observatory [6, 31] and the Swift gamma-ray burst explorer [13] observed AE
Aqr almost simultaneously [24]. Chandra observed this peculiar source on August 30, 2005 for∼80
ks [18, 19, 24]. Swift observed it between August 30 and September 2, 2005 for a total duration of
∼10.5 ks, as a pre-planned target or a target of opportunity [12, 24]. Processed data was acquired
Figure 2.The magnetic propeller in AE Aqr. Distance of closest approach of the stream is∼1010cm [36].
3.1 Data Reduction and Analysis
For both Chandra and Swift XRT data, use was made of the level 2 event files [24]. Data reduction and analysis were done using ciao version 4.2 and heasoft version 6.11 respectively. For light curves, barycentric corrections were applied to the level 2 files by running the axbary and barycorr tools [24]. These were then used to search for periodicities in the data. The Chandra spectrum was created for
each grating arm and diffraction order. To generate Swift spectra, the on-demand software was used,
where the information of AE Aqr was manually registered [12, 24].
For the UV data, the level I event file (i.e. unscreened event data) of the Swift UVOT data was used. The events were screened using time-tagged quality information both internal and external to
the file, by running theuvotscreentask with the event file as input file, and the orbit ephemeris file.
A level II event data file (with corrected photon arrival times) was then created, from which a light curve necessary for pulse timing was generated. Then, an independent search for periodicities was performed using epoch folding method [17]. The light curve, in this case, was folded with large number of periods where 64 periods were searched with a phase bin of 16 per period, using the default epoch of the light curve of 13613 and the ephemeris of de Jager et al. (1994), and also a period
resolution of of 2.98×10⁻⁵s which was an oversampling of the default Fourier period resolution.
3.2 Results
Figure 3 shows the background subtracted light curves from Chandra and Swift XRT data. These are predominantly soft, highly variable and dominated by flares. The gaps in the Swift data correspond to snapshot observations characteristic of a low-Earth orbit satellite. The pulse period obtained for each
data set wasPpulse=33.0767±0.0068 s and 33.0767±0.0003 s [24]. These are in line with the 33 s
spin period of the white dwarf. The most probable UV pulse period, obtained by fitting a gaussian
to the peak of the period-chi squared plot was 33.0767±0.0032 s. Using the X-ray and UV pulse
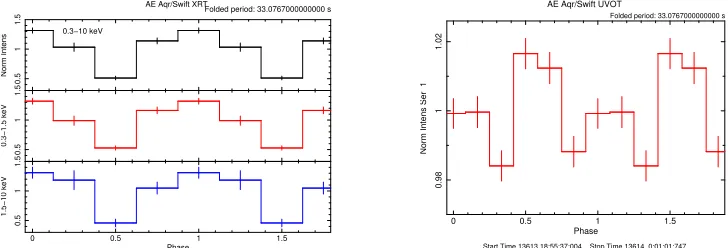
periods from Swift data, pulse profiles were plotted and compared (Figure 4). The X-ray pulse profile is characterized by small amplitude, single-peaked and broad sinusoidals, with the pulse maximum of the 33 s spin period of the white dwarf consistent with that obtained from the Suzaku data [29]. The UV pulse profile shows two peaks per cycle, consistent with ealier studies [10, 11]. The two peaks imply emission from the two magnetic poles at (or close to) the surface of the white dwarf [8, 11].
Figure 5 shows the background subtracted spectra from Chandra and Swift XRT data, fitted with three-temperature vmekal models. These are characterised by emission lines, prominent in the lower
0.05 0.1 0.15 0.2 Counts/sec AE Aqr/Chandra 0.3−10 keV 0.05 0.1 0.15 0.3−2 keV
0 2×10⁴ 4×10⁴ 6×10⁴ 8×10⁴
0.02
0.04
0.06
2−10 keV
Time (s)
Bin time: 1800. s
0
0.2
0.4
Counts/sec
AE Aqr/Swift XRT
0.3−10 keV 0 0.1 0.2 0.3 0.4 0.3−2 keV
0 5×10⁴ 105 1.5×10⁵
0 0.05 0.1 0.15 2−10 keV Time (s)
Bin time: 600.0 s
Figure 3.Background subtracted light curves of AE Aqr.Left: Chandra data.Right: Swift XRT data.
0.5
1
1.5
Norm Intens
AE Aqr/Swift XRT
0.3−10 keV
0.5
1
1.5
0.3−1.5 keV
0 0.5 1 1.5
0.5
1
1.5
1.5−10 keV
Phase
Folded period: 33.0767000000000 s
0 0.5 1 1.5
0.98
1
1.02
Norm Intens Ser 1
Phase AE Aqr/Swift UVOT
Start Time 13613 18:55:37:004 Stop Time 13614 0:01:01:747 Folded period: 33.0767000000000 s
Figure 4.Pulse profiles of AE Aqr.Left: From XRT dataRight: From UVOT data.
4 Possible Emission Models
Although the UV and X-ray luminosities of AE Aqr are the same (L∼1031 erg s−1), and also the
pulse periods of the light curves are the same, the pulse profiles suggest that the UV and the X-ray
emission are from different location within the system. The double-peaked profile of the UV light
curve is associated with emission from the two magnetic poles of the white dwarf, possibly due to the drifting of material attached to the field lines at the magnetospheric radius. In this case, plasma instabilities at the Alfvén radius inhibits 100 % magnetospheric propeller.
The source of soft X-ray emission in AE Aqr has been modeled to be the result of conversion of a fraction gravitational potential energy to heat energy of the ballistic stream at the Alfvén radius of the white dwarf [24]. The observed hard X-ray emission [29], has been modeled in terms of a pulsar-like
process, in which particles are accelerated to relativistic energies,γ >107 [24]. This occurs in the
regions where the synchrotron losses are less dominant compared to particle acceleration.
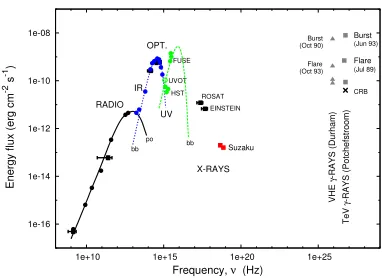
The spectral energy distribution (SED) of AE Aqr (constructed using catalogue, published and analysed data) is shown in Figure 6. The radio and far-IR data have been fitted with a power-law model, emission being attributed to synchrotron radiation of expanding magnetized blobs of relativis-tic electrons [3, 24]. The near-IR and oprelativis-tical data are fitted with a thermal black body model of
temperature ofTbb,1'4.65×10³K, and the emission is associated with the red star. The UV data
emis-AE Aqr/Chandra (MEG, m = −1) Energy (keV) 1 10 Counts/sec/keV 1e−05 0.0001 0.001 0.01 0.1 Sigma −4 −2 0 2 4 10−6 10−5 10−4 10−3 0.01 Photons cm −2 s
−1 keV
−1
AE Aqr/Swift XRT (Unfolded spectrum)
1
0.5 2 5
−0.5 0 0.5 1 1.5 ratio Energy (keV)
Figure 5.Background subtracted spectra of AE Aqr.Left: MEG spectrum for the diffraction orderm=-1.Right: Unfolded spectrum from Swift XRT data.
1e-16 1e-14 1e-12 1e-10 1e-08
1e+10 1e+15 1e+20 1e+25
Energy flux (erg cm
-2 s -1)
Frequency, ν (Hz) RADIO IR OPT. UV X-RAYS po bb TeV γ -RAYS (Potchefstroom) Flare bb VHE γ -RAYS (Durham) Burst Suzaku CRB (Jun 93) Burst (Oct 90) Flare (Oct 93) (Jul 89)
ROSAT EINSTEIN HST UVOT FUSE
Figure 6.Spectral energy distribution of AE Aqr. Catalogue data are the black filled squares with errorbars, and
the analysed data are the rest of the points. States of bursts and flares are indicated in the VHE and TeVγ-rays.
sion region of size∼3×108cm, comparable with the radius of the white dwarf. The VHE and TeV
γ-ray emission is most probably the result of burst-like particle acceleration events associated with
the magnetospheric propeller process [20, 24].
5 Summary
The peculiar properties of AE Aquarii have been discussed within observational and theoretical frame-work. The multi-wavelength emission from AE Aqr is generally the result of a combination of pro-cesses. It has been shown that the X-ray emission is predominantly soft and characterised by flares
and emission lines. The high variability and observed flares may suggest a very efficient magnetic
propeller process and a state of turbulance at the propeller zone, i.e. sporadic mass accretion. The predominant soft X-ray emission with emission lines superimposed on the continuum suggest an op-tically thin emission plasma with uniform temperature distribution. The double-pulsed profile of the UV emission suggests emission from the two magnetic poles of the white dwarf. Highly relativistic
exciting prospect for follow-up studies usingFermiand modern Cerenkov facilities like the High En-ergy Stereoscopic System (H.E.S.S.). This paper has made use of data supplied by the Chandra X-ray Center and UK Swift Science Data Centre. Busitema University provided the financial support.
References
[1] Abada-Simon M., Bastian T. S., Horne K., Bookbinder A. J., ASP Conf. Ser.85, 355 (1995)
[2] Abada-Simon M., Lecacheux A., Bastian T.M., Bookbinder J. A., Dulk G.A., ApJ406, 692 (1993)
[3] Bastian T. S., Dulk G. A., Chanmugam G., ApJ324, 431 (1988)
[4] Bookbinder J. A., Lamb D. Q.,ApJ323, 131 (1987)
[5] Bowden C. C. G., Bradbury S. M., Chadwick P. M., Dickinson et al., Astropart. Phys.1, 47 (1992)
[6] Brissenden R. J., ASP Conf. Ser.238, 22 (2001)
[7] Choi C-S., Dotani T., ApJ646, 1149 (2006)
[8] Choi C-S., Dotani T., , Agrawal P. C., ApJ525, 399 (1999)
[9] de Jager O. C., Meintjes P. J., O’Donoghue D., Robinson E. L., MNRAS267, 577 (1994)
[10] Eracleous M., Horne K., Robinson E. L., et al., ApJ433, 313 (1994)
[11] Eracleous M., Horne K., Osborne J. P., Clayton K. L., ASP Conf. Ser.85, 392 (1995)
[12] Evans P. A., Beardmore A. P., Page K. L., Osborne J. P., et al., MNRAS397, 1177 (2009)
[13] Gehrels N., Chincarini G., Giommi P., et al., ApJ611, 1005 (2004)
[14] Ikhsanov N. K., A&A325, 1045 (1997)
[15] Ikhsanov N. R., Neustroev V. V., Beskrovnaya N. G., Astron. Letters30, 675 (2004)
[16] Itoh K., Okada S., Ishida M., Kunieda H., ApJ639, 397 (2006)
[17] Larsson S., A&A Suppl. Ser.117, 197 (1996)
[18] Mauche C. W., MNRAS369, 1983 (2006)
[19] Mauche C. W., ApJ706, 130 (2009)
[20] Meintjes P. J., de Jager O. C., MNRAS311, 611 (2000)
[21] Meintjes P. J., de Jager O. C., Raubenheimer B. C., et al., ApJ434, 292 (1994)
[22] Meintjes P.J., Raubenheimer B.C., de Jager O.C., et al., ApJ401, 325 1992
[23] Meintjes P. J., Venter L. A., MNRAS360, 573 (2005)
[24] Oruru B., Meintjes P. J., MNRAS421, 1557 (2012)
[25] Patterson J., ApJ234, 978 (1979)
[26] Patterson J., Branch D., Chincarini G., Robinson E. L., ApJ240, L133 (1980)
[27] Reinsch K., Beuermann K., Hanusch H., Thomas H. -C., ASP Conf. Ser.85, 115 (1995)
[28] Schenker K., King A. R., Kolb U., Wynn G. A., Zhang Z.,MNRAS337, 1105 (2002)
[29] Terada Y., Hayashi T., Ishida M., et al., Publ. Astron. Soc. Japan60, 387 (2008)
[30] Venter L. A., Meintjes P. J., MNRAS378, 681 (2007)
[31] Weisskopf M. C., Brinkman B., Canizares C., et al., Publ. Astron. Soc. Pacific114, 1 (2002)
[32] Welsh W. F., Horne K., Oke J.B., ApJ406, 229 (1993)
[33] Welsh W. F., Horne K., Gomer R., ApJ410, L39 (1993)
[34] Welsh W. F., Horne K., Gomer R., MNRAS275, 649 (1995)
[35] Wynn G. A., King R. A., MNRAS275, 9 (1995)
[36] Wynn G. A., King R. A., Horne K., MNRAS286, 436 (1997)
![Figure 1. Left: Radio light curve of AE Aqr from VLA data [3]. Right: Optical and TeV γ-ray light curves fromdata observed with the SAAO 30 inch Cassegrain telescope and the Nooitgedacht Mk I Cherenkov telescope [21].](https://thumb-us.123doks.com/thumbv2/123dok_us/8641444.1431152/2.482.63.423.86.227/optical-fromdata-observed-cassegrain-telescope-nooitgedacht-cherenkov-telescope.webp)
![Figure 2. The magnetic propeller in AE Aqr. Distance of closest approach of the stream is ∼ 1010 cm [36].](https://thumb-us.123doks.com/thumbv2/123dok_us/8641444.1431152/3.482.155.328.86.195/figure-magnetic-propeller-aqr-distance-closest-approach-stream.webp)